quantitative PCR in drought‑stressed soybean
Renata Stolf‑Moreira(1), Eliana Gertrudes de Macedo Lemos(1), Ricardo Vilela Abdelnoor(2), Magda Aparecida Beneventi(3), Amanda Alves Paiva Rolla(4), Selma dos Santos Pereira(4),
Maria Cristina Neves de Oliveira(2), Alexandre Lima Nepomuceno(2) and Francismar Corrêa Marcelino‑Guimarães(2)
(1)Universidade Estadual Paulista, Via de Acesso Prof. Paulo Donato Castellane, s/no, CEP 14884‑900 Jaboticabal, SP. E‑mail: renatastolf@hotmail. com, egerle@fcav.unesp.br (2)Embrapa Soja, Rodovia João Carlos Strass, Distrito de Warta, Caixa Postal 231, CEP 86001‑970 Londrina, PR. E‑mail: ricardo@cnpso.embrapa.br, mcno@cnpso.embrapa.br, nepo@cnpso.embrapa.br, francm@cnpso.embrapa.br (3)Universidade Federal do Rio Grande do Sul, Av. Paulo Gama, no 110, CEP 90040‑060 Porto Alegre, RS. E‑mail: mabeneventi@gmail.com (4)Universidade Estadual de Londrina, Rodovia Celso Garcia Cid, Pr 445, Km 380, Caixa postal 6001, CEP 86051‑980 Londrina, PR. E‑mail: amanda@cnpso.embrapa.br, selma@cnpso.embrapa.br
Abstract – The objective of this work was to validate, by quantitative PCR in real time (RT-qPCR), genes to be used as reference in studies of gene expression in soybean in drought-stressed trials. Four genes commonly used in soybean were evaluated: Gmβ‑actin, GmGAPDH, GmLectin and GmRNAr18S. Total RNA was extracted from six samples: three from roots in a hydroponic system with different drought intensities (0, 25, 50, 75 and 100 minutes of water stress), and three from leaves of plants grown in sand with different soil moistures (15, 5 and 2.5% gravimetric
humidity). The raw cycle threshold (Ct) data were analyzed, and the efficiency of each primer was calculated for
an overall analysis of the Ct range among the different samples. The GeNorm application was used to evaluate the best reference gene, according to its stability. The GmGAPDH was the least stable gene, with the highest mean values of expression stability (M), and the most stable genes, with the lowest M values, were the Gmβ‑actin and GmRNAr18S, when both root and leaves samples were tested. These genes can be used in RT-qPCR as reference gene for expression analysis.
Index terms: Glycine max, expression stability, RT‑qPCR, water deficit.
Identificação de genes de referência para análise de expressão por PCR
quantitativo em tempo real, em soja submetida à seca
Resumo – O objetivo deste trabalho foi validar, pela técnica de PCR quantitativo em tempo real (RT-qPCR) genes para serem utilizados como referência em estudos de expressão gênica em soja, em ensaios de estresse hídrico. Foram avaliados quatro genes comumente utilizados em soja: Gmβ‑actin, GmGAPDH, GmLectine GmRNAr18S. O RNA total foi extraído de seis amostras: três amostras de raízes em sistema de hidroponia com
diferentes intensidades de déficit hídrico (0, 25, 50, 75 e 100 minutos de estresse hídrico), e três amostras de
folhas de plantas cultivadas em areia com diferentes umidades do solo (15, 5 e 2,5% de umidade gravimétrica).
Os dados brutos do intervalo "cycle threshold" (Ct) foram analisados, e a eficiência de cada iniciador foi
calculada para uma analise da Ct entre as diferentes amostras. A aplicação do programa GeNorm foi utilizada para a avaliação dos melhores genes de referência, de acordo com a estabilidade. O GmGAPDH foi o gene menos estável, com o maior valor médio de estabilidade de expressão (M), e os genes mais estáveis, com menor valor de M, foram o Gmβ‑actin e GmRNAr18S, tanto nas amostras de raízes como nas de folhas. Estes genes podem ser usados em RT-qPCR como gens de referência para análises de expressão gênica.
Termos para indexação: Glycine max, estabilidade de expressão, RT‑qPCR, déficit hídrico.
Introduction
Soybean has been the subject of many studies carried out to understand and quantify the processes that interfere with crop production in challenging environments (Popp et al., 2003). Biotechnological approaches to create new cultivars, with characteristics
that help minimize losses in production and improve the understanding of the genetic basis of adaptive responses to environmental stress, will facilitate the improvement of drought tolerance (Talamè et al., 2007).
Gene expression studies in plants include precise
quantification of mRNAs expressed in various
different developmental stages, and in different tissues
and cells. The quantification of mRNAs is usually
achieved by northern blotting or by ribonuclease protection assay (RPA) (Suzuki et al., 2000). These methods are less precise than RT-qPCR (Bustin, 2000), which has emerged as an important technique to compare the expression profiles of target genes in several species, tissues and treatments, and also to validate high-throughput gene-expression profiles (Crismani et al., 2006).
One of the methodologies used to determine expression levels by RT-qPCR compares the gene of interest with reference genes, whose expression does not change under different experimental conditions. Statistical analysis methods have been developed to identify the best reference genes for a certain organism or experimental condition (Vandesompele et al., 2002;
Pfaffl et al., 2004). The use of reference genes without prior verification of their expression stability can lead
to an inaccurate interpretation of the data and generate incorrect results. A reference gene should have stable expression in different organs, developmental stages, and environments. According to previous works on the best reference genes for transcription normalization in plants, the most reliable are those constitutively expressed and involved in basic cellular processes, such as protein and sugar metabolism and maintenance of cell structure (Cruz et al., 2009).
A large-scale comparative analysis of the most stable genes of Arabidopsis thaliana has shown that the best reference genes are those related to the ubiquitin degradation process, such as poly-ubiquitin, ubiquitin-conjugating enzymes and ubiquitin ligases (Czechowski et al., 2005). In the RT-qPCR
expression‑profile analysis of suitable reference genes
for a hybrid poplar (Populus spp.) and vitis (Vitis vinifera) (Reid et al., 2006), genes for tubulin and actin were stably expressed and considered the most reliable. Jain et al. (2006) showed that the best genes in various tissue samples from rice (Oryza sativa) were those encoding ubiquitin 5 and elongation factor-1 alpha. Genes that encode the proteins GAPDH (Wall & Edwards, 2002), β-actin (Kreuzer et al., 1999), tubulin (Brunner et al., 2004) or RNAr18S have been used for other species (Bhatia et al., 2002).
The objective of this work was to validate, by quantitative PCR in real time (RT-qPCR), genes to be used as reference in studies of gene expression in soybean in drought-stressed trials.
Materials and Methods
Soybean cultivar BR16, sensitive to drought (Oya et al., 2004), was grown hydroponically with nutrient solution (Hewitt, 1963) in a randomized block experimental design, with three 10-plant biological triplicates. The plants were grown for three weeks in a greenhouse (day, 30ºC±2ºC; night, 25ºC±2ºC), with relative humidity (RH) near 50%. At the V5 development stage, drought was obtained by withdrawing the nutrient solution. Root samples were collected immediately (TH0) and after 25, 50, 75 and 100 minutes of stress, and placed in liquid nitrogen for later molecular analysis. The samples were segregated into bulk 1, containing the treatments 25 and 50 min (TH1), and bulk 2 containing the treatments 75 and 100 min (TH2).
An experiment in sand culture was also carried out using the BR16 genotype. Two stress conditions were applied in addition to a control group (TS0), close to field capacity, at 15% GH (gravimetric humidity): one group was moderately stressed at 5% GH (TS1) and another was severely stressed at 2.5% GH (TS2), according to Jones (2007). Each group consisted of six plants,
for each treatment, sown in 10 L pots filled with sand,
irrigated with nutrient solution (Hewitt, 1963), placed in greenhouse (day, 30oC±2oC; night, 22±2oC; 40±5% RH), in a randomized block design. Plants were grown
for 45 days, which corresponded to the full‑flowering
stage (R2), under normal conditions (15% GH); then, water shortage was induced by withholding irrigation until the sand-moisture level reached 5% GH or 2.5%
GH at the grain‑filling stage (R5). The control group was kept at 15% GH until the end of the experiment (TS0). The pots were weighed daily to maintain the programmed moisture status. The third plant trifoliate from six plants, for each treatment, were collected and placed in liquid nitrogen for later molecular analysis.
Specific primers for the reference and target genes
were designed from expressed sequence tag (EST) regions in soybean (Table 1); these sequences were obtained at the GenBank (National Center for Biotechnology Information, 2001). The reference genes were:
Gmβ‑actin, a structural component of the cytoskeleton of cells; GmGAPDH, glyceraldehyde-3-phosphate dehydrogenase; GmRNAr18S, a ribosomal gene; and
Express Program version 3.0 (Applied Biosystems, São Paulo, SP, Brazil), and were adjusted to a melting temperature (Tm) varying between 59 and 62°C, with fragments in the 75–155 bp range. The primers were screened for hairpins, dimer formation, and
target specificity by BlastN (Blast, 2011), against
the nucleotide databank. Primer pairs were tested
for specificity by RT‑PCR and also by RT‑qPCR,
followed by a dissociation curve and agarose-gel electrophoresis.
To pinpoint the best reference genes in soybean, which are responsive to drought, reference genes from other species were used for a BlastX search against a Glycine max EST library, constructed from roots
submitted to drought. Specific primers were designed and tested for amplification efficiency, to be used as
references (Table 1).
Total RNA was extracted from all tissue samples (leaves and roots) in each experiment using trizol reagent (Invitrogen, São Paulo, SP, Brazil), according to the manufacturer’s instructions. RNA quality analysis
and quantification were performed by agarose‑gel
analysis and a NanoDrop ND-1000 spectrophotometer
(Thermo Scientific, São Paulo, SP, Brazil)
measurement, respectively. This procedure was crucial to guarantee the same amount of starting material and
equivalent efficiencies of cDNA synthesis from total
RNA samples. The protocol used to synthesize cDNA was obtained from Schenk et al. (2003), using the reverse-transcriptase Superscript II First Strand Synthesis Kit (Invitrogen, Carlsbad, CA, USA). To prepare the cDNA, 1 µg total RNA was mixed with random primers (5 ng µL-1).
Polymerase chain reactions were performed in 96-well plates using SYBR Green (Invitrogen, Carlsbad, CA, USA) to detect dsDNA (double strand) synthesis.
Reactions were done in 25‑μL volumes containing PCR
buffer with 1.5 mmol L-1 MgCl
2, 0.1 mmol L-1 dNTPs, 0.25 U Taq Platinum, 0.1 × SYBR Green (Invitrogen, Carlsbad, CA, USA), 0.2 µmol L-1 final concentration for the GmRNAr18S, GmGAPDH and target gene, 0.15 µmol L-1 for Gmβ-actin and GmLectin, and 10 μL sscDNA (corresponding to 5 ng of total RNA). Aliquots from the ssDNA (single strand) samples were used with all primer sets in two separate experiments. Two biological replicates, for each sample, were used for real-time PCR analysis, and three technical replicates were analyzed for each biological replicate.
Reactions were run in a 7300 RT-qPCR thermocycler (Applied Biosystems, Foster, CA, USA) using the following cycling parameters: 50°C for 2 min, 95°C for 10 min, 45 cycles at 95°C for 2 min, 62°C for 30 seconds and 72°C for 30 seconds; the data were collected in the last (extension) phase. No-template controls (NTCs) were included for each primer pair. Dissociation curves for each amplicon and agarose
gel were analyzed to verify the specificity of each amplification reaction; the curves were obtained by
heating the amplicons from 60 to 95°C with readings at one Celsius degree intervals. After the PCR reaction,
raw fluorescence data generated in sequence detection was used for the calculation of primer amplification efficiency and cycle threshold (Ct) determination. It
accounts for each PCR exponential curve, making it
possible to have accurate values for the quantification
of RT-qPCR.
The calculation of primer amplification efficiency
and Ct determinations were achieved using the miner algorithm (Zhao & Fernald, 2005), corresponding to the formula E = [10-1/slope], used to calculate the reaction
efficiency. The calibration curve was established by the
Ct and the log of cDNA dilutions, and the results were
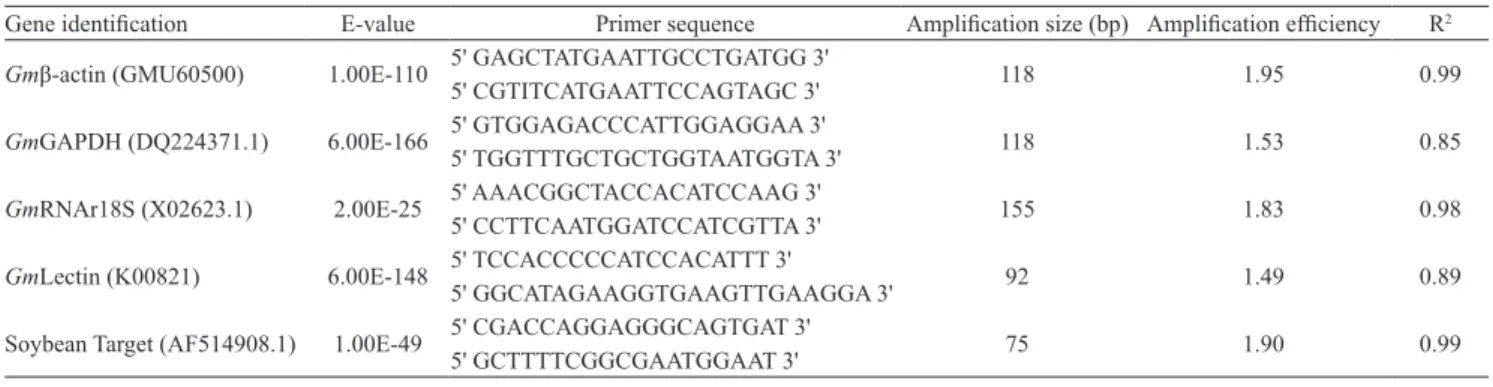
Table 1. Gene description, primer sequences and efficiency of the selected ESTs.
Gene identification E-value Primer sequence Amplification size (bp) Amplification efficiency R2
Gmβ‑actin (GMU60500) 1.00E-110 5' GAGCTATGAATTGCCTGATGG 3' 118 1.95 0.99
5' CGTITCATGAATTCCAGTAGC 3'
GmGAPDH (DQ224371.1) 6.00E-166 5' GTGGAGACCCATTGGAGGAA 3' 118 1.53 0.85
5' TGGTTTGCTGCTGGTAATGGTA 3'
GmRNAr18S (X02623.1) 2.00E-25 5' AAACGGCTACCACATCCAAG 3' 155 1.83 0.98
5' CCTTCAATGGATCCATCGTTA 3'
GmLectin (K00821) 6.00E-148 5' TCCACCCCCATCCACATTT 3' 92 1.49 0.89
5' GGCATAGAAGGTGAAGTTGAAGGA 3'
Soybean Target (AF514908.1) 1.00E-49 5' CGACCAGGAGGGCAGTGAT 3' 75 1.90 0.99
analyzed by the Sequence Detection v. 1.2.2 software (Perkin Elmer do Brasil, São Paulo, SP, Brazil). Cycle threshold data were analyzed by the Relative
Expression Software Toll (REST) version 2.0.7 (Pfaffl
et al., 2002), varying the gene used as reference, in order to verify the expression stability between tissues analyzes (leaf and root), stress treatments (drought and control), genotype (BR16) and type of experiment (hydroponic and sand).
The GeNorm v. 3.4 software (Pattyn et al., 2003) was used for the analysis of gene-expression stability and rank; the best reference gene for soybean was selected by the GeNorm application (Vandesompele et al., 2002). This application calculates a gene stability value (M) and a normalization factor (NF) based on the geometric mean of the expression values of the set of control genes tested. The program considers two different factors to analyze gene-expression stability: the average expression stability (M) and pairwise variation (V). The lower the M value, the more stably expressed the gene is. The GeNorm application enables the exclusion of the most unstable gene to recalculate the M value. A Microsoft Excel
file with the raw expression Ct values, generated with
the miner algorithm, for each tested gene, in the two
different samples, was first analyzed with the Statistica
software (StatSoft, 2005) and then transferred into the expression stability program GeNorm. This application
defines the most stable genes, by calculating the mean
pairwise variation between a particular gene and all others used in an experiment, and determines M values. The highest M value corresponds to the least stable expression in a set of samples. The normalization
factor (NF) is defined by the M values of the most
stable genes, which establishes the minimum number of reference genes required for an accurate calculation of the relative expression of a target gene. The ideal number is given by the inclusion of a certain number of
genes in the NF calculation, until there is no significant
contribution to an additional gene.
Results and Discussion
The amplification efficiency for the four tested
primer pairs varied from 1.49 to 1.95, which are the expected values for compared genes. Each primer
system showed differences in amplification efficiency;
the REST software adjusts the expression results
according to the efficiency value using the formula:
Ratio = (Etarget) ∆Ct target (control‑sample)/(Eref) ∆Ct ref (control‑sample),
from Pfaffl et al., 2002.
The range and distribution of the Ct values allow for a visualization of the least variable genes, among the samples (Figure 1). The most stable genes, Gmβ‑actin
and GmRNAr18S, have the narrowest Ct range and the smallest deviation from the Ct median. The Ct values of the candidate reference genes, in all samples, were within 16.63 and 35.85 cycles, showing a wide range of variation between them.
The Ct values indicate the detection sensitivity of cDNA, showing variations in the reaction, with Ct values varying from three to four cycles within each sample, in triplicate. This may represent a combination of the intrinsic variability of the RT-qPCR protocol and biological variation. Technical variation may be attributed to uncontrollable factors, such as errors in total mRNA estimates (spectrophotometric errors and impurities absorbing at 260 nm) and the variation in
efficiency in different reverse‑transcription reactions.
The target gene normalized with the GmRNAr18S and Gmβ‑actin references showed the lowest
expression levels in the leaves, in both treatments, but in T1 showed the highest expression levels for all reference genes (Table 2) in the root. Depending on the expression levels of the tested genes, it is possible to choose reference genes with similar expression. Since there were no differences among samples within each
Figure 1. Box-whisker showing the cycle threshold (Ct)
organ, the Gmβ-actin and GmRNAr18S genes were considered the best references for this trial, because the RQ values of the target gene normalized with these two reference genes remained constant (Table 2).
Primer amplification efficiency for each reaction
with the reference genes was determined from the slope (inclination value of the straight line, bx) of the
exponential phase of amplification by RT‑qPCR, within an experiment designed to compare organ‑specific
differences in gene expression (Table 1). The
GmRNAr18S gene was used as the primary standard
for RT‑qPCR. Based on the efficiency data, the reaction
with the GmRNAr18S gene could be used as the primary reference to estimate relative gene expression.
Efficiency and sensitivity determination of the reaction
primer showed acceptable values for the Gmβ-actin and GmRNAr18S genes.
A reference gene should be expressed at relatively constant levels in different tissues and at all developmental stages, and should be unaffected by experimental conditions (Bustin, 2000). Based on the obtained data, the RQ values normalized with the Gmβ-actin and GmRNAr18S genes were more consistent across organs and treatments than those normalized with GmLectin and GmGAPDH (Table 2).
The GAPDH gene, which encodes an enzyme in the glycolytic path, is present in most cell types and has been used as an endogenous control in RT-qPCR experiments in animal and human samples (Wall & Edwards, 2002). Studies in mammalian systems have suggested that the utility of this gene is limited as an endogenous control, due to expression variation in some tissues and to variability resulting from experimental treatment (Giulietti et al., 2001). The gene for GAPDH should be used with caution because its expression can be more abundant in proliferating cells (Bustin, 2002).
Out of the four genes used for analysis, only the
GmGAPDH showed an M value higher than the cutoff established by GeNorm (M<1.5), and three of them (GmLectin, GmRNAr18S and Gmβ‑actin) showed the
lowest M values, well-suited numbers for reference genes (Mamo et al., 2007) (Table 3 and Figure 2). After exclusion of the least stable gene, GmGAPDH, there
Table 2. Relative expression of target gene in soybean
samples, with four set primer pairs: GmLectin, GmGAPDH, GmRNAr18S and Gmβ‑actin.
Gene Treatment Expression CI95 (%) P(H1) Result Hidroponic system (roots)(1)
GmLectin TH1 5.476 [4.331-7.645] 0.048 Up
TH2 0.156 [0.100-0.252] 0.000 Down
GmGAPDH TH1 5.127 [3.940-6.482] 0.048 Up
TH2 0.227 [0.169-0.296] 0.000 Down
GmRNAr18S TH1 7.879 [5.103-11.260] 0.000 Up
TH2 0.144 [0.098-0.203] 0.000 Down
Gmβ‑actin TH1 7.581 [2.050-25.613] 0.000 Up
TH2 0.22 [0.093-0.396] 0.000
Sand system (leaves)(2)
GmLectin TS1 0.036 [0.019-0.068] 0.037 Down
TS2 0.202 [0.117-0.288] 0.060
GmGAPDH TS1 0.022 [0.014-0.043] 0.037 Down
TS2 0.182 [0.147-0.216] 0.060
GmRNAr18S TS1 0.022 [0.017-0.029] 0.037 Down
TS2 0.009 [0.008-0.010] 0.060
Gmβ‑actin TS1 0.013 [0.005-0.037] 0.037 Down
TS2 0.025 [0.014-0.041] 0.100 (1)TH
1, plants grown under 25 to 50 minutes of water stress; TH2, plants
grown under 75 to 100 minutes of water stress. (2)TS
1, plants grown under
normal conditions at 15% gravimetric humidity (GH); TS2, sand moisture
level at 5% GH; TS2, 2.5% GH.
Table 3. Normalization factor for treatments, and M values
for reference genes.
Treatments Normalization M value
Factor GmLectinGmGAPDHGmRNAr18S Gmβ‑actin Hidroponic (roots)(1)
TH0 1.02
TH1 1.00 0.037 0.048 0.023 0.023
TH2 0.96
Sand (leaves)(2)
TS0 1.08
TS1 1.06 0.146 0.132 0.086 0.086
TS2 0.86
(1)TH
0, root samples collected immediately after withdraw of the nutrient solution;
TH1, after 25 and 50 min; and TH2, after 75 and 100 min. (2)TS0, substrate with
15% gravimetric humidity (GH); TS1, 5% GH; and TS2, 2.5% GH.
Figure 2. Average expression stability values (M) of remaining
were decreases in the M values of the other genes and changes in the M values of the unstable genes. Although the difference in the M values of the GmLectin gene was higher in comparison to the GmRNAr18S and
Gmβ‑actin genes, its inclusion as a reference gene
in RT-qPCR is recommended because of its high expression values, which is important whenever tested genes are highly expressed.
The use of a reference gene for RT-qPCR in rice showed expression consistency in comparison to the GAPDH, β-actin and β-tubulin genes, at various seedling-development stages and after UV radiation (Kim et al., 2003). The high abundance of mRNA requires higher dilutions of cDNA to allow direct
comparison with the target gene amplification. These
stock dilutions require more work and introduce more error, leading to greater inaccuracy in RT-qPCR analyses (Iskandar et al., 2004). Consequently, it is advantageous to have a reference gene that is expressed at levels similar to those of the genes of interest, and to choose treatments that have little effect on the reference gene (Suzuki et al., 2000).
The Gmlectin gene did not provide results that justify its use as reference, although it showed acceptable M values. This gene was present in a single copy in the soybean genome, but it is not necessarily constitutive. If its expression shows variations, relative
quantification would be difficult (Brunner et al., 2004;
Czechowski et al., 2005). However, it could still be used as a reference to provide the number of copies of the genome.
Pairwise variation of the reference genes suggested that Gmβ‑actin and GmGAPDH were the more stable and least stable ones, respectively. Nevertheless, there were only slight differences in the stabilities of the other genes (Figure 3). The second and third best reference genes were GmRNAr18S and GmLectin, with a 0.72 difference in M values (Figure 2). Using others rare transcripts as references, such as transcription factors, may cause problems in normalizing RT-qPCR experiments. Gene expression for β-actin or tubulin usually depends on plant developmental stage (Diaz-Camino et al., 2005).
When all four genes were analyzed with pairwise
variation, there was no significant difference in the V
numbers; however, there was an increase in instability with the addition of the GmGAPDH gene (V3/4) (Figure 3), which is relatively unstable, as shown by
the Ct distribution in Figure 1. The optimal cutoff V number, according to Vandersompele (2002), should be around 0.15, but other works using this application have shown a higher V number (Kuijk et al, 2007), depending on the number of genes and types of sample tested. In soybean, the addition of a fourth
gene did not contribute significantly to stability, in
the comparison of both tissues. Only two reference genes, Gmβ‑actin and GmRNAr18S, should be used for RT-qPCR experiments on roots and leaves of the studied accession, when submitted to drought.
Conclusions
1. RQ values normalized with the Gmβ-actin and
GmRNAr18S genes have lower variations in organs and treatments.
2. Gmβ‑actin and GmRNAr18S are the most stable
genes, based on their transcriptional profiles and
GeNorm analysis.
3. Gmβ‑actin and GmRNAr18S can be used as reference genes in soybean under water stress.
Acknowledgments
To the Japan International Research Center for
Agricultural Sciences, for financial support; to Embrapa
Soja, for providing laboratory facilities.
Figure 3. Pairwise variation (V) of the selected reference
References
BHATIA, P.; TAYLOR, W.R.; GREENBERG, A.H.; WRIGHT, J.A. Comparison of glyceraldehyde-3-phosphate dehydrogenase and 28S-ribosomal RNA gene expression as RNA loading controls for northern blot analysis of cell lines of varying malignant potential.
Analytical Biochemistry, v.216, p.223-226, 2002.
BLAST. Basic Local Alignment Search Tool [home page]. Available at: <http://blast.ncbi.nlm.nih.gov/Blast.cgi >. Accessed on: 17 Feb. 2011.
BRUNNER, A.M.; YAKOVLEV, I.A.; STRAUSS, S.H. Validating internal controls for quantitative plant gene expression studies. BMC Plant Biology, v.4, 2004. Http://dx.doi. org/10.1186/1471-2229-4-14.
BUSTIN, S.A. Absolute quantification of mRNA using real‑time
reverse transcription polymerase chain reaction assays. Journal of
Molecular Endocrinology, v.25, p.169-193, 2000.
BUSTIN, S.A. Quantification of mRNA using real time reverse transcription PCR (RT-PCR): trends and problems. Journal of
Molecular Endocrinology, v.29, p.23-39, 2002.
CRISMANI, W.; BAUMANN, U.; SUTTON, T.; SHIRLEY, N.; WEBSTER, T.; SPANGENBERG, G.; LANGRIDGE, P.; ABLE, J.A. Microarray expression analysis of meiosis and microsporogenesis in hexaploid wheat. BMC Genomics, v.7, 2006. Http://dx.doi.org/10.1186/1471-2164-7-267.
CRUZ, F.; KALAOUN, S.; NOBILE, P.; COLOMBO, C.; ALMEIDA, J.; BARROS, L.M.G.; ROMANO, E.; GROSSI-DE-SÁ, M.F.; VASLIN, M.; ALVES-FERREIRA, M. Evaluation of coffee reference genes for relative expression studies by quantitative real-time RT-PCR. Molecular Breeding, v.23, p.607-616, 2009.
CZECHOWSKI, T.; STITT, M.; ALTMANN, T.; UDVARDI, M.K.; SCHEIBLE, W.R. Genome‑wide identification and testing of superior reference genes for transcript normalization in
Arabidopsis. Plant Physiology, v.139, p.5-17, 2005.
DIAZ-CAMINO, C.; CONDE, R.; OVSENEK, N.; VILLANUEVA, M.A. Actin expression is induced and three isoforms are differentially expressed during germination of Zea mays. Journal
of Experimental Botany, v.56, p.557-565, 2005.
GIULIETTI, A.; OVERBERGH, L.; VALCKX, D.; DECALLONNE, B.; BOUILLON, R.; MATHIEU, C. An overview of real-time quantitative PCR: applications to quantify cytokine genes expression. Methods, v.25, p.386-401, 2001.
HEWITT, E.J. Mineral nutrition of plants in culture media. In: STEWARD, F.C. (Ed). Plant physiology: a treatise. New York: Academic, 1963. v.3, p.97-133.
ISKANDAR, H.M.; SIMPSON, R.S.; CASU, R.E.; BONNETT, G.D.; MACLEAN, D.J.; MANNERS, J.M. Comparison of reference genes for quantitative real-time polymerase chain reaction analysis of gene expression in sugarcane. Plant Molecular Biology Report, v.22, p.325-337, 2004.
JAIN, M.; NIJHAWAN, A.; TYAGI, A.K.; KHURANA, J.P. Validation of housekeeping genes as internal control for studying gene expression in rice by quantitative real-time PCR. Biochemical and
Biophysical Research Communications, v.345, p.646-651, 2006.
JONES, H.G. Monitoring plant and soil water status: established and novel methods revisited and their relevance to studies of drought tolerance. Journal of Experimental Botany, v.58, p.119-130, 2007.
KIM, B.R.; NAM, H.Y.; KIM, S.U.; KIM, S.I.; CHANG, Y.J. Normalization of reverse transcription quantitative-PCR with housekeeping genes in rice. Biotechnology Letters, v.25, p.1869-1872, 2003.
KREUZER, K.A.; LASS, U.; LANDT, O.; NITSCHE, A.; LASER, J.; ELLEBROK, H.; PAULI, G.; HUHN, D.; SCHMIDT, C.A.
Highly sensitive and specific fluorescence reverse transcription‑PCR
assay for the pseudogene-free detection of beta-actin transcripts as quantitative reference. Clinical Chemistry, v.45, p.297-300, 1999.
KUIJK, E.; PUY, L. du; TOL, H.T. van; HAAGSMAN, H.P.; COLENBRANDER, B.; ROELEN, B.A.J. Validation of reference genes for quantitative RT-PCR studies in porcine oocytes and preimplantation embryos. BMC Developmental Biology, v.7, 2007. Http://dx.doi.org/10.1186/1471-213X-7-58.
MAMO, S.; GAL, A.B.; BODO, S.; DINNYES, A. Quantitative evaluation and selection of reference genes in mouse oocytes and embryos cultured in vivo and in vitro. BMC Developmental
Biology, v.7, 2007. http://dx.doi.org/10.1186/1471-213X-7-14.
NATIONAL CENTER FOR BIOTECHNOLOGY INFORMATION.
National Center for Biotechnology Information [home page].
Available at: <http://www.ncbi.nlm.nih.gov/>. Accessed on: 16 Feb. 2011.
OYA, T.; NEPOMUCENO, A.L.; NEUMAIER, N.; FARIAS, J.R.B.; TOBITA, S.; ITO, O. Drought tolerance characteristics of Brazilian soybean cultivars-evaluation and characterization of drought tolerance of various Brazilian soybean cultivars in the
field. Plant Production Science, v.7, p.129-137, 2004.
PATTYN, F.; SPELEMAN, F.; DE PAEPE, A.; VANDESOMPELE, J. RTPrimerDB: the real-time PCR primer and probe database.
Nucleic Acids Research,v.1, p.122-123, 2003.
PFAFFL, M.W.; HORGAN, G.W.; DEMPFLE, L. Relative expression software tool (REST) for group-wise comparison and statistical analysis of relative expression results in real-time PCR.
Nucleic Acids Research, v.30, 2002. http://dx.doi.org/10.1093/
nar/30.9.e36.
PFAFFL, M.W.; TICHOPAD, A.; PRGOMET, C.; NEUVIANS, T.P. Determination of stable housekeeping genes, differentially regulated target genes and sample integrity: BestKeeper- Excel-based tool using pairwise correlation. Biotechnology
Letters, v.26, p.509-515, 2004.
POPP, M.P.; DILLON, C.R.; KEISLING, T.C. Economic and
weather influences on soybean planting strategies on heavy soils.
Agricultural Systems, v.76, p.969-984, 2003.
REID, K.E.; OLSSON, N.; SCHLOSSER, J.; PENG, F.; LUND, S.T. An optimized grapevine RNA isolation procedure and statistical determination of reference genes for real-time RT-PCR during berry development. BMC Plant Biology, v.6, 2006. http:// dx.doi.org/10.1186/1471-2229-6-27.
MACLEAN, D.J. Systemic gene expression in Arabidopsis during an incompatible interaction with Alternaria brassicicola. Plant
Physiology, v.132, p.999-1010, 2003.
STATSOFT. Statistica: data analysis software system. Version 7.1. Tulsa: StatSoft, 2005.
SUZUKI, T.; HIGGINS, P.J.; CRAWFORD, D.R. Control selection for RNA quantitation. BioTechniques, v.29, p.332-337, 2000.
TALAMÈ, V.; OZTURK, N.Z.; BOHNERT, H.J.; TUBEROSA,
R. Barley transcript profiles under dehydration shock and drought
stress treatments: a comparative analysis. Journal of Experimental
Botany, v.58, p.229-240, 2007.
VANDESOMPELE, J.; DE PRETER, K.; PATTYN, F.; POPPE, B.; VAN ROY, N.; DE PAEPE, A.; SPELEMAN, F. Accurate normalization of real-time quantitative RT-PCR by geometric averaging of multiple internal control genes. Genome Biology, v.3, 2002. http://dx.doi.org/10.1186/gb-2002-3-7-research0034.
WALL, S.J.; EDWARDS, D.R. Quantitative reverse transcription-polymerase chain reaction (RT-PCR): a comparison of primer-dropping, competitive, and real-time RT-PCRs. Analytical
Biochemistry, v.300, p.269-273, 2002.
ZHAO, S.; FERNALD, R.D. Comprehensive algorithm for quantitative real-time polymerase chain reaction. Journal of
Computational Biology, v.12, p.1047-1064, 2005.