___________________________
1 Ing. Agrícola, M. Sc., Universidad Nacional de Colombia, Facultad de Ingeniería, Departamento de Ingeniería Civil y Agrícola,
Bogotá D.C.; [email protected].
2 Profesor Asistente, Ph. D., Universidad Nacional de Colombia, Facultad de Ingeniería, Departamento de Ingeniería Civil y
Agrícola, Bogotá D.C.; [email protected].
3 Profesor Asociado, Ph. D., Universidad Nacional de Colombia, Facultad de Ingeniería, Departamento de Ingeniería Civil y
Agrícola, Bogotá D.C.; [email protected]. Recebido pelo Conselho Editorial em: 9-4-2012
CHANGES IN WATER AVAILABILITY IN THE SOIL DUE TO TRACTOR TRAFFIC
KATHERINE GÓMEZ-RODRÍGUEZ1, JESÚS H. CAMACHO-TAMAYO2, JAVIER E.
VÉLEZ-SÁNCHEZ3
ABSTRACT: Frequent traffic of tractors in agricultural soils, promotes soil compaction and affects the flow and water availability. The aim of this research was to study the effect of compaction induced by tractor traffic on water availability in the soil under different traffic intensities on the same path (0, 1, 3, 6 and 10 passages), to two tractors with 3.3 and 2.6 ton of weights, over three different surface conditions. The study was conducted in an Andisol, representative soil of the study area. It was determined the behavior of the water retention curve, obtaining the gravitational water, available water and hygroscopic water, to 10 and 30 cm of depth. The hygroscopic water is the most prevalent with values of up to 80% of the total water present in the soil. The water retention curves showed increases in the values of field capacity and wilting point and behaviors "flattened" indicating a high sensitivity to the applied treatments, representative of compacted soils, which give the surfaces studied characteristics do not suitable for normal crop development.
KEYWORDS: compaction, soil management, water retention curve, Andisol.
MUDANÇAS NA DISPONIBILIDADE DE ÁGUA DO SOLO DEVIDO AO TRÁFEGO DE TRATORES
RESUMO: O tráfego frequente de tratores em solos agrícolas favorece a compactação dos solos e afeta o fluxo e a disponibilidade da água. O objetivo do presente trabalho foi estudar o efeito da compactação induzida pelo tráfego do trator na disponibilidade de água do solo, sob diferentes intensidades de trânsito sobre o mesmo caminho (0, 1, 3, 6 e 10 passadas), para dois tratores com pesos de 3,3 e 2,6 ton, em três condições de superfície diferentes. O estudo foi desenvolvido em um Andisol, solo representativo da zona estudada. Determinou-se o comportamento da curva de retenção de umidade, obtendo-se a água gravitacional, a água disponível e água higroscópica, a profundidades de 10 e 30 cm. Encontrou-se uma predominância da água higroscópica com valores de até 80% da água total presente no solo. As curvas de retenção de umidade apresentaram incrementos nos valores de capacidade de campo e ponto de murchamento permanente e com
comportamentos “achatados” indicando uma alta sensibilidade aos tratamentos aplicados, representativa de solos compactados, o qual confere às superfícies estudadas características não aptas para o desenvolvimento normal de culturas.
PALAVRAS CHAVE: compactação, manejo de solos, curva de retenção de água, Andisol.
INTRODUCTION
second and the following passages of the tractor cause less compaction than the first, being the fifth passage responsible for compaction in the soil surface layer agreeing with numerous studies cited by the aforementioned author and TOLON BECERRA et al. (2010) ensure that up the fifth passage the pressure exerted on the ground by a tractor 2WD FWA, causes surface compaction.
The changes or behaviors in several soil physical properties and their interrelations are great tools to measure the state of degradation of a soil. Properties such as bulk density of a soil, influence the behavior of porosity and water availability in the soil, affecting the reserve, the water and nutrient movement to the crop roots. GERSTER et al. (2008) found changes in sectors transited by agricultural implements, showing increases in bulk density, in soil resistance and in the moisture content at field capacity and in the permanent wilting point, while the water content to saturation and the gravitational water were lower with respect to those sectors that received no traffic.
The water availability in a soil is affected by countless parameters, which are the vehicle traffic , the texture, the moisture content, the soil particle size, the state of degradation, the plowing, among others (BOTTA et al., 2012; CAMACHO-TAMAYO & RODRIGUEZ, 2007). The relation between the soil water content and the strength that is retained is determined usually by the moisture retention curve, because as the soil moisture content decreases, it requires more energy to extract the retained water (FU et al., 2011). PIRES et al. (2005) claim that the values of field capacity (FC) and permanent wilting point (PWP) can be deduced from the behavior of the moisture retention curve when applying voltages between 0.1 to 0.3 bars for DC and voltages above 15 bars for PWP. MADDEN (2010) classifies the presence of water in the soil as gravitational water, available and hygroscopic. SERAFIM et al. (2008) reported that changes in the bulk density and porosity alter the soil moisture retention, at the same time the retention curves are found flatten as the compression increases. LIPIEC et al. (2009) found that the behavior of the hydraulic properties is largely dependent on the interactions between the level of compaction, the aggregate size and the depth studied.
The aim of this study was to investigate the influence of compaction caused by a tractor on the water availability in a soil and the ways in which it is presented and varies as it receives higher traffic intensity.
MATERIALS AND METHODS
The study was conducted in Marengo Agricultural Center (MAC), located in the city of Mosquera - Cundinamarca at 2,543 m altitude, with geographic coordinates 4° 42'N and 74° 12' W. The area has an average annual temperature of 13.1 °C and average annual rainfall of 665 mm. The soil belongs to the Marengo serie, originated from lacustrine sediments with volcanic ash debris and contribution of alluvial clays presenting a poor natural drainage (IGAC, 1977). The morphology of the soil profile shows dark brown color, with frank textures in the plow layer, with percentages of sand, silt and clay of 36%, 44% and 21% respectively, and average bulk density of 2.22 g cm-3.
TABLE 1. Characteristics of the tractors used.
Characteristics Tractor 1 (T1) Tractor 2 (T2) Power 46 kW (62.8 HP) (2WD) 48 kW (65.3 HP) (FWA)
Length 3735 mm 3415 mm
Width 2060 mm 1830 mm
Height 2450 mm 1650 mm
Track width 1247 mm 1119 mm
Wheelbase 2280 mm 2115 mm
Total weight 3360 kg 2614 kg
Static forward mass 1008 kg 1046 kg
Static rear mass 2352 kg 1568 kg
Forward pressure applied to the soil 104.88 kPa 59.53 kPa Back pressure applied to the soil 67.82 kPa 52.82 kPa Operation speed 5.5 km h-1 5.6 km h-1 Tires F 7.5-16 / B 18.4-30 F 11.2-24 / B 14.9-30
TABLE 2.Description of the traffic surfaces.
Use Description MC, %(1)
Prepared (PR) 1 plow, two plow with eccentric disc 44.19 Pasture (P1) Kikuyo Pasture (Pennisetum clandestinum) 31.10 Pasture (P2) Kikuyo Pasture (Pennisetum clandestinum) 41.36 (1) Gravimetric moisture content
During the essay, the tractors were not working neither showed attached implements, not showing therefore weight transference to the rear tires. The pressure exerted by the tires on the soil was estimated from the front and rear static weights informed by the manufacturers and the contact area calculated from Equation 1 proposed by INNS & KILGOUR (1978), authors who resembled the contact area with a rectangle.
where A is the contact area, b is the tire mean width when it is filled with the correct pressure and d is the overall diameter.
To find the characteristic curve of water retention of the soil, was used membrane equipment and pressure cookers, between 0.1 and 15 bar, including the saturation point (0 bar). Such curve resulted the dots between field capacity (FC) and permanent wilting point (PWP), providing the information on available water in the studied soil. The obtained curves have been adjusted to the VAN GENUCHTEN model (1980). From the information provided by the curve, it was found the gravitational water (GW), the available water (AW) and the hygroscopic water (HG) (Equations 2, 3 and 4) (FLORES & ALCALÁ, 2010):
FC P
GW(%) sat (2)
PWP FC
AW(%) (3) PWP
HG(%) (4) where,
Psat: Moisture content at saturation (cm3 cm-3),
FC: Moisture content at 0.3 bar (cm3 cm-3), PWP: Moisture content at 15 bar (cm3 cm-3).
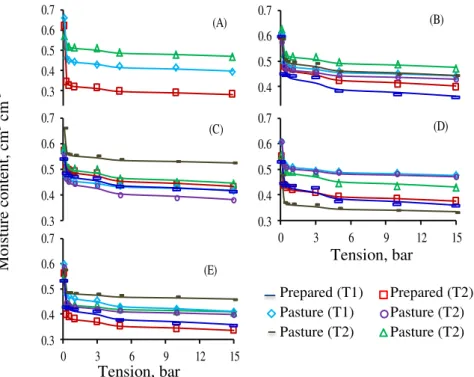
It was found for each treatment the moisture retention curve (Figures 1 and 2), these were adjusted to the GENUCHTEN VAN model (1980), which have correlation coefficients between 95.7% and 99.8%, indicating an optimal adjustment to this model. The values of FC and PWP is found at pressures between 0.3 and 15 bar, according to the methodology described by PIRES et al. (2005).The curves found have typical behavior of loam soil in accordance with studies from GHANBARIAN-ALAVIJEH et al. (2010).The values of field capacity range from 0.32 to 0.55 cm3 cm-3, which is higher on the P2 surface. These values agree with the above by MEZA & GEISSERT (2003) for andic soils.
Generally it can be noted the increasing in the water retention of the soil studied with the load applied to the soil, as it was also reported by SEVERIANO et al. (2011).The behavior of the curves at 10 cm depth did not show a general trend, being noticed increments in the moisture content in the PR soil, on the total of the evaluated treatments, these increments are found between 21.6% and 51.9% to FC and between 20.0% and 55.1% in PWP, presenting the highest values in the third passage of both tractors. In the second studied depth (30 cm), the retention curve shows lower increases in the moisture content, but is still predominating the ascending behavior with increments between 8.17% to 32.1% the FC and between 15.6% to 46, 1% for PWP, exerting greatest influence on the third passage, in the same way as in the first 10 cm depth. This behavior is cited by ALAOUI et al. (2011), when presenting compression increments.
As regards the variation of the retention curve for treatments with P1 and P2 vegetation cover, the behaviors are mutually contradictory, because to the P1 surface it presents increases in respect to the control with the exception of the tenth passage of the Tractor at 2 to 10 cm depth while the P2 soil the tendency is decreasing with respect to the control, considering both depths studied. The decreases of the P2 values are between 0.6 and 29.2%, showing greater reduction on the sixth passage of tractor 1 to FC and PWP respectively. At 30 cm depth, the declines were of lower magnitude, with a maximum reduction of 10.4% of the control on the first passage of tractor 1.
The curves have a "flat" behave, which reflect the distribution of pores, noticing a greater presence of small pores in the studied soils, which is in agreement with that found by DIJCK & ASCH (2002). This flat tendency in the retention curve shows a clear impact of soil compaction, reducing the interval between FC and PWP.
0.3 0.4 0.5 0.6 0.7
0 3 6 9 12 15
(B) 0.2 0.3 0.4 0.5 0.6 0.7
0 3 6 9 12 15
(A) 0.3 0.4 0.5 0.6 0.7
0 3 6 9 12 15
(C) 0.3 0.4 0.5 0.6 0.7
0 3 6 9 12 15
(E) 0.3 0.4 0.5 0.6 0.7
0 3 6 9 12 15
(D)
Preparado (T1) Pasto 1 (T1) Pasto 2 (T1)
Preparado (T2) Pasto 1 (T2) Pasto 2 (T2)
C ont eni do de hum edad, cm
3 cm
-3
Tensión, bar
Tensión, bar
FIGURE 1. Water retention curve for three surfaces, at 10 cm depth, with 0 passage (A), 1 passage (B), 3 passages (C), 6 passages (D) and 10 passages (E), adjusted with the Van Genuchten model. Tension, bar Tension, bar Moi st ur e c ont ent , cm
3 cm
Preparado (T1) Pasto 1 (T1) Pasto 2 (T1)
Preparado (T2) Pasto 1 (T2) Pasto 2 (T2)
C ont eni do de hum edad, cm
3 cm
-3 Tensión, bar 0.3 0.4 0.5 0.6 0.7
0 3 6 9 12 15
(A) 0.3 0.4 0.5 0.6 0.7
0 3 6 9 12 15
(B)
0.4 0.5 0.6 0.7
0 3 6 9 12 15
(C)
0.4 0.5 0.6 0.7
0 3 6 9 12 15
(D) 0.3 0.4 0.5 0.6 0.7
0 3 6 9 12 15
(E)
Tensión, bar
FIGURE 2. Water retention curve for three surfaces, at 30 cm depth, with 0 passage (A), 1 passage (B), 3 passages (C), 6 passages (D) and 10 passages (E), adjusted with the Van Genuchten model.
Regarding the forms of water in the studied soil, the gravitational water (GW) in the soil shows significant differences between the passages to the studied surfaces (Tables 3 and 4). Values of GW, fluctuate between 5.04 and 29.26%, category in which PAGLIAI et al. (2003) claim that these should be referred to as moderately porous soils. It is observed low values of GW for P2 and a different behavior regarding to that observed by PAGLIAI et al. (2003), since the tractor traffic did not cause decreases in such property, but the contrary, the increments between passages have emerged in all traffic treatments overcoming the control. For P1 and PR, it was showed decreases between 26.6 and 78.02% of GW being assessed the greatest reductions in the third, the sixth and the tenth passages of the tractor.
TABLE 3. Gravitational water values (% volume) founded at 10 cm depth.
Surface Control Trator Passages 1 Trator Passages 2
1 3 6 10 1 3 6 10
P1 20.75bB 10.28aA 10.30aA 10.22aA 15.22aAB 12.24abAB 10.61aA 9.19aA 12.47aAB
PR 29.26cC 12.36aAB 7.58aAB 11.99aAB 17.34aB 14.99 bAB 6.43aA 9.10aAB 10.89aAB
P2 5.45aA 10.05aA 8.00aA 6.34aA 10.81aA 8.62 a A 10.36aA 11.18aA 9.13 A
P1: pasture 1; P2: pasture 2; PR: prepared. Values followed by different lowercase letters in rows or capital letters in columns indicate significant differences according to Tukey test (P <0.05).
TABLE 4. Gravitational water values (% volume) founded at 30 cm depth.
Surface Control Trator Passages 1 Trator Passages 2
1 3 6 10 1 3 6 10
P1 19.06bA 14.80aA 12.32bA 13.72bA 18.05bA 19.50bA 11.52bA 11.75ªA 12.00aA
PR 22.37bB 8.04aA 6.86abA 7.25aA 11.34aA 8.50aA 7.00ab A 9.95aA 10.01aA
P2 7.93aA 7.52aA 6.49aA 8.34aA 8.09aA 11.28abA 5.04aA 10.99aA 7.83aA
P1: pasture 1; P2: pasture 2; PR: prepared. Values followed by different lowercase letters in rows or capital letters in columns indicate significant differences according to Tukey test (P <0.05).
Moi st ur e c ont ent , cm
3 cm
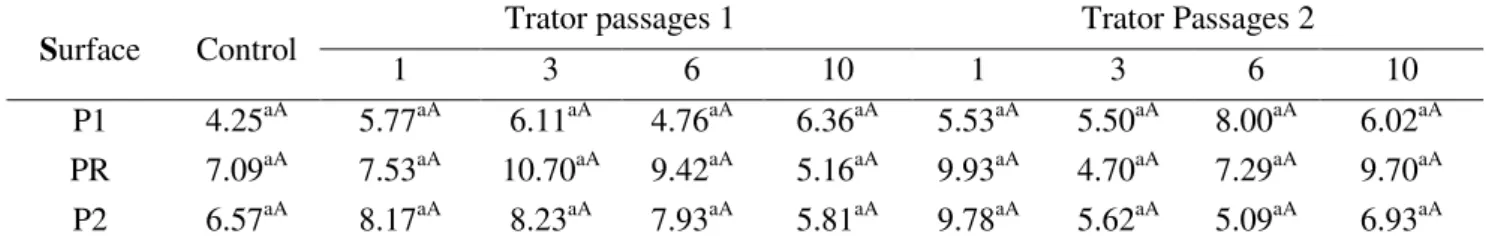
The available water (AW) is at a moisture level between 3.6% and 10.6%, without noticing significant differences between treatments (Tables 5 and 6). Such values obtained are low, considering the ones reported by DORRONSORO (2007), but similar to those reported by CUNHA et al. (2007), for different crop rotation systems, accepting the statement of LI et al. (2009), who claim that this property is responsible for 89% of the total water flow, therefore is important to care for this property at the time of traffic machinery application.
TABLE 5. Available water values (% volume) founded at 10 cm depth.
Surface Control Trator Passages 1 Trator Passages 2
1 3 6 10 1 3 6 10
P1 6.98aA 5.22aA 7.72aA 5.03aA 4.71aA 5.19aA 5.61aA 4.87aA 7.14aA
PR 5.45aA 8.14aA 7.41aA 5.98aA 6.16aA 10.01aA 6.68aA 8.73bA 7.48aA
P2 5.70aA 6.10aA 6.87aA 6.97aA 3.940aA 6.41aA 4.21aA 4.07aA 3.63aA
P1: pasture 1; P2: pasture 2; PR: prepared. Values followed by different lowercase letters in rows or capital letters in columns indicate significant differences according to Tukey test (P <0.05).
The property constant fluctuations, do not allow to establish a clear vision about the traffic interaction, causing reductions of 32, 5% for P1, increases of 83% for PR, without showing reduction in any passage, and finally increases and decreases between -36.8% and 22.2% to P2.
TABLE 6. Available water values (% volume) founded at 30 cm depth.
Surface Control Trator passages 1 Trator Passages 2
1 3 6 10 1 3 6 10
P1 4.25aA 5.77aA 6.11aA 4.76aA 6.36aA 5.53aA 5.50aA 8.00aA 6.02aA
PR 7.09aA 7.53aA 10.70aA 9.42aA 5.16aA 9.93aA 4.70aA 7.29aA 9.70aA
P2 6.57aA 8.17aA 8.23aA 7.93aA 5.81aA 9.78aA 5.62aA 5.09aA 6.93aA
P1: pasture 1; P2: pasture 2; PR: prepared. Values followed by different lowercase letters in rows or capital letters in columns indicate significant differences according to Tukey test (P <0.05).
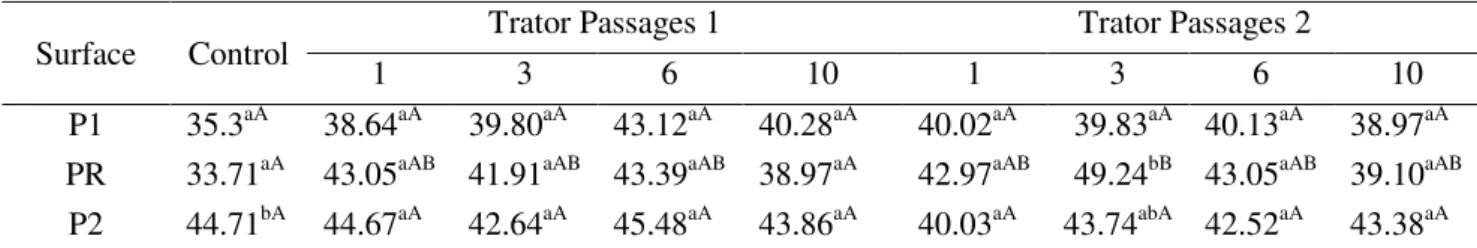
The hygroscopic water (HG) in the first 10 cm depth, can achieve 80.48% of the total water present in the soil, showing the highest rates in P2 and suffering increases only in the first. For the other surfaces, the tractor passage reported increases, with significant differences in the sixth passage, obtaining there the highest values achieved by this property for P1 and the third passage for PR (Table 7).
TABLE 7.Hygroscopic water values (% volume) founded at 10 cm depth.
Surface Control Trator Passages 1 Trator Passages 2
1 3 6 10 1 3 6 10
P1 38.10abA 41.99ab A 37.37aA 45.67bA 38.84aA 43.24aA 40.32aA 46.57aA 40.09aA
PR 27.23abA 39.20abB 42.25aB 36.96aAB 32.70aAB 34.62aAB 40.91aB 35.17aAB 34.85aAB
P2 45.96bAB 46.29bAB 43.63aAB 42.25abAB 40.02aAB 43.54aAB 51.48aB 32.48aA 44.79aAB
P1: pasture 1; P2: pasture 2; PR: prepared. Values followed by different lowercase letters in rows or capital letters in columns indicate significant differences according to Tukey test (P <0.05).
TABLE 8. Hygroscopic water values (% volume) founded at 30 cm depth.
Surface Control Trator Passages 1 Trator Passages 2
1 3 6 10 1 3 6 10
P1 35.3aA 38.64aA 39.80aA 43.12aA 40.28aA 40.02aA 39.83aA 40.13aA 38.97aA
PR 33.71aA 43.05aAB 41.91aAB 43.39aAB 38.97aA 42.97aAB 49.24bB 43.05aAB 39.10aAB
P2 44.71bA 44.67aA 42.64aA 45.48aA 43.86aA 40.03aA 43.74abA 42.52aA 43.38aA
P1: pasture 1; P2: pasture 2; PR: prepared. Values followed by different lowercase letters in rows or capital letters in columns indicate significant differences according to Tukey test (P <0.05).
Considering the two depths, the values found are above those cited by VEIGA et al. (2008), authors that show fluctuations between 26% and 33% of hygroscopic water content. It is worth noting that the percentage that the HG contribution to the total water present in the soil has high values (43.95 to 80.85%), considering that this water is not available to the crops.
CONCLUSIONS
The retention curve presented a typical behavior of compacted soils, with high percentages of unavailable water for the crops, noticing an increase at an overall level in the field capacity values and permanent wilting point as the tractor traffic increases. Furthermore it was observed that the permanent wilting point is transferred to lower pressures as it increases the compaction.
REFERENCES
ALAOUI, A.; LIPIEC, J.; GERKE, H.H. A review of the changes in the soil pore system due to soil deformation: A hydrodynamic perspective. Soil and Tillage Research, Amsterdam, v.115-116, p.1-15, 2011.
BOTTA, G.; TOLON BECERRA, A.; BELLORA, F. Effect of the number of tractor passes on soil rut depth and compaction in two tillage regimes. Soil and Tillage Research, Amsterdam, v.103, p.381-386, 2009.
BOTTA, G.F.; VÁZQUEZ, J.M.; TOLON BECERRA, A.; BALBUENA, R.; STADLER, S. Soil compaction distribution under land clearing in calden (Prosopis Caldenia Burkart) forest in Argentinean pampas. Soil and Tillage Research, Amsterdam, v.119, p.70-75, 2012.
CAMACHO-TAMAYO, J.H.; RODRÍGUEZ B., G.A. Evaluación de implementos de labranza a diferentes velocidades de operación y contenidos de agua del suelo. Agricultura Técnica, Chillán, v.67, n.1, p.60-67, 2007.
CUNHA, E.Q.; BALBINO, L.C.; STONE, L.F.; LEANDRO, W.M.; OLIVEIRA, G.C. Influência de rotações de culturas nas propriedades físico-hídricas de um Latossolo Vermelho em plantio direto. Engenharia Agrícola, Jaboticabal, v.27, n.3, p.665-674, 2007.
DIJCK S.; ASCH W. Compaction of loamy soils due to tractor traffic in vineyards and orchards and its effect on infiltration in southern France. Soil and Tillage Research, Amsterdam, v.63, n.3-4, p.141-153, 2002.
DORRONSORO, C. Introducción a la edafología. España: Universidad de Granada, 2007. 100 p. FLORES, L.; ALCALÁ, J. Manual de procedimientos analíticos. Laboratorio de Física de Suelos. México: Universidad Nacional Autónoma de México, Instituto de Geología, Departamento de Edafología, 2010. 56 p.
GERSTER. G.R.; BACIGALUPPO, S.; De BATTISTA J.C.; CERANA, J. Distribución de la compactación en el perfil del suelo utilizando diferentes neumáticos. Consecuencias sobre el enraizamiento del cultivo de soja. Argentina.Manfredi: EEA INTA, 2008. p. 68-72. (Serie Para Mejorar la Producción).
GHANBARIAN-ALAVIJEH, B.; LIAGHAT, A.; HUANG, G.; VAN GENUCHTEN, M.T. Estimation of the Van Genuchten soil water retention properties from soil textural data. Pedosphere, Beijing, v.20, n.4, p.456-465, 2010.
IGAC. Estudio general y detallado de suelos de los municipios de Cota, Funza, Mosquera y parte de Madrid. Bogotá: Instituto Geográfico Agustín Codazzi, 1977. 513 p.
INNS, F.M.; KILGOUR, J. Agricultural tires. London: Dunlop, 1978. 69p.
JORAJURIA, D.; DRAGHI, L. Sobrecompactación del suelo agrícola parte I: influencia diferencial del peso y del número de pasadas. Revista Brasileira de Engenharia Agrícola e Ambiental,
Campina Grande, v.4, n.3, p.445-452, 2000.
KAMIMURA, K.M.; LEVIEN, L.; TREIN, C.R.; DEBIASI, H.; CONTE, O. Parâmetros solo-máquina em função de doses de resíduos vegetais e profundidades de deposição de adubo em semeadura direta. Engenharia Agrícola, Jaboticabal, v.29, n.3, p. 431-439, 2009.
LI, Y.X.; TULLBERG, J.N.; FREEBAIRN, D.M.; LI, H.W. Functional relationships between soil water infiltration and wheeling and rainfall energy. Soil and Tillage Research, Amsterdam, v.104, n.1, p.156-163, 2009.
LIPIEC, J.; WOJCIGA, A.; HORN, R. Hydraulic properties of soil aggregates as influenced by compaction. Soil and Tillage Research, Amsterdam, v.103, n.1, p.170–177, 2009.
MADDEN, N.M.; SOUTHARD, R.J.; MITCHELL, J.P. Soil water and particle size distribution influence laboratory-generated PM10. Atmospheric Environment, Norwich, 44, n.6, p.745-752, 2010.
MEZA, E.; GEISSERT, D. Estructura, agregación y porosidad en suelos forestales y cultivados de origen volcánico del Cofre de Perote, Veracruz, México. Foresta Veracruzana, Xalapa, v.5, n.2, p.57-60, 2003.
PAGLIAI, M.; MARSILI, A.; SERVADIO, P.; VIGNOZZI, N.; PELLEGRINI, S. Changes in some physical properties of a clay soil in Central Italy following the passage of rubber tracked and
wheeled tractors of medium power. Soil and Tillage Research, Amsterdam, v.73, n.1, p.119-129, 2003.
PIRES, L.F.; BACCHI, O.O.S.; REICHARDT, K. Soil water retention curve determined by gamma-ray beam attenuation. Soil and Tillage Research, Amsterdam, v.82, n.1, p.89-97, 2005. SERAFIM, M.E.; VITORINO. A.C.T.; PEIXOTO, P.P.P.; SOUZA, C.M.A; CARVALHO. D.F. Intervalo hídrico ótimo em um latossolo vermelho distroférrico sob diferentes sistemas de produção. Engenharia Agrícola, Jaboticabal, v.28, n.4, p. 654-665, 2008.
SEVERIANO, S.E.; OLIVEIRA, G.C.; DIAS JÚNIOR, M.S.; COSTA, K.A.P.; BENITES, V.M.; FERREIRA FILHO, S.M. Structural changes in latosols of the Cerrado region: II – soil
compressive behavior and modeling of additional compaction. Revista Brasileira de Ciência do Solo, Viçosa-MG, v.35, n.3, p.783-791, 2011.
TOLON BECERRA, A.; BOTTA, G.F.; LASTRA BRAVO, X.; TOURN, M.; BELLORA MELCON, F.; VÁZQUEZ, J.; RIVERO, D.; LINARES, P.; NARDON, G. Soil compaction distribution under tractor traffic in almond (Prunus amigdalus L.) orchard in Almería España. Soil and Tillage Research, Amsterdam, v.107, n.1, p.49-56. 2010.