features of spontaneous
expressive speech
Carlos Toshinori Ishi Nick Campbell JST/CREST ESP P
JST/CREST ESP P JST/CREST ESP P JST/CREST ESP P
JST/CREST ESP Project at Aroject at Aroject at Aroject at Aroject at ATR/HIS LTR/HIS LTR/HIS LTR/HIS Labs. - JapanTR/HIS Labs. - Japanabs. - Japanabs. - Japanabs. - Japan
Resumo
A análise de características acústico-prosódicas foi conduzida em um banco de dados de fala espontânea, com o propósito de construir um sintetizador de fala capaz de sintetizar uma fala expressiva, ou seja, vários estilos de fala. Os estilos de fala foram categorizados de acordo com os seguintes itens: estado emocional percebido (neutro, preocupado, contente, insatisfeito, bravo, cansado, etc.); atitude com respeito ao ouvinte (grau de polidez, gentileza, consideração); atitude com respeito ao conteúdo da fala (grau de confiança, envolvimento, interesse); qualidade da voz (energia, brilho, dureza). As seguintes características acústicas foram analisadas: F0
e RMS (relacionados à altura e à intensidade da voz), terceiro e quarto formantes (F3 e F4, relacionados com o comprimento do trato vocal, e podem estar correlacionados com o grau de extensão dos lábios), e quociente de amplitude (AQ – “amplitude quocient”, relacionado com o tipo de fonação da voz). Análise de componentes principais e coeficientes de correlação foram usados para avaliar os dados. Os resultados indicaram correlação entre algumas categorias do estilo da fala e da qualidade de voz, por exemplo, energia e envolvimento, brilho e interesse, gentileza e dureza. Correlações significativas foram obtidas entre qualidade de voz e características acústico-prosódicas. Valores médios de F0, RMS, AQ e F4 foram encontrados como sendo os parâmetros mais influentes na qualidade de voz, indicando que uma combinação destas características acústicas pode, possivelmente, ser usada para predizer qualidades de voz.
F
1. INTRODUCTION 1. INTRODUCTION 1. INTRODUCTION 1. INTRODUCTION 1. INTRODUCTIONor unrestricted text-to-speech conversion, the problems of text anomaly resolution and focus determination are profound. They can require a level of world-knowledge and discourse modeling that is still beyond the capability of most text-to-speech synthesis systems. One implication of this is that the prosody component of the speech synthesizer can only be provided with a default specification of the intentions of the speaker or the underlying discourse-related meanings of the utterance, resulting in a flat rendering of the text into speech. This is not a problem for the majority of synthesis applications, such as news-reading or information announcement services, but if the synthesizer is to be used in place of a human voice for interactive spoken dialogue, then the speech will be perceived as lacking illocutionary force, or worse, it will give the listener a false impression of the intention of the utterance, leading to potential misunderstandings.
When a synthesizer is to be used in place of a human voice in conversational situations, such as in a communication aid for the vocally impaired, or in call-centre operations, then there is a clear need for the vocal expression of more than just the semantic and syntactic linguistic content of the utterance.
Since the information carried by human speech includes linguistic, paralinguistic, and extra-linguistic details, the listener presumably parses all three sources to gain access to the intended meaning of each utterance. Paralinguistic information, signaled by tone-of-voice, and speaking style, becomes more important as the conversation becomes more personal. When speaking with friends, for example, we normally use a different speaking style and tone-of-voice than when addressing a stranger or a wider audience.
Speech synthesis must likewise become capable of expressing such differences.
The aim of this work is to investigate how speakers control prosodic features (like intonation, rhythm and voice quality), which are embedded in speech utterances, to express several levels of emotions, intentions and attitudes, and apply this knowledge for speech synthesis applications. For this purpose, it is necessary to investigate the relationship between the human impressions and the acoustic-prosodic features extracted from the speech signal.
2. SPEECH D 2. SPEECH D 2. SPEECH D 2. SPEECH D
2. SPEECH DAAAAATTTTTA AND SPEECH UNIT FOR ANALA AND SPEECH UNIT FOR ANALA AND SPEECH UNIT FOR ANALA AND SPEECH UNIT FOR ANALA AND SPEECH UNIT FOR ANALYSISYSISYSISYSISYSIS
There has been considerable attention paid recently to the construction and evaluation of language resources [1], because without well-constructed text and speech databases it will be difficult to make technological advances in the areas of speech and language processing. However, current speech databases are limited in their ability to illustrate supra-linguistic speech variation because of the constraints on corpus design.
There are several works concerning emotional speech using controlled “emotional” speech utterances for analysis, but there are doubts about the naturalness of the speech. More recently, the speech content has become less controlled. The latest corpus initiative in Japan [2] is focusing on prepared spontaneous speech produced in a monologue context, especially including conference and workshop presentations.
In the present work, we used part of the speech database recorded in the JST (Japan Science & Technology Agency) CREST (Core Research for Evolutional Science and Technology) ESP (Expressive Speech Processing) Project [3,4], as speech data for analysis. As for the speech data recording, volunteers recorded their daily spoken interactions to minidisc devices by wearing head-mounted close-talking microphones. These samples were then transcribed manually and segmentally aligned automatically from the transcriptions, using HMM-based techniques.
In the current paper, we used part of the speech database, containing everyday conversations of one Japanese adult female speaker. This speech data contains very natural conversations with family and friends, phone calls to company, hotel, and hospital.
As speech units for analysis, we decided to use prosodic phrases [5], because changes in speaking styles are common from phrase to phrase within the same sentence. Even though intra-phrase changes in speaking styles can also occur, it is less common than inter-phrase changes. Prosodic phrase boundaries were placed semi-automatically at long pauses and pitch resets.
3. 3. 3. 3.
3. CACACACATEGORIZACATEGORIZATEGORIZATEGORIZATEGORIZATION AND LABELING OF SPEAKING STYLES ANDTION AND LABELING OF SPEAKING STYLES ANDTION AND LABELING OF SPEAKING STYLES ANDTION AND LABELING OF SPEAKING STYLES ANDTION AND LABELING OF SPEAKING STYLES AND V
VV V
VOICE QUOICE QUOICE QUOICE QUOICE QUALITYALITYALITYALITYALITY
The speaking styles were categorized in terms of the following items:
• Perceived mood or emotional state:
Neutral, worried, content, happy, discontent, angry, sad, tired, depressed, etc.: subjects were freely allowed to choose or propose a proper adjective that better represents the emotional state perceived from the speech utterance;
• Speaker’s attitude with respect to the listener:
Degree of politeness: sloppy, slightly sloppy, casual, slightly polite, polite, formal.
Degree of warmth, and degree of considerateness: scale from – 2 to +2;
Degree of softness: scale from 0 to +2;
• Speaker’s attitude with respect to the contents:
Degree of confidence, involvement, and interest: scale from –2 to +2;
Here, -2/+2 indicates “noticeable”, -1/+1 indicates “slightly noticeable” and “0” indicates “non-noticeable”.
As for voice quality, the following categories were labeled: • Energy (global intensity of the speech): 5 step scale from weak
voice to strong voice.
• Brightness (closely related to mood): 5 step scale from dark voice (bad mood) to bright voice (good mood).
• Tension (related to the vocal effort): 5 step scale from soft voice to tense voice.
The speaker’s intentions were also labeled, but their categories are omitted in the present paper, pending detailed acoustic-prosodic analyses.
Three native speakers of Japanese labeled the above categories for 670 phrases. Subjects were asked to label the perceived features of the speech regardless of the actual emotion of the speaker.
4. 4. 4. 4.
4. ACOUSTICACOUSTICACOUSTICACOUSTICACOUSTIC-PROSODIC FEA-PROSODIC FEA-PROSODIC FEA-PROSODIC FEATURES-PROSODIC FEATURESTURESTURESTURES
Japanese is a pitch accent language, so that the F0 movements of an utterance are largely influenced by the accent types of the words that comprise the utterance. For this reason, in the current paper, we focused our analysis on overall acoustic-prosodic features of the speech.
The following acoustic features were analyzed: F0, RMS, third and fourth formants (F3 and F4), and glottal amplitude quotient (AQ): • Average of F0 values (f0avg), related to the overall pitch height of the utterance, and F0 range, related to the overall pitch movement along the utterance; although F0 range is usually calculated as the difference between the maximum and minimum value, we decided to use the difference between the maximum and the mean value (f0dif), since the estimation of the minimum value is not so robust.
• Average of power values (rmsavg), related to the overall intensity of the utterance, and power range (rmsdif) as in the homologous F0 parameter definition. Power values were calculated taking the logarithm of the RMS (root mean square) values of the speech.
• Average of F3 and F4 (f3avg, f4avg). These higher formants are more directly related to the vocal tract length than are the first two formants, and could also be associated with lip spreading which is frequent in bright voices. The formants were extracted using the algorithm of cepstrum-to-formant mapping proposed in [7]. F1 and F2 were not used in the analysis because they are more closely related with phone identity than with prosodic information. • Average of AQ values (aqavg), related to the breathiness of the
voice. The AQ parameter is defined as the ratio of the peak-to-peak value of the glottal waveform (after eliminating the formant effects) and the maximum negative peak of the derivative of the glottal waveform; it has been shown to be related to perceived phonation quality along the pressed/breathy continuum [6], and may also be related to the perception of softness (tension) of the speech. In this study, the negative of AQ is used in order to obtain higher values for pressed phonation (or tense voice) and lower values for breathy phonation (or soft voice).
The values of the parameters in only the vowel portions were used in the computation of parameters defined above.
5. 5. 5. 5.
5. ANALANALANALANALYSIS RESULANALYSIS RESULYSIS RESULYSIS RESULTSYSIS RESULTSTSTSTS
Principal component analysis techniques and correlation coefficients were used to evaluate the data.
5.1. Analysis results for items related to speaking style 5.1. Analysis results for items related to speaking style 5.1. Analysis results for items related to speaking style 5.1. Analysis results for items related to speaking style 5.1. Analysis results for items related to speaking style
Figure 1 shows the distributions of the labeled emotional states. Neutral utterances were found to be predominant because most of the data are phone call conversations. Further, although there is a brightness category for voice quality, labelers prefered to classify “Neutral” emotional states in “Neutral(dark)” and “Neutral(bright)”.
Figure 1. Distribution (number of ocurrences) of the emotional states
Fig. 2 shows the distribution of the emotional states according to the politeness. From these distributions, it can be observed that {sloppy, casual} tend to be associated with {N(dark), depressed, discontent, displeased, bitter smile}, and that {casual, slightly polite} tend to be associated with {worried, anxious}. Furthermore, only {neutral, neutral(bright)} appear to be associated with the categories {polite, formal}.
Figure 2 – Distribution (number of occurrances) of the emotional states according to politeness
N N ( d a r k ) N ( b r i g h t ? d i s a p p o i n t e d a m u s e d d u b i o u s h a p p y s y m p a t h i z e w i t h b e s o r r y f o r ( t h a n k f o r ) b i t t e r s m i l e l o o k d o w n t h i n k i n g w o r r i e d d e p r e s s e d a n x i o u s d i s p l e a s e d d i s c o n t e n t 1 10 100 1000 0 20 40 60 80 sloppy slightly sloppy casual slightly polite polite formal N N(dark)
N(bright? bitter smile thinking worried, anxious depressed, discontent, displeased
Also, a strong relation was observed between the degree of politeness and the relationship between the speaker and the listener. For example, {casual, non-polite} manners were predominantly used for relatives and friends, while {polite, formal} manners were predominantly used for company, hospital and acquaintances.
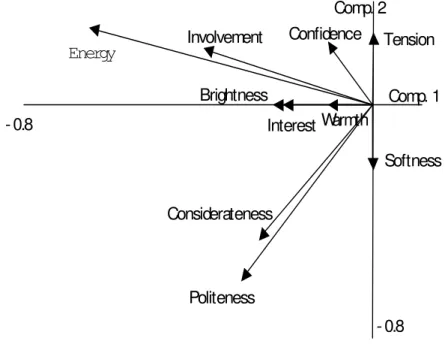
Next, principal component analysis was conducted on the quantifiable categories related to speaking style. Fig. 3 shows the results in terms of the first two principal components. Table 1 shows the correlation coefficients between the categories.
Figure 3 – Results of Principal Component Analysis on categories related to speaking styles
Politeness Considerateness Tension Softness Energy Involvement Confidence Brightness Warmth Interest - 0.8 - 0.8 Comp. 1 Comp. 2
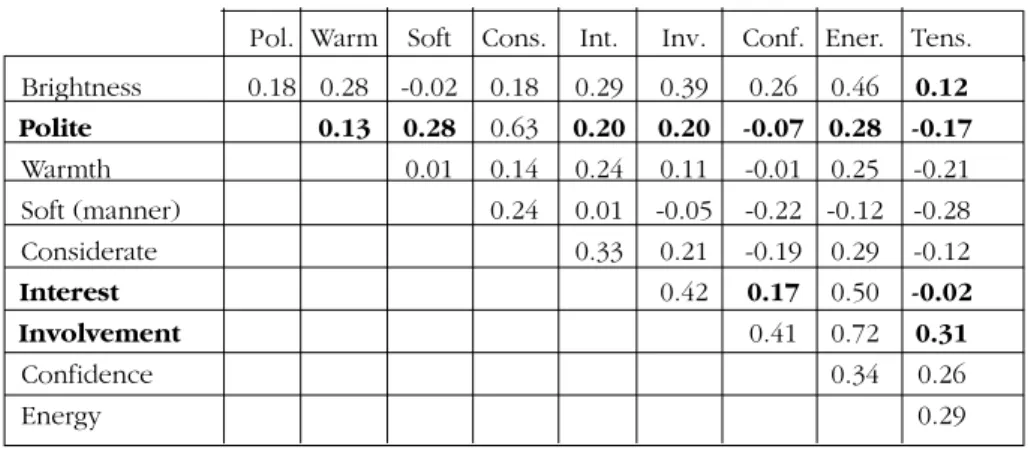
Pol. Warm Soft Cons. Int. Inv. Conf. Ener. Tens. Brightness 0.18 0.28 -0.02 0.18 0.29 0.39 0.26 0.46 0.12 Polite 0.13 0.28 0.63 0.20 0.20 -0.07 0.28 -0.17 Warmth 0.01 0.14 0.24 0.11 -0.01 0.25 -0.21 Soft (manner) 0.24 0.01 -0.05 -0.22 -0.12 -0.28 Considerate 0.33 0.21 -0.19 0.29 -0.12 Interest 0.42 0.17 0.50 -0.02 Involvement 0.41 0.72 0.31 Confidence 0.34 0.26 Energy 0.29
Table 1 – Correlation coefficient between the categories related to speaking style
The relationship between the categories related to speaking styles can be viewed in Fig. 3 and Table 1. Strong correlations were found mainly between “Energy” and “Involvement”, and between “Politeness” and “Considerateness”. Further, Figure 3 indicates a negative correlation between “Softness (manner)” and “Tension”; and a positive (but weak) correlation between “Brightness” and “Interest”. The small correlation coefficients found among most of the other categories indicate that they are relatively independent and can therefore be regarded as significantly separate perceptual labels.
5.2. Analysis of the acoustic-prosodic features 5.2. Analysis of the acoustic-prosodic features5.2. Analysis of the acoustic-prosodic features 5.2. Analysis of the acoustic-prosodic features5.2. Analysis of the acoustic-prosodic features
f0dif rmsavg rmsdif f3avg f4avg aqavg f0avg 0.03 0.56 0.11 0.06 0.14 0.51 f0dif 0.26 0.32 -0.23 0.01 0.13 rmsavg 0.17 -0.24 0.06 0.51 rmsdif -0.26 0.03 0.14 f3avg 0.12 -0.23 f4avg 0.04
The results in Table 2 show correlations between f0avg and rmsavg, indicating that a high-pitched voice is usually uttered strongly. High correlations were also obtained between aqavg and both rmsavg and f0avg, indicating possibly that tense voice appears in high-pitched and high-energy voices. Further, the small correlation for the other features indicates that each feature carries different information.
5.3. 5.3. 5.3. 5.3.
5.3. Relation between the acoustic-prosodic features and theRelation between the acoustic-prosodic features and theRelation between the acoustic-prosodic features and theRelation between the acoustic-prosodic features and theRelation between the acoustic-prosodic features and the categories related to speaking styles
categories related to speaking stylescategories related to speaking styles categories related to speaking styles categories related to speaking styles
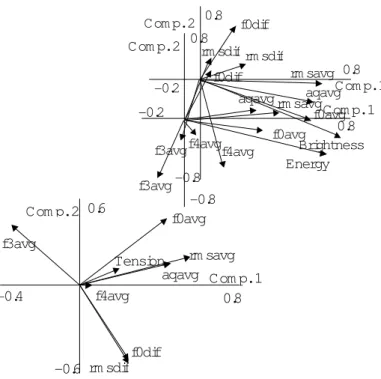
Fig. 4 shows the relationship among the acoustic-prosodic features and the voice quality categories in terms of the first and second principal components.
f0avg rm savg aqavg f0dif rm sdif f3avg f4avg Tension 0.8 0.6 -0.6 -0.4 Com p. 1 Com p. 2 f0avg rm savg aqavg f0dif rm sdif f3avg f4avg Energy 0.8 0.8 -0.8 -0.2 Com p. 1 Com p. 2 f0avg rm savg aqavg f0dif rm sdif
f3avg f4avg Brightness 0.8 0.8
-0.8
-0.2 Com p. 1 Com p. 2
Figure 4 – PCA results for voice quality (“Energy”, “Brightness” and “Tension”) and acoustic-prosodic features
According to Fig. 4, “Energy” is correlated more with f0avg than with rmsavg. Similar tendencies can be seen for “Brightness”. However, a stronger component of f4avg was found for “Brightness” than for “Energy”. This result can be related to the tendency of good-mood speech to be uttered with spread lips, effectively shortening the vocal tract and thereby increasing F4. This correlation was not observed for f3avg, indicating possibly that F3 is more affected by the vowel identity. As for the “Tension”, no strong correlation was found, but small correlations were found for rmsavg and aqavg. Although AQ parameters are related to pressed or breathy phonation, other features may influence in the perception of “Tension”.
6. 6. 6. 6.
6. CONCLCONCLCONCLCONCLCONCLUSIONUSIONUSIONUSIONUSION
In the present paper, spontaneous expressive speech data were categorized according to the listener’s impressions for speaking styles and voice quality, and their relation with acoustic-prosodic features were analyzed.
Results showed correlations between some categories of speaking manners and voice quality, e.g., energy and involvement, brightness and interest, politeness and considerateness. Also, significant correlations were obtained between voice quality and acoustic-prosodic features. Averages of F0, RMS, AQ and F4 were found to be the most influential parameters on voice quality, indicating that a combination of these acoustic features can possibly be used to predict voice qualities. As a next step, we are investigating the dynamics of the acoustic-prosodic parameters.
ACKNOWLEDGEMENTS ACKNOWLEDGEMENTS ACKNOWLEDGEMENTS ACKNOWLEDGEMENTS ACKNOWLEDGEMENTS
We thank the JST institution for supporting this project. Also, we give special thanks for Dr. Parham Mokhtari for providing the AQ and formant parameters of all database.
REFERENCES REFERENCES REFERENCES REFERENCES REFERENCES
[1] European Language Resources Association: www.elda.fr/catalog.html. [2] MAEKAWA, K.; KOISO, H.; FURUI, S.; ISAHARA, H. Spontaneous speech
corpus of Japanese. Proc. of LREC2000, p. 947-952, 2000.
[3] The JST/CREST Expressive Speech Processing Project, introductory web pages at: HYPERLINK “http://www.isd.atr.co.jp/esp”, www.isd.atr.co.jp/esp. [4] CAMPBELL, N. The recording of emotional speech; JST/CREST database
research. Proc. of LREC2002, v. 6, p. 2029-2032, 2002.
[5] HIROSE, K.; FUJISAKI, H.; KAWAI, H. Generation of prosodic rule-synthesis of connected speech of Japanese. Proc. of IEEE-ICASSP86, p. 2415-2418, 1986.
[6] MOKHTARI, P.; CAMPBELL, N. Perceptual validation of a voice quality parameter AQ automatically measured in acoustic islands of reliability. Proc. of Acoustical Society of Japan Spring 2002’, v. I, p. 401-402, 2002. [7] BROAD, D. J.; CLERMONT, F. Formant estimation by linear transformation
of the LPC cepstrum. Journal of the Acoustical Society of America, 86, v. 5, p. 2013-2017, 1989.