Vol. 100: 103-109.1993 MARINE ECOLOGY PROGRESS SERIES
Mar. Ecol. Prog. Ser.
l
Published October SEstimating macrobenthic secondary production
from body weight and biomass: a field test in a
non-boreal intertidal habitat
Martin
Sprung
UCTRA, Universidade do Algarve, Campus de Gambelas, Apartado 322, P-8004 Faro Codex, Portugal
ABSTRACT: Production (P) and biomass (B) data of different species from 3 stations in the intertidal zone of the Ria Formosa (southern Portugal, 37" N) were analysed. They were compared with equations from the literature to estimate
P/B
ratios from body weight. A clear distinction must be made between (1) an intraspecific and (2) an interspecific comparison. (1) Results from 3 species supported a body weight exponent of -0.25 for the P/B ratio, as is to be expected from a linear relationship between growth and respiration. (2) In a n interspecific comparison, the weight exponent depends on the contri- bution of age or growth rate to the presence of large specimens in a sample. It is concluded that pro- duction in the specific habitat examined cannot be calculated properly from body weight and biomass by 1 simple equation which mixes interspecific and intraspecific effects, rather that both aspects should be separated into 2 different calculation steps.INTRODUCTION
Since the first attempts to estimate secondary pro- duction by Boysen Jensen (1919), techniques have improved continuously (Winberg 1971, Waters 1977, Crisp 1984). At present, the most common methods are the increment summation method, the removal sum- mation method, the instantaneous growth method and a production estimate by the Allen curve. All these methods are based on analysis of body weight and abundance of cohorts sampled a t regular time inter- vals. Abundance and weight data are subsequently handled according to more or less rigid assumptions concerning their deployment over time. Gillespie & Benke (1979) demonstrated that all 4 methods basi- cally lead to the same result.
In many ecological studies, secondary production is required not only of single abundant species, but also of whole communities. In these samples there will always be a certain number of individuals which either cannot be associated to a cohort, or which belong to species which are only represented by a few animals. In addition to this, collecting and analysing field data
by the methods described above is extremely labour intensive. In this context, a n estimate of production by body size is of great interest either to fill in the missing values or to obtain a preliminary estimate of benthic production processes, when detailed data are missing. Banse & Mosher (1980) related the quotient of annual production to mean annual biomass ( P I E ; units: kcal, m', yr) to the body weight of animals at their first sexual maturity (M,, kcal m-') and found the following relation:
M, may be a good denominator for body size in a comparison of species-specific attributes. The applica- tion of this equation to field studies, however, encoun- ters difficulties, because M g will not be easily obtained for rare species whose life history is poorly known. That is why for field use the empirical equation pro- vided by Schwinghamer et al. (1986) for macrobenthos is more appropriate, relating the
PIE
ratio and mean annual body weight E:An even extended analysis of 337 data sets of pro-
duction, mean annual biomass and mean individual
weight figures has been published by Brey (1990).
Both equations imply that the
PIE
ratio depends on body size in a characteristic way. This is due to 2 effects: (1) an intraspecific or physiological effect - the P/B ratio represents a time-integrated estimate of the weight-specific growth rate (modified by mortality effects). The growth rate should depend on body size in a similar way as other physiological rates (e.g. the metabolic rate by a weight exponent of -0.25). (2) an interspecific or ecological effect, due to the fact that ata given body size and in identical environmental con- ditions some species of a community grow faster than others. This effect can only be monitored empirically because there is no fixed relationship between growth and mortality. In other words, specimens can be large, because they grow fast and/or because they are partic- ularly old. For example, for a simplified hypothetical
community of species with different growth rates but the same life expectation, the P/B ratio should increase linearly with mean annual body weight.
Eqs. (1) & (2) are based mainly on data from boreal latitudes with a typical annual temperature and nu- trition pattern characterized by adverse conditions during winter and favourable conditions during spring/summer. During a study in the intertidal zone of the Ria Formosa (southern Portugal, 37" N), annual macrobenthic secondary production of different sys- tematic groups and feeding types was estimated (Sprung in press, Sprung 8 Cardoso in press). Temper- ature conditions are favourable all year round. Water temperature shows a winter minimum of about 12 "C and a summer maximum of 28°C. Most of the fauna profits from detritus (probably of macrophytes and macroalgae) which is potentially present all year round. Are the empirical equations by Banse & Mosher (1980) and Schwinghamer et al. (1986) also valid under these conditions?
MATERIAL AND METHODS
The analysis refers to the same data as in Sprung (in
press) and Sprung & Cardoso (in press) from 3 stations
in the intertidal zone (mud flat, sand flat, seagrass Zostera noltii bed) sampled every second month dur- ing 1990-91, i.e. 7 times during the course of the year, duplicating the first and the last month.
No statistics were necessary to separate cohorts,
either because they were obvious or - in the case of
Scrobiculana plana - because shell characteristics (shell colour or growth rings) gave better information. Sec- ondary production ( P ) was estimated by the increment summation method in most cases with the original data:
01 l
0 M) m 1W 2 0 0
Mean annual body weight
E
[mg] P/Bratio
Fig. 1. Intraspeciflc comparison of ratios of annual production to mean annual b~omass with animals of different body weight exemplified for 3 species; regressions are presented in
Table 1 4
where = production between 2 sampling dates; n,, n, = abundances at 2 sampling dates; and W , , E, = ash free dry body weight (AFDW) at sampling dates.
In cases where numbers of adult individuals did increase or intermittently no individuals of this cohort were recorded at a sampling date, figures with neigh- bouring sampling dates were averaged.
For Carcinus maenas an instantaneous growth rate has been calculated for individuals of 2 year classes present in the intertidal zone:
o Mesalia bmvialis
- O + Scrobicularia plana
*
Cyclope neriteaL:
1st year class: W = 0.264 e0.0207d, n = 91, r = 0.55 2nd year class: W = 73.27 e0.0'33d, n = 8, r = 0.62 where W = body weight (mg AFDW); d = day of the year; n = number of data points; and r = correlation coefficient.
In some cases some individuals could not be associ- ated with cohorts. This missing production was supple- mented as follows: a PIB ratio was calculated from the identified cohorts. This was regarded as an estimate of a typical P/B of the species (P/B,,,,) at mean body weight W . From this PIB,,,,, the P/B at the specific indl- vidual body weight W,,,, (the p/Bmd ) was extrapolated using a weight exponent of -0.25:
The justification of this procedure is given later in the text. For analysis, only data from those species whose supplemented proportion did not exceed 50% of the production estimate were considered.
Mean annual body weight W was calculated from the AFDW (loss of weight after 3 h at 450°C) of whole animals (including shells of the molluscs) at the 7 sam- pling dates. As the first and the last sampling referred
Sprung: Estimating macrobenthic secondary production 105
to the same season, their average was treated Table 1 Regressions relating PIE ratios to mean annual body weight as 1 estimate, The body weight M , was ( F ; mg) as obtained from cohorts of different age (see text) Data are approximated by the average weight of the presented in Fig. 1 and are fitted by a power curve- PIE = a ~ ' : constants a and b are indicated together with their standard deviations (+ SD); animals of a cohort at the moment when the r. correlat~on coefficient; n : number of data pairs
first specimens of the follo~ving cohort appeared in the sample.
For the data presented in Fig. 1 and Table 1 (intraspecific comparison), production and biomass were related to the age of the indi- viduals. The P/B ratios were calculated from
Species a b r n
Mesalia brevialis 6.95 r 0.15 -0.309 f 0.043 -0.87 18 Cyclope neritea 5.07
+
0.41 -0.307 f 0.152 -0.71 6 Scrobicular~a plana 3.84 f 0.19 -0.159+
0.047 -0.71 13 production and biomass values of the cohortduring 1 yr, as outlined above. The time
span was moved stepwise to advanced ages in 2 mo PIE ratios were obtained (Bittium reticulatum, Nereis intervals. With Scrobicularia plana this met the dif- diversicolor, Cyathura carinata).
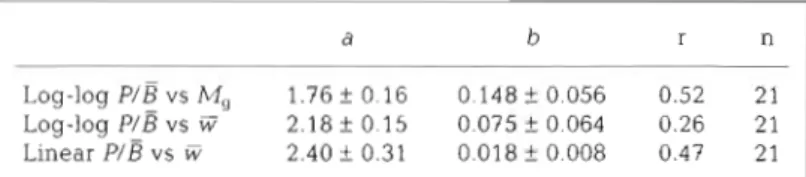
ficulty that the first year class was poorly represented The P / B ratios were fitted by a power curve to M, when compared to the following ones. Abundance (analogous to Banse & Mosher 1980), to E (analogous to figures of this cohort had to be corrected by average Schwinghamer et al. 1986) or by linear regression to W mortality rates and abundance figures of the ad- (Table 3). The latter would be the most straightforward
vanced cohorts. interpretation without transforming the data. However,
All statistical tests are based on methods described frequency distribution of the P/B ratios a n d of body
in Sachs (1978). weight data show a tailing at high values, which is why
the logarithmic presentation of both the dependent and the independent variables is more appropriate for sta- RESULTS tistical analysis. With M, as independent variable, a t- test implied that the weight exponent was significantly Data from this study revealed different relation- different from zero (and consequently also from -0.37, ships between the P/P/B ratio and body weight in indicated by Banse & Mosher 1980). Also the correlation (1) a n intraspecific comparison and (2) an interspe- coefficient was significantly positive (a < 0.05). With W
cific comparison. as independent variable, this was not true for the weight
exponent a n d correlation coefficient. However, even in this case, the exponent was significantly different from Intraspecific comparison -0.304 indicated by Schwinghamer e t al. (1986) and also from -0.25, as to be expected from the intraspecific com- The fauna of the intertidal zone was dominated by parison ( a < 0.0001).
species with a typical life expectation of about 1 yr (only a few individuals may live longer). Carcinus mae-
nas preferably migrates to the subtidal area after its DISCUSSION first year. In only 3 species of this sample set was the
life span regularly longer: the gastropods Mesalia bre- A comparison between the P/B ratio of species stud- vialis and Cyclope neritea and the bivalve Scrobicu- ied in the Ria Formosa and estimates from the litera- lana plana. On the whole, the exponents which relate ture indicates a high degree of variation (Table 4 ) . This the body weight of animals of different size of the same is d u e to the following facts:
species to the P/B quotient did support a value of -0.25 (1) The P/B ratio depends on the a g e structure of a (Table 1) as was expected for theoretical reasons out- population. This is a consequence of a decline of the lined in the 'Discussion'. weight-specific growth rate with age ( e . g . according to
the von Bertalanffy equation; von Bertalanffy 1938). Growth and metabolic rate are closely related. Interspecific comparison Engelmann (1966) postulated a linear relationship, which is hence called the 'Engelmann line'. In subse- The calculated
PIE
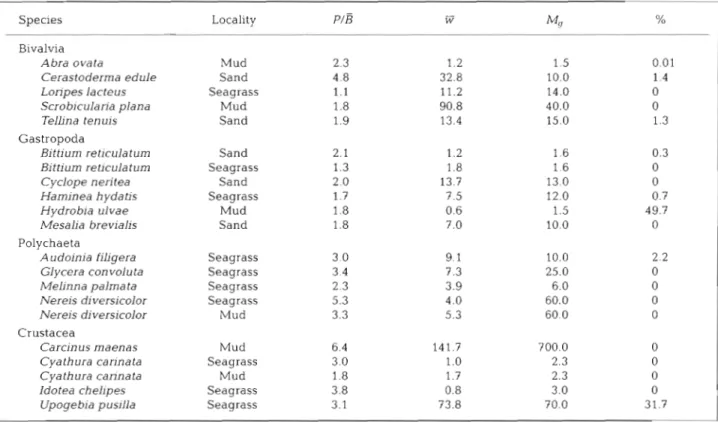
ratios, mean annual body quent years this relationship was confirmed in many weights ( W ) and body weights at first sexual maturity studies which are reviewed a n d compiled by (M,) are compiled in Table 2. The data are displayed Humphreys (1979). In a monograph, Hemmingsen graphically in Fig. 2. P/B ratios showed a high degree (1960) concluded on a n ample basis of data that the of variation between the species. Note also that for the weight exponent of the weight-specific metabolic rate same species at different sample sites quite different is generally -0.25 for a given species, corresponding toTable 2. Quotients of annual production to mean annual biomass ( P I E ) , mean annual body weight ( W ) and body weight at first sex- ual maturity (M,) (both mg ash free dry weight) from species examined at 3 different localities in the Ria Formosa - a sand flat, a mud flat, and a seagrass bed; % = percentage of the production supplemented by the method outlined under 'Material and methods'
P/B
-Species Locality W
4
%Bivalvia
Abra ovata Mud 2.3 1.2 1.5 0.01
Cerastoderma edule Sand 4.8 32.8 10.0 1.4
Loripes lacteus Seagrass 1.1 11.2 14.0 0
Scrob~culana plana Mud 1 .8 90.8 40.0 0
TelLina ten uis Sand 1.9 13.4 15.0 1 .:
Gastropoda
Bittium reticula turn Sand 2.1 1.2 1.6 0.3
Biftium reticulatum Seagrass 1.3 1.8 1.6 0
Cyclope neritea Sand 2.0 13.7 13.0 0
Haminea hydatis Seagrass 1.7 7.5 12.0 0.7
Hydrobia ulvae Mud 1.8 0.6 1.5 49.7
Mesalia brevialis Sand 1.8 7.0 10.0 0
Polychaeta
Audoinia filigera Seagrass 3 0 9.1 10.0 2.2
Glycera convoluta Seagrass 3.4 7.3 25.0 0
Melinna palmata Seagrass 2.3 3.9 6.0 0
Nereis diversicolor Seagrass 5.3 4.0 60.0 0
Nereis diversicolor Mud 3.3 5.3 60.0 0
Crustacea
Carcinus maenas Mud 6.4 14 1.7 700.0 0
Cyathura cannata Seagrass 3.0 1.0 2.3 0
Cyathura carinata Mud 1.8 1.7 2.3 0
Idotea chelipes Seagrass 3.8 0.8 3.0 0
Upogebia pusilla Seagrass 3.1 73.8 70.0 31.7
a weight exponent of 0.75 for the absolute metabolic production to respiration in the range of 0.1 to 1.0. It rate. Hence, a weight exponent of -0.25 also for an should be related to body weight by a power curve. intraspecific comparison between the PIB ratio and This is a contradiction of the straight Engelmann line. body weight is plausible. (2) The PIB ratio depends on the environmental con- Reviewing literature data concerning this point, ditions. This involves temporal and spatial aspects. Banse (1979), however, found on average a quotient of Depending on the conditions, production figures can
0 20 40 60 80 MO 120 l40 180
Mean annual body weight ii lmgj
P/B ratio
0 l00 200 300 400 600 800 700 800
Weight at first sexual maturity Mg lmgj F I ~ . 2. Interspecific comparison of ratios of annual production to mean annual biomass (original data in Table 2); data are plotted against (a) mean annual body weight W and (b) body weight at first sexual matunty Mg (both ash free dry weight including
Sprung: Estimating macrobenthic secondary production
vary between zero and a maximum, which Table 3. Regressions of the data presented in Table 2 and Fig. 2: a power
characterizes the potential production (i.e. curve of the form y = axb is fitted to the data (log-log plot) or a Linear
the productivity of a species). in regression of the form y = a
+
bx; the constants a and b are presentedtogether with their standard deviations ( f SD); r. correlation coefficient;
temperate regions many animals regularly n: number of data points undergo starvation periods caused by short-
age of food (Epp et al. 1988), and/or inappro- priate physiological conditions (e.g. moulting of crabs). Body weight can also decline rapidly because of the release of gametes. In ecological studies like the present one, total
Log-log P/B vs i3 2.18 f 0.15 0.075 f 0.064 0.26 21 Linear P/B vs W 2.40
+
0.31 0.018 f 0.008 0.47 21Table 4 Comparison between the PIB ratios estimated in this study and data reported in the literature for different localities
Species PIE Locality Source
Cerastodema edule 4.8 Ria Formosa, Portugal This study
0.2 Tamar Estuary. England Warwick & Price (1975)
1.1-2.6 Mud flat, England Hibbert (1976)
0.7-8.9 Grevelingen Estuary, Netherlands Wolff & d e Wolf (1977)
2.2-21.0 Swedish west coast Moller & Rosenberg (1983)
1.6a Ria d e Aveiro. Portugal Moreira (1988)
Cerastoderma glaucum 2.5-4.8 Prevost Lagoon, France Guelorget & Mazoyer-Mayere (1985)
Scrobicularia plana 1.8 Ria Formosa. Portugal This study
0.2 Tamar Estuary, England Warwick & Price (1975)
0.6-0.9 Mud flat, N. Wales Hughes (1970)
(quoted by Ansell et al. 1978)
0.8-5.7 Gironde Estuary, France Bachelet (1982)
3.7 Prevost Lagoon, France Guelorget & Mazoyer-Mayere (1983)
Tellina t e n u ~ s 1.9 Ria Formosa, Portugal This study
0.3-0.9 Sand flat, Scotland Trevallion (197 1)
(quoted by Ansell et al. 1978)
Bittium reticulatum 1.3; 2.1 Ria Formosa, Portugal This study
2.9-3.5 Spanish north coast Borja (1988)
Hydrobia ulvae 1.8 Ria Formosa. Portugal This study
1.2-1.8 Grevelingen Estuary. Netherlands Wolff & d e Wolf (1977)
1.9-4.1 Firth of Forth, Scotland McLusky et al. (1978)
1.25 German Wadden Sea Asmus (1982)
4.5-6.1 Gironde Estuary, France Bachelet & Yacine-Kassab (1987)
Melinna palmata 2.3 Ria Formosa, Portugal This study
2.2 English Channel Oyeneken (1988)
Nereis &versicolor 3.3; 5.3 Ria Formosa, Portugal This study
3.1 Ythan Estuary, Scotland Chambers & Milne (1975)
2.5 Brackish-water ponds, Belgium Heip & Herman (1979)
2.6 Norsminde Fjord. Denmark Kristensen (1984)
3.5-5.9 Swedish west coast Moller (1985)
2.2 Loire Estuary, France Gillet (1990)
Carcinus maenas 6.4 Ria Formosa. Portugal This study
4.5 Swedish west coast Pihl& Rosenberg (1982)
0.3-0.7 Swedish west coast Baden & Pihl (1984)
6.7 Swedish west coast Moller et al. (1985)
2.8; 3.4 Swedish west coast Pihl (1986)
production and not only somatic production is relevant. That is why these losses must not be subtracted from production figures. Rather, production encompasses all substances once built u p during a time interval, independently of whether they persist until the end of
the observation period or not (Clarke 1946, Banse &
Mosher 1980). This also includes products which are extremely difficult to quantify under field conditions, such as e . g . mucus, exuviae or byssus threads. Conse- quently, the time scale for production is conveniently
1 yr. During this interval the species had passed
through all possible physiological situations.
The actual nutritional condition of a species in a par- ticular environment depends on the feeding type. Some modes of feeding can be more profitable than others under specific conditions. Boudreau e t al. (1991) discuss in this context 'trophic positions' which influ- ence P/B levels.
Extremely high production figures can b e attained
by carnivorous species in culture systems (e.g. Brett &
Groves 1979). It is not by chance that also in this study
the predator Carclnus maenas holds a very special
position (Fig. 2).
The other group are filter feeders. Levinton (1972) postulated that they pursue a feeding strategy which is adapted to a food source which is highly variable in space a n d time. When fed properly, production rates can be enormous; this makes them a profitable target in aquaculture systems (Mason 1976).
What is the best way under these conditions to obtain production figures from body weight and bio- mass? Extrapolations by the regressions presented by
Banse & Mosher (1980), Schwinghamer et al. (1986)
a n d Brey (1990) Imply a degree of exactness which is not matched by reality. As outlined above, production figures depend strongly on the specific conditions under which a population exists. This fact is not taken into account by these extrapolations. That is why they should only be applied when the 'good old way' for estimating secondary production is not feasible (Brey 1990).
Especially in nonboreal habitats these regressions
should be treated with utmost care. Banse & Mosher
(1980) deduced their equation from species living between 5 and 20°C (annual average temperature). They speculate that the regression may be translo- cated parallel to higher values for species living in warmer climates. In fact, in the habitat studied here, the consequence is not a translocation but rather a rotation of the regression line. It may result in weight
exponents even greater than zero. This in turn is an
effect of the emphasis of the main factor which actually causes a large body size in the specific environment, whether it is the longevity of a species or its high spe- cific growth rate. Under these conditions, the intra-
specific trend and the interspecific trend, which are
mixed in these equations, may show a d ~ f f e r e n t orien-
tation. Consequently, a 2-step approach is preferable as applied in the 'Methods' section: (1) obtain the best
P / B possible for this species (PIB,,,,,) at a n average
body weight ( W ) in this particular environment. This
estimate can be extrapolated from other populations or species of similar feeding mode, from literature data, or
from regression analysis as in Fig. 2. (2) Calculate the
actual PIB (P/B,,d) for the body weight encountered
(wind), assuming a weight exponent of -0.25 for the
intraspecific comparison (Eq. 3 ) .
Acknowledgements I am very grateful to Prof Dr S. Gerlach, Kiel, and to 3 anonymous referees for commenting on the manuscript, and to Dr J. Brooker and Mrs P. Horta e Costa for checking the English. The study was performed in the Ger- man-Portuguese research project 'Die Biologie der Ria For- mosa', funded by the Bundesministerium fur Forschung und Technologie, Germany (Grant no. 03F0562A).
LITERATURE CITED
Ansell, A. D., McLusky, D. S., Stirling, A., Trevallion, A. (1978). Production and energy flow in the macrobenthos of two sandy beaches in South West India. Proc. R. Soc. Edin. (Sect. B) 76: 269-296
Asmus, H. (1982). Field measurements on respiration and sec- ondary production of a b e n t h ~ c community in the northern Wadden Sea. Neth. J. Sea Res. 16: 403-413
Bachelet, G. (1982). Quelques problemes lies a l'estimation d e la production secondaire. Cas des bivalves Macorna balth- ica et Scrobicularia plana. Oceanol. Acta 5 . 421-431 Bachelet, G., Yacine-Kassab, M. (1987). Integration de la
phase post-recrut6e dans la dynamique des populat~ons du gast6ropode intertidal Hydrobia ulvae (Pennant).
J. exp, mar. Biol. Ecol. 11 1: 37-60
Baden. S . , Pihl, L. (1984). Abundance, biomass and produc- tlon of mobde epibenthic fauna in Zostera marina (L.) meadows, western Sweden. Ophelia 23: 65-90
Banse, K. (1979). On weight dependence of net growth effi- ciency and specific respiration rates among field popula- tlons of invertebrates. Oecologia 38: 11 1-126
Banse, K., Mosher, S. (1980). Adult body mass and annual production/biomass relationships of field populations. Ecol. Monogr. 50: 355-379
B o j a , A . (1988). Biologia y ecologia d e tres especies d e moluscos gasteropodos intermareales Rissoa pdrvd, Bar- leeia unjfasciata y Bitti~im reticulatum. 111. Produccion. Cah. Biol. mar. 29: 319-330
Boudreau, P. R., Dickie, L. M., Kerr, S. R. (1991). Body size spectra of production and biomass as system-level indica- tors of ecolog~cal dynamlcs J. theor. Biol 152: 329-339 Boysen Jensen, P. (1919). Valuation of the Limfjord. I Rep.
Dan. Biol. Stn 26: 3-44
Brett, J. R., Groves, T D. D. (1979). Physiological energetics. In: Hoar, W. S., Randall, D. J.. Brett, J R. (eds.) Fish phys- iology, Vol. 8 Academic Press, New York, p . 279-352 Brey. T (1990). Estimating productivity of macrobenthic
invertebrates from biomass and mean individual weight. Meeresforsch. 32: 329-343
Chambers, M. R.. Milne, H. (1975). Life cycle and production of Nereis dlversicolor 0 . F Miiller in the Ythan estuary,
Sprung: Estimating macrobenthic secondary production
Scotland. Estuar. coast. mar. Sci. 3: 133-144
Clarke, G. L. (1946). Dynamics of production in a marine area. Ecol. Monogr. 16: 321-335
Crisp, D. J . (1984). Energy flow measurements. In: Holme, N. A.. McIntyre, A. D. (eds.) Methods for the study of marine benthos. Blackwell, Oxford, p. 284-372
Engelmann. M. D. (1966). Energetics, terrestrial field studies and animal producti\*ity Adv. ecol. Res. 3: 73-115 Epp, J., Bricelj, V. hl., Evl~~louf, R. E. (1988). Seasonal parti-
tioning and utiliyation of energy reserves in two age classes of the bay scallop Argopecten irradians irradians (Lamarck). J. exp. mar. Biol. Ecol. 121: 113-136
Gillespie, D. M., Benke, A. C. (1979). Methods of calculating cohort production from field data - some relationships. Limnol. Oceanogr. 24: 171- 176
Gillet, P. (1990). Biomasse, production et dynamique des pop- ulation~ de Nereis diversicolor (annelide polychete) de I'estuaire d e la Loire (France). Oceanol. Acta 13: 361-371 Guelorget, O., Mazoyer-Mayere, C. (1983). Growth, biomass
and production of Scrobicularia plana in a Mediterranean lagoon: the Prevost Lagoon (Palavas, Herault, France). Vie mar. 5: 13-22
Guelorget, O., Mazoyer-Mayere, C. (1985). Croissance, bio- masse et production de Cerastoderma glaucum dans une lagune mediterraneenne: 1'Etang du Prevost (Herault, France). Vie mar 7: 15-27
Heip, C., Herman, R. (1979). Production of Nf>reis diversicolor O.F. Muller in a shallow brackish-water pond. Estuar. coast mar Sci. 8: 297-305
Hemrningsen, A. M. (1960). Energy metabolism as related to body size and respiratory surfaces, and its evolution. Rep Steno Mem Hosp. 9: 1-110
Hibbert. C. J (1976). Biomass and production of a bivalve community on an intertidal mud flat. J. exp. mar Biol. Eco~. 25: 249-261
Hughes, R. N. (1970). An energy budget for a tidal flat popu- lation of the bivalve Scrobiculana plana (Da Costa). J. Anim. Ecol. 39: 357-382
Humphreys, W. F. (1979). Production and respiration in ani- mal populations. J. Anim. Ecol. 48: 427-453
Kristensen, E. (1984). Life cycle, growth and production in estuarine populations of the polychaetes Nereis virens and N. diversicolor. Holarct. Ecol. 7: 249-256
Levinton. J. (1972). Stability and trophic structure in deposit- feeding and suspension-feeding communities. Am. Nat. 106: 472-486
Mason, J. (1976). Cultivation. In: Bayne. B. L. (ed.) Marine mussels, their ecology and physiology. Cambridge Univer- sity Press. Cambridge, p. 385-410
McLusky, D. S., Elliot, M., Warnes, J. (1978). The impact of pollution on the intertidal fauna of the estuarine Firth of Forth. In: McLusky, D. S., Berry, A. J. (eds.) Proc. 12th Eur. mar. Biol. Symp. Pergamon Press, Oxford, p. 203-210 This article was submitted to the editor
Moller, P. (1985). Production and abundance of juvenile Nereis diversicolor, and oogenic cycle of adults in shallow
waters of western Sweden. J. mar biol. Ass. U.K. 65-
603-616
Moller, P., Pihl, L., Rosenberg, R. (1985). Benthic fauna
energy flow and biological interaction in some shallow
marine soft bottom habitats. Mar Ecol. Prog. Ser 27.
109-121
Moller, P., Rosenberg, R. (1983). Recruitment, abundance a n d production of Mya arenaria and Cardiurn edule in marine
shallow water, western Sweden. Ophelia 22: 33-55 Moreira, M. H. (1988). Estudo da comunidade bentica num
banco d e lodo intertidal da Ria d e Aveiro, com especial
incidkncia no crescimento, b~omassa e produq8o d o
berbigao, Cardium edule (L.). Cienc. blol. ecol. Syst 8: 47-75
Oyenekan, J. A. (1988). Population dynamlcs and secondary production in Melinna palmata (Polychaeta Amphareti-
dae). Mar. Biol. 98: 247-251
Pihl, L. (1986). Exposure, vegetation and sediment as pnmary
factors for mobile epibenthic fauna1 community structure
and production in shallow marine soft bottom areas Neth. J . Sea Res. 20: 75-83
Pihl, L., Rosenberg, P. (1982). Production, abundance and bio- mass of mobile epibenthic marine fauna in shallow waters,
western Sweden. J . exp. mar Biol Ecol 57: 273-301
Sachs, L. (1978). Angewandte Statistik - Planung und Aus-
wertung, Methoden und Modelle. Springer, Berlin
Schwinghamer, P., Hargrave, B., Peer, D., Hawkins, C. M.
(1986). Partitioning of production a n d respiration among
size groups of organisms in a n intertidal benthic commu-
nity. Mar. Ecol. Prog. Ser. 31: 131-142
Sprung, M. (in press). Macrobenthic secondary production in
the intertidal zone of the Ria Formosa - a lagoon in south- ern Portugal. Estuar. coast. Shelf Sci.
Sprung, M., Cardoso, A. C . (in press). Recruitment and pro-
duction of the shore crab Carcinus maenas in the Ria For-
mosa. Boletim UCA, Univ. do Algarve. Faro
Trevallion, A. (1971). Studies on Tellina tenuis Da Costa. 111.
Aspects of general biology and energy flow. J. exp. mar.
Biol. Ecol. 7: 95-122
von Bertalanffy, L. (1938). A quantitative theory of organic growth. Inquiries on growth laws. 11. Hum. Biol. 10.
181-213
Warwick, R. M., Price, R. (1975). Macrofauna production in a n estuarine mudflat. J. mar. biol. Ass. U.K. 55: 1-18
Waters, T. F. (1977). Secondary production in inland waters.
Adv. ecol. Res. 10: 91-164
Winberg, G. G. (1971). Methods for the estimation of produc- tion of aquatic animals. Academic Press, London
Wolff, W. J., d e Wolf. L. (1977). Biomass and production of zoobenthos in the Grevelingen Estuary, The Netherlands.
Estuar. coast. mar. Sci. 5: 1-24 Manuscript first received: July 27, 1992 Revised version accepted: J u n e 21, 1993