JOCELINE JANICE CORREIA SILVA
Functional analysis of genetic variants associated
with risk for breast cancer: 12q24, a candidate risk
locus
JOCELINE JANICE CORREIA SILVA
Functional analysis of genetic variants associated
with risk for breast cancer: 12q24, a candidate risk
locus
Master in Oncobiology
– Molecular Mechanisms of Cancer
Supervisor: Professor Doctor Ana Teresa Maia, PhD
Co-Supervisor: Doctor Joana Xavier, PhD
Declaração de autoria de trabalho
Declaro ser a autora deste trabalho, que é original e inédito. Autores
e trabalhos consultados estão devidamente citados no texto e
constam da listagem de referências incluída.
Copyright © 2016 – Joceline Janice Correia Silva, Universidade do Algarve A Universidade do Algarve tem o direito, perpétuo e sem limites geográficos, de arquivar e publicitar este trabalho através de exemplares impressos reproduzidos em papel ou de forma digital, ou por qualquer outro meio conhecido ou que venha a ser inventado, de o divulgar através de repositórios científicos e de admitir a sua cópia e distribuição com objetivos educacionais ou de investigação, não comerciais, desde que seja dado crédito ao autor e editor.
i
Agradecimentos
Este espaço é dedicado às pessoas que, de alguma forma, contribuíram para que esta dissertação fosse concluída.
Em primeiro lugar, gostaria de agradecer à minha orientadora, Professora Doutora Ana Teresa Maia, pela compreensão, orientação, por todo o conhecimento partilhado e sobretudo, pelo o incentivo e confiança, ao longo desta etapa. Obrigada pela oportunidade de pertencer a esta equipa.
Quero agradecer à minha co-orientadora, Doutora Joana Xavier, pela paciência, por todo o conhecimento partilhado e apoio sempre que precisei. Obrigada pela disponibilidade e compreensão mesmo nos momentos mais difíceis.
Um agradecimento muito especial ao Bernardo Almeida e à Iris Silva, pela ajuda preciosa no laboratório e pela amizade construída.
O meu maior agradecimento é para os meus pais, que nunca deixaram de acreditar em mim e sempre estiveram do meu lado, e ao meu irmão Henrique, que tanto sacrificou para que a conclusão desta etapa fosse possível.
ii
Abstract
Common risk alleles identified through Genome-Wide Association Studies (GWAS) explain about 14% of familial breast cancer cases. However, GWAS do not identify causative variants in the risk loci and do not contribute to the understanding of risk mechanisms. All of the risk loci functionally analysed to date are cis-regulatory, i.e. polymorphisms that modify gene expression. Therefore,
we hypothesize that cis-regulation is a central mechanism in breast cancer susceptibility.
Differential allelic expression (DAE) is the most robust method to identify the effect of cis-regulatory single nucleotide polymorphisms (SNPs). Our group established a whole-genome DAE map for normal breast tissue, which we integrated with the GWAS data, to identify risk loci with greater potential to be cis-regulatory. We identified 111 loci, with one of them in the 12q24 locus, containing an unpublished GWAS SNP, rs7307700, and 15 DAE SNPs.
We performed in silico analysis to characterize the regulatory potential of candidate cis-regulatory SNPs (rSNPs) in breast cell lines, and in vitro analysis by electrophoretic mobility shift assay (EMSA) to explore interactions between candidate rSNPs and candidate transcription factors (TFs). Three candidate rSNPs, rs10773145, rs10846834 and rs12302714, overlapped regulatory elements and DNase I hypersensitivity sites, and were associated with the DAE observed for two transcribed SNPs (or DAE SNPs), rs7301263 and rs12581512. The candidate SNPs rs10773145 and rs10846834 were both located within known c-FOS and STAT3 binding sites, but showed small allelic differences in the ChIP-seq data. Since there was no ChIP-seq data for rs12302714, we carried EMSA analysis. Although we detected DNA-protein binding for both alleles of this SNP, no allelic differences were detected. We also analysed candidate SNPs for microRNA binding and the results suggested that a microRNA have preferentially binding to the alleles of candidate rSNP rs12302714. These results indicate that the DAE observed might not be explained by differential binding of TFs at the three candidate rSNPs and might be due to other regulatory mechanisms, that require further exploration, such as splicing and microRNAs.
iii
Keywords: breast cancer; single nucleotide polymorphisms; risk; cis-regulatory
iv
Resumo
O cancro da mama é uma das doenças oncológicas mais comuns, sendo a mais frequente causa de morte entre as mulheres. É estimado que uma em cada onze mulheres será diagnosticada com cancro da mama ao longo da sua vida. Trata-se de uma patologia complexa cuja etiologia pode Trata-ser devido a fatores genéticos e não genéticos. Estima-se que 5% a 10% dos casos de cancro da mama são devido a fatores genéticos, no entanto, o conhecimento atual acerca do risco hereditável não explica cerca 50% destes casos familiares. Recentes avanços tecnológicos, nomeadamente nos microarrays de genotipagem, e nos Estudos de Associação no Genoma Inteiro (genome-wide association studies, GWAS) permitiram identificar um grande número de variantes associadas a risco para cancro da mama. Os GWAS são estudos divididos por fases, que analisam variações no genoma inteiro, com o objetivo de descobrir fatores genéticos de risco de doenças comuns na população, como o cancro da mama.
As variantes cis-reguladoras são polimorfismos frequentes na população (>5% de frequência do alelo menos frequente na população), ao contrário das mutações (<1% de frequência na população). Estes polimorfismos têm a capacidade de regular a expressão de genes quando localizados em elementos reguladores, nomeadamente, promotores ou elementos intensificadores (enhancer), podendo afetar a ligação de fatores de transcrição e consequentemente, a regulação de determinado gene.
Atualmente, 94 loci de suscetibilidade para o cancro da mama foram identificados através de GWAS, que explicam apenas cerca de 14% do risco para esta patologia. Até à data, foram estudados funcionalmente 13 loci, e os resultados sugerem que os polimorfismos analisados tinham como mecanismo de atuação a cis-regulação. Adicionalmente, do 94 loci somente um se localiza numa região codificante, com todos os outros a localizarem-se em intrões, regiões intergénicas e regiões sem transcrição detetável (“gene deserts”). Finalmente, os GWAS para além dos 94 loci de risco validados, produziram longas listas de loci com significância estatística muito elevada, que necessitam de ser priorizados para estudos de validação.
v Com base nestas evidências, a nossa hipótese é que a cis-regulação é um mecanismo importante para o risco do cancro da mama e que a maioria dos polimorfismos associados ao risco para o cancro da mama ainda por descobrir poderão ser também cis-reguladores.
Este trabalho foca-se nos polimorfismos de nucleótido único (SNPs) cis-reguladores e, entre outras abordagens, estes SNPs cis-cis-reguladores (rSNP) podem ser identificados através da análise de loci de características quantitativas de expressão (expression quantitative trait loci, eQTL) e da análise de Expressão Alélica Diferencial (differential allelic expression, DAE). A análise de eQTL permite fazer uma associação entre SNPs e a variação de expressão total de determinado gene. No entanto, o nível de expressão total está sujeito a fatores em trans (tal como o nível de proteínas com função de fatores de transcrição), para além dos fatores em cis (alterações na sequência, tal como os SNPs). DAE é um dos possíveis efeitos observados na presença de rSNPs em elementos reguladores, dessa forma, a análise de DAE permite comparar os níveis relativos de expressão dos dois alelos do mesmo gene em indivíduos heterozigóticos, utilizando um SNP transcrito (tSNP ou DAE SNP). Esta abordagem não só indica qual o alelo a causar DAE, como elimina o efeito de fatores trans, pois compara os níveis de transcritos dos alelos individualmente no mesmo contexto celular e haplótipos.
Num trabalho anterior feito pela Prof. Ana Teresa Maia e colegas, desenvolveu-se um mapa de DAE em 64 amostras de tecido mamário normal, que informa quais genes estão sob a influência de rSNPs. O próximo passo será identificar os SNPs causadores de risco. Assim, os dados do mapa de DAE foram cruzados com os resultados publicados e não publicados de GWAS para cancro da mama. Este cruzamento de dados foi feito de acordo com a localização cromossómica, distância física (janelas de ±250kb entre o GWAS SNP e o DAE SNP) e padrões de desequilíbrio de ligação (linkage disequilibrium, LD) com o valor mínimo de r2
= 0.4. Foram identificados 111 loci candidatos que contêm pelo menos um GWAS SNP e um DAE SNP e com forte potencial cis-regulador. Em 32 loci o GWAS SNP e o DAE SNP estavam em elevado LD, ou seja, os seus genótipos estavam fortemente associados. Como todos os loci estudados funcionalmente sugerem que o mecanismo causador de risco para o cancro da mama é a
cis-vi regulação, e como todos os loci identificados, com exceção a um, encontram-se em regiões não codificantes (sugerindo que estão localizados em regiões regulatórias), selecionámos para análise funcional o locus 12q24, não publicado, para testar se este locus encontra-se também sob influência de rSNPs e validar este locus para o risco de cancro da mama. O GWAS SNP neste locus não atingiu o valor estabelecido pelo GWAS para passar a fase III, talvez por não estar em elevado LD com o rSNP causal. Desta forma, iremos testar se a integração do nosso mapa de DAE com os dados do GWAS relativos ao cancro da mama é uma boa abordagem para priorizar loci ainda por validar, com maior probabilidade de estarem sob influência de variantes cis-reguladoras, e consequentemente, mais prováveis a estarem associados ao risco para o cancro da mama.
Este trabalho teve como objetivo: 1) validar um dos loci identificados, mas não validados, localizado na região 12q24, e confirmar a sua associação com o risco para o cancro da mama; 2) identificar e analisar funcionalmente as variantes com potencial a serem cis-reguladoras no locus 12q24; 3) testar se a nossa abordagem é um método eficaz para priorizar variantes candidatas a associados com risco.
Começou-se por analisar o nosso mapa de DAE nesta região. A região do locus 12q24 apresenta 15 DAE SNPs e um GWAS SNP, rs7307700, localizado no gene AACS. Para identificar e analisar possíveis variantes associadas ao risco e com potencial a serem rSNPs, foram feitas análises in silico. Os dados dos projetos HapMap e 1000 Genomes Project foram consultados para identificar os melhores candidatos a rSNPs em LD ≥ 0.4 com o GWAS SNP, sendo identificados 72 rSNPs candidatos. Para analisar estes candidatos, acedeu-se aos dados dos projetos ENCODE e Roadmap Epigenomics, que contêm informações sobre zonas de hipersensibilidade à desoxirribonuclease I (DHSs), imuno-precipitação da cromatina (ChIP-seq) para diversas modificações de histonas e fatores de transcrição, previsões alélicas de ligação de proteínas (PWM). No final desta análise, 12 rSNPs candidatos foram encontrados em sobreposição com DHSs e com regiões que contêm marcadores para elementos reguladores, com evidência de estarem ativos em linhas celulares mamárias,
vii sugerindo que esses podem ter um efeito funcional através da regulação da expressão de genes alvo.,
Para identificar as variantes que poderão estar a causar DAE no locus 12q24, testaram-se os níveis de expressão alélica dos 15 DAE SNPs com os genótipos dos 12 rSNPs candidatos. Dado o padrão de DAE demonstrado pelos DAE SNPs, pretendeu-se identificar os rSNP candidatos cujos homozigóticos não demonstrassem DAE nos DAE SNPs (i.e., SNPs transcritos), e cujos heterozigóticos apresentassem DAE nos DAE SNPs. Três dos 12 candidatos (rs10773145, rs10846834 e rs12302714) explicavam o DAE de dois DAE SNPs (rs12581512 e rs7301263). Para dois deles, rs10773145 e rs10846834, que se encontravam em completo LD um com o outro, existiam dados de ChIP -seq disponíveis que indicavam a ligação das proteínas STAT3 e c-FOS. No entanto, esses dados não revelavam diferenças de afinidade entre os alelos de cada SNP. Para o terceiro candidato, rs12302714, como não existiam dados de ChIP -seq, procedemos com ensaios in vitro. Os resultados de EMSA (electrophoretic mobility shift assay) sugeriram que, apesar de haver ligação de proteína, não existiam diferenças de afinidade para os alelos deste rSNP candidato. De acordo com estes resultados, é possível que estes três candidatos estejam a afetar o DAE observado nos DAE SNPs do gene AACS por outro mecanismo que não a ligação diferencial de fatores de transcrição em elementos reguladores. Outros mecanismos possíveis incluem diferenças alélicas de produção de transcri tos alternativos (alelos a afetar o processo de splicing), ou de regulação por microRNAs.
De seguida, analisou-se se havia alguma previsão de ligação preferencial de microRNAs aos alelos dos 72 SNPs candidatos. Em 17 dos 72 SNPs (incluindo o SNP rs12302714) houve previsões de ligação microRNAs com preferência a um dos alelos comparativamente ao outro. Posteriormente, analisaram-se os genótipos dos candidatos rSNPs, DAE SNP e GWAS SNP para a estrutura de LD nessa região e para identificação dos haplótipos, nas 64 amostras de tecido normal da mama, que poderão ser responsáveis pelo aumento ou diminuição da expressão dos genes. Foram identificados seis haplótipos comuns, estando dois haplótipos associados a diferenças nos níveis de expressão. Estes resultados
viii sugerem que talvez seja o efeito acumulativo de dois ou mais rSNPs a causar o risco para cancro da mama e o DAE observado nos DAE SNPs no locus 12q24. Em paralelo a este trabalho, um outro locus (5q14.2) foi funcionalmente analisado. Um dos candidatos rSNP identificados através da análise in silico, afeta diferencialmente a ligação de um fator de transcrição no gene ATG10, causando assim, DAE por cis-regulação. No entanto, o fator de transcrição que se liga preferencialmente a um dos alelos deste rSNP permanece por identificar. Em suma, o cruzamento dos nossos dados de DAE com os dados de GWAS foi uma boa abordagem para priorizar loci não publicados dos GWASes que estão sob influência de cis-regulação, e com potencial para ser associado ao risco, para validação para o risco de cancro da mama. Futuramente, mais análises in silico e in vitro deverão ser feitas, de modo a entender que outro mecanismo de regulação poderá explicar o DAE observado no locus 12q24, e que fator de transcrição poderá estar a regular a expressão do gene ATG10 (locus 5q14.2). Uma análise mais aprofundada da regulação destes genes poderá levar também à compreensão da biologia de predisposição ao cancro e contribuir para o desenvolvimento de terapias futuras, especialmente na área da medicina personalizada, baseada nos haplótipos que regem o DAE em cada indivíduo.
Palavras-chave: cancro da mama; suscetibilidade; polimorfismos de nucleóticos
ix
Index of contents
Agradecimentos ...i Abstract ...ii Resumo... iv Index of figures... xiIndex of tables ... xiii
Index of annex ... xiv
List of abbreviations ... xv 1 Introduction ... 1 1.1 Cancer overview ... 1 1.1.1 Epidemiology ... 1 1.1.2 Aetiology ... 1 1.2 Breast Cancer ... 3
1.2.1 Pathogenesis, histological and molecular subtypes ... 3
1.2.2 Epidemiology ... 7
1.2.3 Aetiology ... 8
1.3 Genetic Variation/Polymorphisms ... 13
1.3.1 Cis-Acting Regulatory Variants ... 14
1.3.2 Differential Allelic Expression ... 16
1.3.3 Previous work – DAE map in normal breast tissue ... 17
2 Hypothesis... 21
3 Objective & Specific Aims ... 22
4 Materials and methods ... 23
4.1 Study samples ... 23
4.2 Cell lines ... 23
x
4.4 In Silico annotation of variants functional information ... 25
4.5 DAE mapping analysis ... 27
4.6 Polymerase Chain Reaction (PCR) for genotyping rs111549985 ... 28
4.7 Nuclear protein extraction ... 30
4.8 Electrophoretic Mobility Shift Assay (EMSA) ... 30
4.8.1 Oligonucleotide Labelling and Detection ... 31
4.8.2 Protein-Nuclei Acid Binding and Competition Assay... 32
5 Results... 33
5.1 Genomic view of the putative 12q24 risk locus for breast cancer ... 33
5.2 Identification and analysis of candidate rSNPs in the 12q24 locus ... 35
5.3 Mapping analysis... 37
5.4 In silico analysis of candidate rSNPs rs12302714, rs10773145 and 10846834 ... 40
5.5 Analysis of the protein binding preferences in the candidate rSNP rs12302714 ... 43
5.6 In silico analysis of microRNAs binding ... 46
5.7 LD structure and Haplotype analysis ... 48
5.8 EMSA for candidate rSNP rs111549985 of the 5q14.2 locus ... 51
6 Discussion and Conclusion... 54
6.1 Analysis of candidates rSNPs rs10846834 and rs10773145 ... 56
6.2 Analysis of candidate rSNP rs12302714 ... 58
6.3 In silico analysis of microRNAs binding for the 72 SNPs... 58
6.4 LD structure and Haplotype analysis for rs7307700, rs12581512, rs10846834 and rs10773145 ... 59
7 Bibliografia ... 62
Annex 1 ... 69
xi
Index of figures
Figure 1.1.2.1 Carcinogenesis stages. ... 2
Figure 1.2.1.1 Histological classification of breast cancer. ... 4
Figure 1.2.3.2.1 Breast cancer genetic susceptibility loci. ... 9
Figure 1.2.3.2.3.1 GWAS approach for identification of the causal SNP. ... 12
Figure 1.3.1.1 Cis-acting regulatory variation causing differential allelic expression. ... 14
Figure 1.3.2.1 Differences between eQTL and DAE... 17
Figure 1.3.3.1 Global cis-regulation map of breast tissue. ... 18
Figure 1.3.3.2 Patterns for different LD measurements between rSNP and a heterozygous DAE SNP... 19
Figure 4.8.1 Illustration of EMSA technique. ... 31
Figure 5.1.1 Genomic view of the GWAS SNP at the 12q24 locus. ... 34
Figure 5.1.2 Genomic view of the tSNPs at the 12q24 locus. ... 35
Figure 5.2.1 Genomic view of the 12 candidate rSNPs. In the top panel are represented the ChIP-seq data for a series of histone modifications ( ... 36
Figure 5.3.1 DAE distribution pattern of two DAE SNPs. ... 38
Figure 5.3.2 DAE mapping analysis for the candidate rSNPs rs12302714, rs10773145 and 10846834. ... 39
Figure 5.4.1 ChIP-seq results for (A) STAT3 and (B) c-FOS proteins in MCF10A cell line, at the candidate rSNP rs10773145. ... 41
Figure 5.4.2 ChIP-seq results for (A) STAT3 and (B) c-FOS proteins in MCF10A cell line, at the candidate rSNP rs10846834. ... 42
Figure 5.5.1 Determination of labelling efficiency for Biotin Control DNA and for positive control annealed FGFR2. ... 43
Figure 5.5.2 EMSA in vitro assay showing protein-nucleic acid interaction and competition binding studies. ... 44
Figure 5.5.3 EMSA in vitro assay showing protein-nucleic acid interaction of candidate rSNP rs12302714 with two different nuclear extracts. ... 45
Figure 5.7.1 Linkage disequilibrium structure and haplotype blocks for the GWAS SNP (rs7307700, in green), the candidate rSNPs (rs12302714, rs10773145 and rs10846834, all in red) and the DAE SNPs (rs12581512 and rs7304293, in blue). ... 49
xii Figure 5.7.2 Blocks 1 and 2 and their respective haplotypes. ... 50 Figure 5.8.1 EMSA in vitro assay showing protein-nucleic acid interaction and competition binding studies for candidate rSNP rs111549985 (5q14.2 locus). . 53
xiii
Index of tables
Table 1.2.1.1 Breast cancer subtypes classification according to the METABRIC
project. ... 6
Table 4.2.1 List of breast cancer cell lines analysed... 24
Table 4.4.1 Histone modifications. ... 25
Table 4.6.1 Primers sequence designed for PCR. ... 29
Table 4.8.2.1 Preparation of buffer C and 5X binding buffer ... 32
Table 5.2.1 List of candidates rSNPs. ... 35
Table 5.2.2 List of candidates SNPs in AACS gene. ... 36
Table 5.4.1 Predicted transcription factor binding for candidate rSNP rs10773145. ... 40
Table 5.4.2 Predicted transcription factor binding for candidate rSNP rs10846834. ... 40
Table 5.4.3 Predicted transcription factor binding for candidate rSNP rs12302714. ... 40
Table 5.6.1 List of SNPs predicted to be altering miRNA binding affinity. ... 46
Table 5.7.1 Blocks 1 and 2 and their respective haplotypes frequency recombination. . ... 51
xiv
Index of annex
Annex 1... 69 Annex 1.1 DAE SNPs reported in previous results obtained in microarray (Maia et al, unpublished)... 69 Annex 1.2 List of the 72 proxy SNPs in LD ≥ 0.4 with the GWAS SNP. ... 73 Annex 2.1 EMSA for candidate rSNP rs12302714 in different binding conditions. ... 75 Annex 2.2.1 Different EMSA conditions ... 75
xv
List of abbreviations
AACS – acetoacetyl-CoA synthetase AC – adenocarcinoma
BC – breast cancer bp – base pair
BRCA 1 / 2 – breast cancer 1 / 2 BR.H35 – breast variant HMEC
BR.MYO – breast myoepithelial primary bZIP – basic leucine zipper
CCND1 – cyclin D1
c-FOS – FOS proto-oncogene
ChIP-seq – chromatin immunoprecipitation sequencing CNA – copy number aberrations
D’ – D prime
DAE – differential allelic expression
DAE SNP – transcribed single nucleotide polymorphism DCIS – ductal carcinoma in situ
DHS – DNase I hypersensitive site DNA – deoxyribonucleic acid
EGFR – epidermal growth factor receptor EMSA – electrophoretic mobility shift assay eQTL – expression quantitative trait loci ER – oestrogen receptor
xvi ERBB2 – erb-B2 receptor tyrosine kinase 2
FGF – fibroblast growth factor
FGFR – fibroblast growth factor receptor FGFR2 – fibroblast growth factor receptor 2 GWAS – genome-wide association studies HCC1954 - human mammary ductal carcinoma HMEC – human mammary epithelial cells HMF – human mammary fibroblasts IDC – infiltrating ductal carcinoma IGV – integrative genome viewer IntClust – Integrative clustering Kb – kilo-base
LCIS – lobular carcinoma in situ LD - linkage disequilibrium MAF – minor allele frequency miR or miRNA – microRNA
MAP3K1 – mitogen-activated protein kinase kinase kinase 1 MDA-MB-231 – human mammary adenocarcinoma
MCF-7 – human mammary adenocarcinoma MCF10A – human mammary epithelial mRNA – messenger RNA
PR – progesterone receptor PWM - protein weight matrix
xvii r2 – R square
RNA – ribonucleic acid
rSNPs – regulatory single nucleotide polymorphisms SNAP – SNP annotation and proxy search
SNPs – single nucleotide polymorphisms
STAT3 – signal transducer and activator of transcription 3 T-47D – human mammary ductal carcinoma
tSNP or DAE SNP – transcribed single nucleotide polymorphism TP53 – tumour protein 53
1
1 Introduction
1.1 Cancer overview
1.1.1 Epidemiology
Cancer is among the diseases with the highest incidence in the world, leading not only to a reduction in the patient's quality of life but also to a socio-economic decline. It is estimated that one in four males and one in five females will have severe cancer in their lifetime (American Cancer Society, 2016). Every year, worldwide, fourteen million people are diagnosed with cancer and eight million die, and 1/3 of these deaths are thought to be preventable. In Europe alone, there were 3.45 million new cases of cancer (besides non-melanoma skin cancer) in 2012. Since cancer develops with age, these numbers tend to increase, as life expectancy becomes longer. Without further improvement at scientific and prevention level it is estimated that by 2030 death by cancer will increase 59% (Globocan, 2012). In Portugal, according to Globocan 2012, 49,174 people were diagnosed with cancer, with breast cancer being the most common malignant tumour, and the incidence is predicted to increase to 60,772 by 2030.
1.1.2 Aetiology
According to the World Health Organization (WHO), cancer corresponds to an uncontrolled growth and dissemination of cells. Normally, it is characterized by the accumulation of genetic mutations over time, in the same cell, mostly due to environmental factors that cause an abnormal and uncoordinated proliferation of the cell (Figure 1.1.2.1) (Jackson & Loeb 1998). In other words, the real problem in cancer is the uncontrolled ability of a single cell that carries a driver mutation to divide.
2
Figure 1.1.2.1 Carcinogenesis stages. Tumours are complex groups of cells, with high level of intra- and inter- heterogeneity. Each step reflects genetic changes that will lead to a cancer cell. It begins with alterations that will inactivate tumour suppressor genes and activate oncogenes, promoting uncontrolled proliferation of the mutated cell, leading further to metastasis. (Image taken from (Yokota 2000)).
Carcinogenesis is a multistep process which begins with the acquisition of somatic mutations in (proto-)oncogenes or tumour suppressor genes, where activation/up regulation or loss of function, respectively, causes hyperproliferation, blocking of differentiation and inhibition of cellular death (apoptosis) (Osborne 2004). (Proto-)oncogenes are involved in the normal growth of a cell, coding for proteins that stimulate cell growth, proliferation and regulate apoptosis. However, when mutated they become oncogenes that are constitutively activated, leading to abnormal cell proliferation, anomalous expression of growth factors and their receptors, such as fibroblast growth factor (FGF) and fibroblast growth factor receptor (FGFR), respectively. Other examples of oncogenes are HER2, c-MYC, hTERT, EGFR, VEGFR and RAS. Tumour suppressor genes are important for the delay of the cell division and DNA repair. Normally, tumour suppressor genes act by inhibiting cell growth, promoting apoptosis. The deregulation of these genes prevents abnormal cells to die. Some examples of tumour suppressor genes are TP53, BRCA1, BRCA2, APC and RB1 (Lodish et al. 2000).
Tumour cells progressively acquire characteristics that allow them to continue proliferating and developing malignancy. These characteristics are called the Hallmarks of Cancer, and were first proposed in 2000 (Hanahan & Weinberg 2000):
Sustaining proliferative signalling Evading growth suppressors
3 Activating invasion and metastasis
Enabling replicative immortality Inducing angiogenesis
Resisting cell death
The same authors, in 2011, proposed four more new characteristics that are involved in the pathogenesis of cancer (Hanahan & Weinberg 2011). Since none of this new features have been validated, they are called emerging hallmarks:
Deregulating cellular energetics Avoiding immune destruction Tumour-promoting inflammation Genome instability and mutation
Cancer cells have the ability to invade the surrounding tissues and metastasize to distant location, affecting almost any body part. Several types of cancers can be prevented if avoided exposition to common risk factors, such as tobacco and obesity. Furthermore, a significant percentage of cancers can be cured by surgery, radiotherapy or chemotherapy if detected early (World Health Organization, 2016).
1.2 Breast Cancer
1.2.1 Pathogenesis, histological and molecular subtypes
There are several risk factor that increase the susceptibility to develop breast cancer such as age, diet, genetics, familial history, infections and endocrine factors (endogenous and exogenous) (Abdulkareem 2013; Shah et al. 2014). The high heterogeneity, genetic instability and complexity makes the task to identify the biological mechanism that leads to breast cancer more challenging (Abdulkareem 2013). Different types of breast cancer have different aetio-pathogenesis. Morphologically, breast is essentially constituted by fat tissue and mammary glands. Mammary glands are composed by ducts and lobes, which have smaller sections named lobules. The majority of breast cancers are called carcinomas, and depending on the localization they can be called in situ
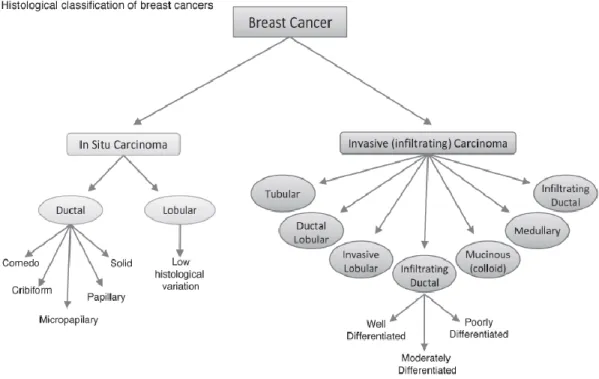
4 carcinoma – when localized in the region where it began -, or invasive carcinoma - if it spread to the surrounding tissues. The initiation of the in situ carcinomas may be in the lobules – lobular carcinoma – or in the ducts – ductal carcinoma, being the ductal carcinoma in situ (DCIS) significantly more common than lobular carcinoma in situ (LCIS) (National Cancer Institute, 2016). Histologically, unlike LCIS, DCIS and invasive carcinoma have intra-tumour histological differences and can be divided in five and seven subtypes, respectively:
Figure 1.2.1.1 Histological classification of breast cancer. Breast cancer can be catalogued into different subtypes, according to histological features and growth patterns. This system is currently used by clinicians to categorize the heterogeneity found in breast cancer. (Image adapted from Malhotra et al. 2010).
Infiltrating ductal carcinoma (IDC) accounts for 70-80% of all invasive carcinomas. In the clinics, the pathologist analyses the nuclear pleomorphism, glandular/tubule formation and mitotic rate in IDC and ranks it according to grades: well differentiated (Grade 1), moderately differentiated (Grade 2) and poorly differentiated (Grade 3) (Malhotra et al. 2010).
Microarray analysis allowed investigators to understand and establish a molecular profile of gene expression in a tumour (Eroles et al. 2012). Molecular characteristics on cancer cells helped improved personalized medicine, since the
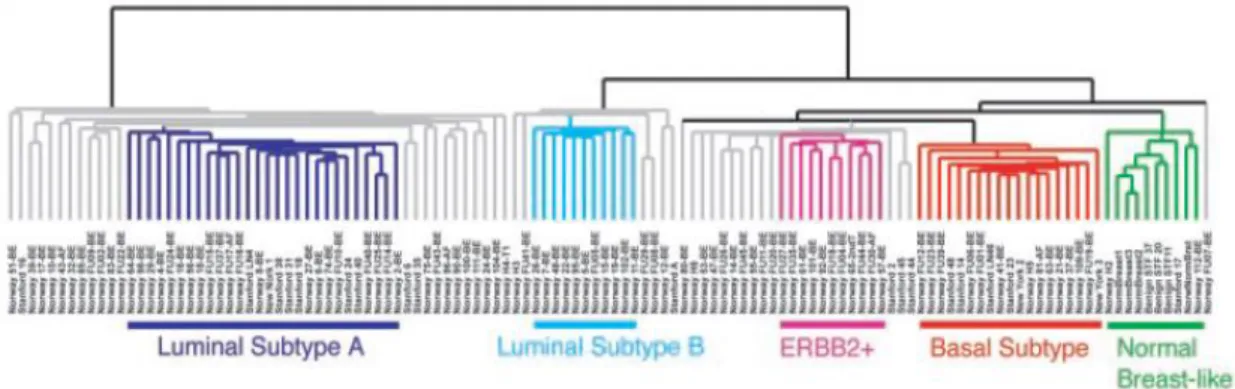
5 same type of tumour is different between people and within the tumour, culminating with differences in patient survival (Malhotra et al. 2010). Depending on the molecular type of tumour, we can predict the response to a directed treatment (Shah et al. 2014). Breast cancer can be divided in five major molecular subtypes (Figure 1.2.1.2) based on gene expression of the tumours: ER+ (oestrogen receptor positive)/Luminal A, Luminal B, Basal-like, ERBB2-enriched (or HER2) and Normal Breast-like (Sorlie et al. 2001; Sorlie et al. 2003).
Figure 1.2.1.2 Molecular classification of breast cancer. Breast cancer present different subtypes, according to intrinsic molecular characteristics identified by microarray analysis of patient tumour specimens. Image taken from (Sorlie et al. 2003).
Luminal A is the most common subtype of breast cancer, representing 50-60%
of total. It is characterized by an increase in ER (oestrogen receptor 1) expression and/or PR+ (progesterone receptor)/HER2- status, GATA binding protein 3 and
oestrogen-regulated LIV-1. It is also associated to low-grade tumours and good prognosis (Eroles et al. 2012; Malhotra et al. 2010; Sorlie et al. 2001).
Luminal B is less common than Luminal A, accounting for approximately 20% of
all breast cancer, and it is known for having low levels of ER/PR receptors, being HER2 negative, with high levels of proliferation, and not having a good prognosis (Sorlie et al. 2001; Malhotra et al. 2010).
ERBB2 is an oncogene that encodes for the transmembrane tyrosine kinase
growth receptor ERBB2 that is part of the human epidermal growth factor receptor (HER/EGFR/ERBB) family. This gene is overexpressed in 20-30% of all breast tumours and is involved in cell proliferation survival, cell motility, and invasion. ERBB2 positive tumours, where the expression of this gene is amplified, are more
6 aggressive and, therefore, present a poor prognosis (Shah et al. 2014; Sorlie et al. 2001; Perou et al. 2000).
Basal-like/triple-negative is characterized by the expression of keratin 5, 6 and
17, integrin beta, fatty acids, laminin and for the absence of ER, PR and HER2 expression. Accounting for 3-15% of all breast tumour, this subtype is associated with poor outcome due to the lack of treatment options (Sorlie et al. 2001; Perou et al. 2000; Badve et al. 2011; Sorlie et al. 2003).
Normal breast-like show similarities with normal breast tissue, expressing genes
related to the adipose tissue, and other none-epithelial cell types (Sorlie et al. 2001).
More recently, a study has examined gene expression and copy number in 2,000 breast tumours, the METABRIC project (Molecular Taxonomy of Breast Cancer International Consortium), performing a new integrative clustering, based on gene expression and copy number data and the results suggested ten novel molecular subtypes, showed in Table 1.2.1.1 (Curtis et al. 2012).
Table 1.2.1.1 Breast cancer subtypes classification according to the METABRIC project. This table was accomplished based on data presented by the METABRIC project (Curtis et al. 2012). IntClust, integrative clustering; CNA, copy number aberrations.
Subgroup Characteristics
IntClust 1 17q23/20q cis-acting luminal B subgroup; relatively good outcome
IntClust 2 High-risk ER+ subgroup; characterized by amplification of 11q13/14, overexpressing genes like CCND1 and RSF1, both previously linked to breast and ovarian cancer; associated with poor prognosis.
IntClust 3 Luminal A cases subgroup, enriched for histotypes that typically have good prognosis; characterized by low genomic instability. IntClust 4 Includes both ER-positive and ER-negative cases;
characterized by low levels of CNA and good prognosis.
IntClust 5 ERBB2-amplified subgroup; characterized by HER2 enrichment (ER-negative) cases and luminal (ER-positive) cases; low prognosis
IntClust 6 8p12 cis-acting luminal subgroup; characterized by amplification of 8p12
7 IntClust 7 Luminal A subgroup; characterized by 16p gain/16q loss and
higher frequencies of 8q amplification
IntClust 8 Luminal A subgroup; characterized by 1q gain/16q loss, a common translocation event
IntClust 9 8q cis-acting/20q-amplified mixed subgroup IntClust
10
Basal-like cancer enriched subgroup; characterized by high genomic instability and cis-acting alterations, namely, 5 loss/8q gain/10p gain/12p gain; good long-term outcome
These molecular characteristics are important biomarkers that can indicate the patient overall cancer outcome – prognosis biomarker – and the effect of a therapeutic intervention – predictive biomarker – in order to improve diagnosis and treatment for breast cancer (Oldenhuis et al. 2008).
1.2.2 Epidemiology
In 2012, nearly 1.67 million women were diagnosed with breast cancer worldwide, and almost 522,000 of these women died (ranking as the fifth cause of death worldwide), making breast cancer the most common cancer in women (Globocan 2012). In the same year, 463,800 European women were diagnosed with breast cancer, from which 131,200 died (Ferlay et al. 2013). In Portugal, out of 6,088 women diagnosed with breast cancer, 1,570 died. Unfortunately, these numbers have a tendency to increase and by 2050 it is estimated 3.2 million new cases per year worldwide. As expected, the incidence is higher in developed than in undeveloped countries, and this is related mostly to these countries’ lifestyle. It is estimated that one in eight women will have breast cancer during their lifetime, in which 89% have more than 40 years. This change in incidence can be also due to an increase in population-based screening, which leads to an early detection and decrease in mortality (Youlden et al. 2012).
8
1.2.3 Aetiology
1.2.3.1 Environmental /Overall Risk factors
Although screening through mammography does not prevent cancer, it reduces the risk of dying from cancer. Finding cancer at early stages, while asymptomatic, makes the treatment easier and increases long-term survival (Centers for Disease Control and Prevention, 2016). There are some factors that can be avoided and that contribute to an increase risk of breast cancer, such as exposure to carcinogenic substances (e.g. alcohol, tobacco and red meat), oral contraceptives, give birth at older age (after 40s), obesity and exposure to radiation. Investing in protective factors such as physical exercise, keeping a healthy diet, a healthy weight and breastfeeding may decrease the risk of developing breast cancer (Youlden et al. 2012; McPherson et al. 1994). It is also known that breast cancer is strongly related with age, and in fact, this disease affects mostly elderly women after menopause (>54 years).
1.2.3.2 Genetic Susceptibility
Genetic susceptibility is an increased probability of an individual to develop a disease based on their genotype. This genetic inheritance can be triggered by environmental factors, normally at late age. Genetic susceptibility can be classified according to the relative risk that the genetic variant confer and their frequency in the population (Figure 1.2.3.2.1) (reviewed in Ghoussaini et al. 2013).
9
Figure 1.2.3.2.1 Breast cancer genetic susceptibility loci. The relative risks and risk allele frequency for each locus. Higher risk mutations have lower frequency on t he population, while common modest-risk alleles confer only a small risk (Ghoussaini et al. 2013).
Inherited factors increase the probability of an individual having cancer due to mutations on the germline cells. About 5-10% of breast cancers are due to genetic predisposition, affecting mainly younger people (Gage et al. 2012). Comparing with the general population, individuals with at least one first-degree relative with breast cancer are two or more times more likely to develop breast cancer. Multiple-case families include a positive familial history with:
At least three relatives, in the same side of the family, with breast or ovarian cancer
At least, one first-degree relative At least one case per generation
At least one first-degree relative diagnose at a younger age (<40) (McPherson et al. 1994)
Although those inherited autosomal dominant mutations represent a small amount of the causes for breast cancer, most of them have a significantly high
10 penetrance - meaning that the individuals that carry those genetic variants have high probability of expressing the phenotype.
1.2.3.2.1 High-risk mutations
Some tumour suppressor genes, such as STK11/LKB1, BRCA1, BRCA2 and TP53, are involved in the repair of damaged DNA. When any of these genes acquire loss-of-function mutations the resulting protein will not be produced or function properly (Apostolou & Fostira 2013; Ripperger et al. 2009). These high-penetrance alleles increase the risk for developing breast cancer by 10- to 30-fold, through the direct effect of the mutation. Although mutations in these genes are rare in the population (have low frequency, <1%), they confer a significant lifetime risk for breast cancer (>50%) (Figure 1.2.3.2.1) (Ghoussaini et al. 2013; Fletcher & Houlston 2010). Twenty five percent of the familial cases of breast cancer are explained by high risk mutations, being 16% due to BRCA1 and BRCA2 germline mutations (Van Der Groep et al. 2011). In fact, multiple-case family studies have shown that by the age of 70, approximately 80% of the carriers of germline mutations in BRCA1 and BRCA2 genes would develop this type of cancer (Milne & Antoniou 2011). The studies and approaches that allowed the identification of these mutations were: i) linkage analysis, that provides statistical evidence of the contribution of a variant or gene in the disease aetiology within families (Ott et al. 2015; Aloraifi et al. 2015); ii) positional cloning, which helps identifying the causal genetic mutations of diseases with simple Mendelian inheritance (Puliti et al. 2007); and iii) DNA resequencing of candidate genes (Fletcher & Houlston 2010).
Indeed, there are studies that show the existence of differences in penetrance within the carrier families, suggesting that there are other factors, such as environmental and genetic modifiers, influencing the risk (Begg et al. 2009; Milne & Antoniou 2011; Ripperger et al. 2009). It has been described that polymorphisms can have an effect in genes, altering their expression, making them an important tool to predict the risk associated with cancer, and,
11 furthermore, this may lead to new therapeutic methodologies for breast cancer patients (Maia et al. 2012; Milne & Antoniou 2011).
1.2.3.2.2 Moderate-risk mutations
Genetics variants in ATM, CHEK2, PALB2, BRIP1, PTEN and CDH1, also involved in DNA repair, increase moderately the relative risk for breast cancer (approximately two-fold), conferring an higher probability of an individual to develop breast cancer in their lifetime of approximately ≥20% (Figure 1.2.3.2.1) (Ghoussaini et al. 2013; Hindorff et al. 2011). DNA resequencing of candidate genes for coding variation, using genetically enriched cases, allowed the identification of these variants (Fletcher & Houlston 2010).
1.2.3.2.3 Common low-susceptibility alleles and GWAS
These alleles are common in the population, with a minor allele frequency (MAF) of >5%, and confer a modest to low relative risk, corresponding to <1.5-fold and a lifetime risk of 10-20% (Figure 1.2.3.2.1) (Ghoussaini et al. 2013). These polymorphisms are usually found by genome-wide association studies (GWAS), that are a type of study that analyses DNA sequence variations through the entire human genome, aiming to identify genetic risk factors for diseases that are common in the population (Bush & Moore 2012; Knight 2014). For breast cancer, recent studies identified so far 94 loci, that explained about 14% of the inherited risk for breast cancer (Michailidou et al. 2015). Of the 94 loci, 13 were studied at a functional level and all suggested that these polymorphisms can modify the expression of genes in a allele-specific manner, namely MAP3K1, CCDC170, ZNF365, CASP8, CCDN1, FGFR2, MDM4 and can modify breast cancer related genes, such as BRCA1 and BRCA2 (Ghoussaini et al. 2013; Michailidou et al. 2015; Ripperger et al. 2009; Maia et al. 2012; Glubb et al. 2015; Cai et al. 2011; Shephard et al. 2009; Wang et al. 2014; French et al. 2013; Meyer et al. 2008; Meyer et al. 2013; Wynendaele et al. 2010). Additionally, the underlying mechanisms of these susceptibility polymorphisms are still unresolved.
12 Single nucleotide polymorphisms (SNPs) are spread across the genome. GWAS use marker SNPs as genetic markers for a certain genomic region and allow the association between numerous SNPs and a specific phenotype or disease (Bush & Moore 2012), by using cases and controls samples. Under the assumption that when the GWAS SNP is not the causative genetic variant and that the actual causal SNP is in high linkage disequilibrium (LD) with the marker SNP, GWAS uses LD as a measurement to correlated the genotypes of two different SNPs (Figure 1.2.3.2.3.1). LD refers to when two or more markers on a chromosome are transmitted together within a population, during chromosome segregation in cell division, forming haplotypes. Thereupon, this non-random association between alleles at two or more loci, is commonly measured by two parameters - D prime (D’) and R square (r2) which compare the observed frequencies of
co-occurrence for two alleles in a population with the frequencies expected if the two markers were independent (Bush & Moore 2012; Morton 2005). D’ varies between zero and one, corresponding to linkage equilibrium when the recombination between two or more markers is elevated, and to linkage disequilibrium, when there is no recombination between the two markers. Coupled with D’, high values of r2 (also scaled between zero and one) indicate
that the two markers transmit similar information. Therefore, it only takes one genotyped marker to find the allelic variation of the other (Bush & Moore 2012).
Figure 1.2.3.2.3.1 GWAS approach for identification of the causal SNP. A GWAS marker SNP in strong LD with a common causal variant, the true responsible for the phenotype, will report the causal SNP. Image obtained and adapted from (Balding 2006).
13 In other words, GWAS uses a marker SNPs that report the association with another SNP when both are in strong LD with each other. In this way, most of all genome sequence is covered only with a small portion of known markers SNPs. More loci associated with risk are yet to be identified, and is expected to be due to common-low susceptibility alleles (Galvan et al. 2010). However, the polymorphisms associated to a certain phenotype found in a GWAS, are rarely the individual causative polymorphism, and therefore it is necessary to improve the current approaches to be able to find the true cause of the observed phenotype and the intrinsic mechanism (Knight 2014; Consortium 2015).
1.3 Genetic Variation/Polymorphisms
Comparing DNA sequences from different individuals, it has been estimated that in every few hundred bases there is a genetic polymorphism. Considering that there are 3.2 billion nucleotides in the human genome and that they can be responsible for alterations in gene expression, it is of extreme importance to study these variations effect on differences in treatment response and disease risk (Stoneking 2001). Unlike mutations, these variations are common, with >1% of allele frequency in the population (Torkamani & Schork 2008).
Within DNA variations, the most common are SNPs (~90%), tandem repeat segments (minisatellite (10-100 bp) and microsatellite (1-6 bp)), and large and small duplications/deletions/insertions (Wang et al. 2005). SNPs are variations of one nucleotide in the DNA sequence with the ability to regulate gene expression. They can also be found in protein-coding regions, and depending on whether the SNP changes or not the encoded amino acid in the final protein it is classified as non-synonymous or synonymous, respectively (Torkamani & Schork 2008). Since SNPs are present in a significant proportion of human populations, they are considered common genetic variation. Also, most of the SNPs have two alleles and their frequency is represented by the minor allele frequency (MAF) rather than the more common allele frequency (the major allele) (Bush & Moore 2012).
14
1.3.1 Cis-Acting Regulatory Variants
Gene expression is regulated by environmental, epigenetic and genetic factors that act both in cis and in trans (Jones & Swallow 2011). Cis-regulation is the mechanism by which a variation in the DNA sequence affects the expression of a gene, by modulating the binding affinity of transcription factors, mRNA stability, methylation and splicing, for example. Meanwhile, trans-regulation relates to the effect of proteins regulating other gene expression, such as transcription factors. Variants in cis-regulatory elements, like promoters, enhancers, silencers and insulators can disrupt or enhance the binding affinity of transcription factors and can lead to unequal levels of transcription between the two alleles of a gene (Figure 1.3.1.1).
Figure 1.3.1.1 Cis-acting regulatory variation causing differential allelic expression. a) A variant in a proximal promoter may prevent transcription factor binding altering expression of the allelic transcript. Transcript SNPs (markers) (shown here as black/white circles) can be used to determine transcript ratios. b) A variant in a distal enhancer site may prevent complex binding and affect transcription levels. Image adapted from (Jones & Swallow 2011).
SNPs can be anywhere in the genome and may affect, for example, the binding affinity of proteins in an allele-specific manner. One of those examples, found through GWAS, is present in the risk-loci FGFR2, where it was shown in a functional analysis that the risk allele was associated with increased expression of this gene when compared to the common allele (Meyer et al. 2008). Another example is MAP3K1, whose risk alleles are also associated with increased gene expression (Glubb et al. 2015). MicroRNAs (miRNA) and methylation can also be affected by genetic alterations such as SNPs. miRNAs are small non-coding RNAs with approximately twenty two nucleotides, that regulate gene expression by binding to mRNA and preventing translation (synthesis of a protein) or by
15 promoting mRNA cleavage and destabilization (Liu et al. 2012). Roughly 3% of genes represent miRNA and 30% of coding genes can be affected by miRNA (Sassen et al. 2008). The presence of a SNP in the 3’UTR of a mRNA might affect the miRNA binding and, consequently, the mRNA translation (Liu et al. 2012). For example, it was shown that the target site of miR-125b, in the 3’UTR of the gene BMPR1B, which encode a kinase, contains a SNP (rs1434536) and that miR-125b differently binds to the C and T alleles of this SNP in breast cancer (Sætrom et al. 2009).
As well as miRNA, chemical modification of DNA and histones is also involved in gene expression regulation. DNA is packed around histone proteins (H1, H2A, H2B, H3, and H4 histones) forming the chromatin, that can suffer modifications such as methylation, acetylation, phosphorylation, ubiquitylation and sumolyation, specifically on lysine residues (K) of histones H3 and H4 (Hellman & Chess 2010; Ellis et al. 2009; Handy et al. 2011). The histone code hypothesis refer that the expression of the DNA information is partially regulated by these modifications. This epigenetic regulation can be complex since each histone can be modified simultaneously with different histone marks at multiple sites. Each histone has different number of lysine (that can be mono-, di- or tri-methylated or acetylated), arginine (that can be methylated) or threonine/serine/tyrosine (that can be phosphorylated). Therefore, it is probable that every nucleosome in a cell presents different modifications. In fact, in a recent study where they analysed 39 histone modifications in human CD4+ T cells, a group have shown that patterns of modifications can occur on the genome, and most of those modifications were associated with promoters and enhancers, suggesting a role of histone modifications in transcriptional regulation (Wang et al. 2008; Handy et al. 2011; Bannister & Kouzarides 2011). The DNA methylation usually occurs in CpG islands (areas in the DNA sequence rich in C (cytosine) and G (guanine) dinucleotides, found frequently in promoters), namely in the C nucleotide, and it might be associated with gene expression repression due to the steric inhibition of regulatory transcription complexes binding to DNA (Handy et al. 2011; Ellis et al. 2009).
Also, the accessibility to the chromatin for transcription factor binding varies according to the chromatin states, that can be open (euchromatin) or compact
16 (heterochromatin). Thus, the chromatin state is controlled by histone modifications. Since active regulatory elements are located in regions with open chromatin, that is, accessible to the transcription machinery, these DNA sites are highly sensitive to DNase I, an enzyme that digests the DNA strand (Jin et al. 2015). Therefore, if a SNP is present in a DNase I Hypersensitive site (DHS), it may cause differences in transcription factor binding between the two alleles and lead to different levels of expression (Schaub et al. 2012).
1.3.2 Differential Allelic Expression
As stated before, regulatory SNPs or rSNPs may lead to different levels of expression between the two alleles of a gene (Maia et al. 2012; Jones & Swallow 2011).
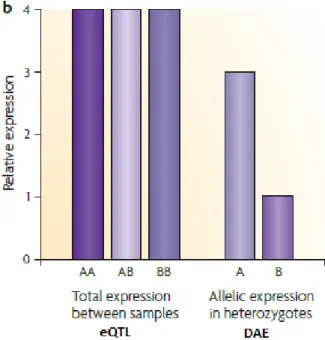
Currently, two approaches are used to detect these differences of expression, namely, expression quantitative trait loci (eQTL) and differential allelic expression (DAE). eQTL provide us information about overall expression (mRNA) of a gene, making association between markers of genetic variation with gene expression levels typically measured in tens or hundreds of individuals. One of the advantages of eQTL is that it allows the identification of new functional loci, through GWAS, without having previous knowledge of specific cis or trans regulatory regions. However, it does not inform us which allele is causing the difference on expression levels (Figure 1.3.2.1) (Pastinen 2010). On the other hand, DAE approach is an allele-specific study, and the differences in expression between the two alleles due to the presence of a rSNP, can be quantified in heterozygous individuals as a ratio of the expression of one allele compared with the other, using transcribed SNPs (DAE SNPs) as allelic markers (Figure 1.3.1.1 and Figure 1.3.2.1). DAE also allows the elimination of environmental or trans-factors that can modify both alleles, since it is focused on the transcribed alleles individually (Pastinen 2010).
Indeed, our research group performed a whole-genome mapping of cis-regulation in normal breast samples using DAE, and these results suggest that approximately 87 % of genes expressed in normal breast tissue are affected by
17 regulatory SNPs (rSNPs) (Xavier et al, unpublished). Another study has used eQTL analyses with information from The Cancer Genome Atlas (TCGA), regarding gene expression in ER+ breast cancer. They conclude that 1.2% of gene expression variance was due to cis-acting SNP loci, which corresponded to 189 out of 15,732 tested genes (Li et al. 2013).
Therefore, here we focus on DAE studies, considering it is more accurate in detecting cis-regulatory loci and in mapping the causal regulatory variant (rSNP), enabling to identify which allele is conferring the up- or down-regulation of a specific gene.
Figure 1.3.2.1 Differences between eQTL and DAE. In eQTL, the overall expression is equal even though the gene is being cis-regulated. In contrast, DAE shows the intrinsic differenc e between the alleles, in individuals heterozygous for a regulatory variant. Image adapted from (Pastinen 2010).
1.3.3 Previous work – DAE map in normal breast tissue
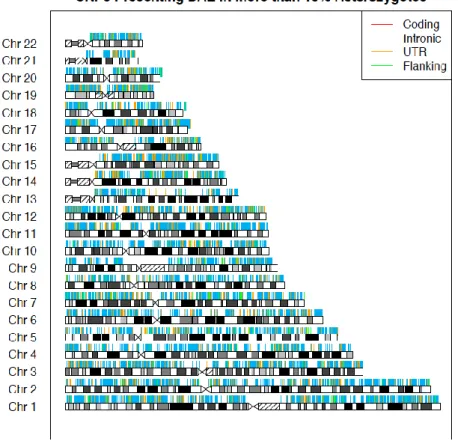
Previous work developed by Professor Ana Teresa Maia and her colleagues, consisted in a DAE scan of the entire genome. This was accomplished using microarrays (Illumina Exon510S-Duo arrays), and 64 normal breast tissue samples, which were genotyped and quantified for allelic expression. The result was a whole-genome map of cis-regulated genes (86.8% of the autosomal
18 genes), with 49,461 DAE SNPs located in 11617 genes, in breast tissue (Figure
1.3.3.1).
Figure 1.3.3.1 Global cis-regulation map of breast tissue. This map gives us information about which genes are being cis-regulated and, therefore, presenting differential allelic expression (Maia et al, unpublished).
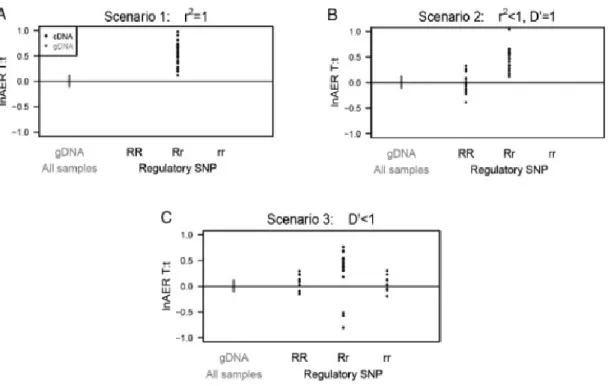
The DAE measured in tSNPs (DAE SNPs) can be explained by the effect of an rSNP that differentially regulates their expression. Depending on the different levels of LD (measured by D’ and r2) between the rSNP and the tSNP, three
patterns of DAE distribution can be seen in this map, consistent with the scenarios 1, 2 and 3 described by Xiao and Scott (Xiao & Scott 2011):
Scenario 1, if the tSNP is in complete LD (r2=1) with the rSNP. All
heterozygous samples for the tSNP will show DAE (Figure 1.3.3.2. A) with the same allele being preferentially expressed.
Scenario 2, when the LD between the tSNP and rSNP is not complete, but strong (r2<1, D’=1). In this case, individuals heterozygous for the tSNP (Tt)
might be homozygous (RR) or heterozygous (Rr) for the rSNP (Figure
19 (those heterozygous for the rSNP) and some will not (homozygous for the rSNP)
Scenario 3, when the tSNP and rSNP are in low LD (r2<1, D’<1), it is
possible to find four combinations of the heterozygous tSNP with the rSNP in the population (Figure 1.3.3.2. C). Therefore, some individuals will not display DAE (the ones homozygous RR or rr for the rSNP) and others will display preferential expression of one or another allele (Rr or rR for the rSNP).
Figure 1.3.3.2 Patterns for different LD measurements between rSNP and a heterozygous DAE SNP. Image taken from (Xiao & Scott 2011).
Furthermore, with the aim to prioritize the best candidates for cis-acting regulatory SNPs in breast cancer, a member of our research group (Doctor Joana Xavier) cross-compared the DAE data (Maia et al, unpublished) with the published (94 loci associated with risk for breast cancer) and unpublished (reported in a GWAS late phase) GWAS data. This integration was done by identifying loci that had at least a GWAS SNP and a DAE SNP within 250kb away from each other and with a minimum LD of r2 = 0.4. This generated a list of 111 clusters with strong
20 DAE SNP are in high LD. In the end, one cluster was prioritized – 12q24 locus – that contains a GWAS SNP that did not pass the last phase of the GWAS (with a p-value = 0.002), since the threshold was 1x10⁻⁷, not being associated to breast
cancer risk. Since GWASes have a produce a list of unpublished SNPs to validate, the integration of our DAE data with the GWAS data for breast cancer, was also a way to prioritize the loci with genes being regulated by cis-regulatory variants, and therefore, more likely to be associated with breast cancer risk, for further validation studies. Therefore, we wanted to validate this unpublished locus to breast cancer risk, by identifying the cis-regulatory variants causing DAE, and further re-test the GWAS SNP with those candidate cis-regulatory variants, in order to associate the 12q24 locus to breast cancer risk. This way, the aim of this study was to validate an unpublished GWAS locus to confirm it as a new risk locus for breast cancer.
21
2 Hypothesis
One of the limitations of GWASes is that they are unable to identify the true causal variant or the mechanism conferring risk for breast. Also, all variants found so far associated with risk for breast cancer were located in non-coding regions, suggesting that breast cancer associated variants may be mainly located in regulatory elements. To this date, 13 of the 94 loci were studied at a functional level by other research groups, and all of these causative SNPs were cis-regulatory (Wynendaele et al. 2010; Ghoussaini et al. 2014; Gorbatenko et al. 2014; Quigley et al. 2014; Glubb et al. 2015; Wang et al. 2014; Hurtado 2013; Dunning et al. 2016; Cai et al. 2011; Meyer et al. 2008; French et al. 2013; Huijts et al. 2011; Long et al. 2010; Cowper-sal et al. 2012). Thus, we hypothesize that cis-regulation is an important mechanism, contributing to the risk for breast cancer, and that cis-acting variants are responsible for the DAE observed. Additionally, GWAS have generated long lists of SNPs that were very close to reach genome-wide significance, and need to be validated to confirm their association with risk. Being DAE one of the effect observed in the presence of cis-regulatory SNPs, this makes it a powerful method to identify these SNPs. Therefore, integrating our DAE results with the GWAS unpublished and published data may be a powerful approach to prioritize loci to validate, with higher probability to be associated with risk for breast cancer and gene expression regulation.
22
3 Objective & Specific Aims
For this master thesis, our main objective was to test if our DAE studies are a powerful tool to prioritize unpublished GWAS loci for validation studies, in order to help identifying further risk loci associated with breast cancer. Our specific aims were:
1. To find new candidate cis-acting regulatory SNPs in the 12q24 locus; 2. To functionally analyse their regulatory potential;
3. To use them to validate the unpublished 12q24 locus and its association with breast cancer risk
23
4 Materials and methods
4.1 Study samples
In this work we studied a total of 290 samples. Eighty-four (84) samples were from normal breast tissue, extracted from women whose reduction mastectomy was performed for reasons not related to cancer. These normal breast tissue samples were collected at Addenbrooke’s Hospital, Cambridge, United Kingdom. Additionally, 150 samples of Human B cells (blood) were extracted from anonymous blood donors and 56 samples were extracted from cancer patient B cells (blood), both obtained from Blood Centre at Addenbrooke’s Hospital. All samples referred were acquired with the approval of the Addenbrooke’s Hospital Local Research Ethics Committee (REC reference 04/Q0108/21 and 06/Q0108/221).
DNA and total RNA was previously extracted from all samples using a conventional SDS/proteinase K/phenol method and TRizol® method, respectively. All extraction procedures were done at the University of Cambridge and the extracted RNA was used for DAE analysis.
4.2 Cell lines
In vitro assays were made with nuclear extract from breast cancer cell lines, namely, T-47D (human mammary ductal carcinoma, oestrogen receptor positive (ER+)), HCC1954 (human mammary ductal carcinoma, an oestrogen receptor negative (ER-)), MCF-7 (human mammary adenocarcinoma, (ER+)) and MDA-MB-231 (human mammary adenocarcinoma, (ER-)) cell lines (Table 4.2.1). Nuclear extract from T-47D and HCC1954 cell lines were available in our stock. MCF-7 and MDA-MB-231 were cultured in DMEM medium at 37ºC and supplemented with penicillin/streptomycin to avoid contaminations and 10% foetal bovine serum, which is rich in growth factors, allowing the cells to grow, divide and survive. All cell lines were obtained from our collection.
24 The normal breast cell lines analysed in silico were HMEC (human mammary epithelial cells), HMF (human mammary fibroblasts), MCF10A (human mammary epithelial cells), BR.MYO (breast myoepithelial primary cells) and BR.H35 (breast variant HMEC).
Table 4.2.1 List of breast cancer cell lines analysed. IDC, invasive ductal carcinoma; AC, adenocarcinoma; DC, ductal carcinoma. ER/PR/ERBB2/TP53/EGFR status: ER/PR positivity, ERBB2/EGFR overexpression and TP53 mutational status and protein levels. WT, wild -type. Information from (Neve et al. 2006) and ATCC website (www.lgcstandards-atcc.org).
4.3 Linkage disequilibrium analyses and identification of proxy SNPs
The publicly available tool SNAP (SNP Annotation and Proxy Search) was used to measure the LD between SNPs and for the identification of proxy SNPs. Proxy SNPs are SNPs in high LD that report each other. Thus, when a candidate SNP is not available on a particular genotyping array, proxy SNPs in LD with that candidate SNP can report it, based on observed LD patterns in the International HapMap Project (HapMap) and 1000 Genome Project (Johnson et al. 2008; The 1000 Genomes Project Consortium 2012). Both projects were developed with the aim of identify and catalogue genetic variants with frequencies of at least 1% in the populations studied. We only use information of European (CEU) studies from 1000 Genome Project and a maximum limit distance between the SNPs of 500kb (kilo-base).
25
4.4 In Silico annotation of variants functional information
In silico annotation was performed in order to gather information regarding regulatory chromatin states, haplotype structures, DNase I Hypersensitive sites (DHSs), histone modifications, protein weight matrix previsions (PWM), microRNA binding predictions and chromatin immunoprecipitation sequencing (ChIP-seq), relatively to the candidate rSNPs.
For our analysis, histone modifications were used to identify regulatory elements, since they are responsible for controlling the accessibility for protein binding (Table 4.4.1) (Handy et al. 2011). We also analysed DHSs data, since it is a powerful method to identify transcriptional regulatory elements and the chromatin states (Table 4.4.1).
Table 4.4.1 Histone modifications. Examples of known histone modifications in breast tissue, where they are found genomically and some of their effect. Information gathered from Roadmap and UCSC Genome Browser in the scope of this work.
Modifications Effect
H3K4me3 Active promotor
H3K4me1 Active and inactive enhancers – mostly
intergenic regions
H3K4me2 Active promotor
H3K27me3 Repressive
H3K27ac Active promotor and active enhancer
H3K36me3 and H3K79me2 Transcriptional repression
H3K9me3 Repeat repression
H3K9ac Active mark
ChIP-seq consists in a combination of two techniques, which are chromatin immunoprecipitation and sequencing. In this method, DNA-protein complexes are precipitated with a specific antibody that recognizes the target protein followed by DNA sequencing, allowing the identification of protein-DNA binding sites (Mardis 2007). We gathered information regarding ChIP-seq in Haploreg v4.1 database and RegulomeDB.
PWM is a probabilistic model that provides predictions concerning transcription factor binding consensus sites in a certain DNA sequence (Chen et al. 2007). It