IGF2, LEPR
,
POMC
,
PPARG
, and
PPARGC1
gene
variants are associated with obesity-related risk
phenotypes in Brazilian children and adolescents
E.M. Queiroz
1, A.P.C. Caˆndido
2, I.M. Castro
3, A.Q.A. Bastos
1,
G.L.L. Machado-Coelho
4and R.N. Freitas
1 1Departamento de Nutric¸a˜o Clı´nica e Social, Nu´cleo de Pesquisas em Cieˆncias Biolo´gicas, Universidade Federal de Ouro Preto, Ouro Preto, MG, Brasil 2
Departamento de Nutric¸a˜o, Universidade Federal de Juiz de Fora, Juiz de Fora, MG, Brasil 3
Departamento de Farma´cia, Nu´cleo de Pesquisas em Cieˆncias Biolo´gicas, Universidade Federal de Ouro Preto, Ouro Preto, MG, Brasil 4Escola de Medicina, Nu´cleo de Pesquisas em Cieˆncias Biolo´gicas, Universidade Federal de Ouro Preto, Ouro Preto, MG, Brasil
Abstract
Association studies of genetic variants and obesity and/or obesity-related risk factors have yielded contradictory results. The aim of the present study was to determine the possible association of five single-nucleotide polymorphisms (SNPs) located in theIGF2,LEPR,POMC,PPARG, andPPARGC1genes with obesity or obesity-related risk phenotypes. This case-control study assessed overweight (n=192) and normal-weight (n=211) children and adolescents. The SNPs were analyzed using minisequencing assays, and variables and genotype distributions between the groups were compared using one-way analysis of variance and Pearson’s chi-square or Fisher’s exact tests. Logistic regression analysis adjusted for age and gender was used to calculate the odds ratios (ORs) for selected phenotype risks in each group. No difference in SNP distribution was observed between groups. In children,POMC rs28932472(C) was associated with lower diastolic blood pressure (P=0.001), higher low-density lipoprotein (LDL) cholesterol (P=0.014), and higher risk in overweight children of altered total cholesterol (OR=7.35, P=0.006). In adolescents, IGF2 rs680(A) was associated with higher glucose (P=0.012) and higher risk in overweight adolescents for altered insulin (OR=10.08, P=0.005) and homeostasis model of insulin resistance (HOMA-IR) (OR=6.34, P=0.010).PPARGrs1801282(G) conferred a higher risk of altered insulin (OR=12.31, P=0.003), and HOMA-IR (OR=7.47, P=0.005) in overweight adolescents. PARGC1 rs8192678(A) was associated with higher triacylglycerols (P=0.005), andLEPR rs1137101(A) was marginally associated with higher LDL cholesterol (P=0.017).LEPR rs1137101(A) conferred higher risk for altered insulin, and HOMA-IR in overweight adolescents. The associations observed in this population suggested increased risk for cardiovascular diseases and/or type 2 diabetes later in life for individuals carrying these alleles.
Key words: Association study; Obesity; Genetic polymorphisms; Brazilian population
Introduction
Individuals who are overweight or obese are at significantly greater risk for death (1). Specifically, the two conditions are risk factors for type 2 diabetes, cardiovascular diseases (2,3), many forms of cancer (4), pulmonary disease, hypertension (2,3), dyslipidemia, and osteoarticular and psychiatric diseases (3).
Obesity is due to an imbalance between food intake and energy expenditure that is determined by environ-mental and genetic factors. Eighteen genes associated with obesity have already been identified by genome-wide association studies (5-7). Other genes are unequivocally associated with factors related to obesity (8-14); however,
the associations of some of these genes with obesity have been inconclusive, and few studies have investigated subjects with an onset of obesity at an early age. Moreover, there is a lack of data on populations from Southern Hemisphere countries, especially for children and adolescents.
To determine the association of genetic variants and obesity and/or obesity-related risk factors, we analyzed the genotype and allele distributions of five single-nucleotide polymorphisms (SNPs) located in the genes for insulin-like growth factor 2 (IGF2), leptin receptor (LEPR), proopio-melanocortin (POMC), peroxisome proliferator-activated
Correspondence: R.N. Freitas:,rfreitasmail@gmail.com..
receptor gamma (PPARG), and peroxisome proliferator-activated receptor gamma coactivator 1 (PPARGC1) in samples of overweight and normal-weight children and adolescents in a mixed population from southeastern Brazil. We also analyzed the associations of the SNPs with obesity-related risk phenotypes, which are metabolic syndrome components.
Material and Methods
Study designA case-control study was conducted using a sample obtained from a cross-sectional population-based study, carried out with children and adolescents aged 7 to 14 years from all schools (14 public and 2 private schools) in the urban zone of Ouro Preto city, State of Minas Gerais, southeastern Brazil between 2008 and 2012 (15). The case group was composed of overweight individuals. The control group, paired by gender and age, was selected from a list of eutrophic individuals according to the order entered in the cross-sectional study. The selection of volunteers was made by simple random selection stratified by the proportion of students grouped according to age, gender, and school. Students with special needs were not included. The sample size was calculated considering the prevalence of overweight status (8%) reported for the population in the age group of the study, an estimated accuracy of 3%, estimated loss of 20%, and
a significance level of 95%. Demographic, biochemical, clinical, and anthropometric data were collected. The tetrapolar bioelectrical impedance method was used to assess body fat percent as calculated by Deurenberg et al. (16). Subjects aged 7 to 14 years were classified according to gender-specific 75th percentile of body fat percentage.
Individuals were categorized according to cutoff values proposed for children and adolescents for some obesity-related risk phenotypes: glucose and waist circumference as proposed by the International Diabetes Force consensus (17), and body mass index (BMI), total cholesterol, low-density lipoprotein (LDL) cholesterol, high-density lipoprotein (HDL) cholesterol, triacylglycerides, blood pressure, and insulin as determined by the Brazilian Society of Cardiology (18). Insulin resistance was estimated by the homeostasis model of insulin resistance (HOMA-IR) (19) and was considered high when HOMA-IR .3.16 (20). Because all participants were underage, their legal guardians signed a consent form, and the project was approved by the Research Ethics Committee of the Universidade Federal de Ouro Preto (No. 0017.238.000-05).
Genotyping assay
Genomic DNA was obtained from a blood sample according to Miller et al. (21). The selection of polymorph-isms assessed in this study was in accordance with the
Table 1. Selected characteristics of overweight and normal weight individuals.
Variables All
(n=403)
Overweight (n=192)
Normal weight (n=211)
Pa
Age (years) 10.3 ± 2.1 10.1 ± 2.0 10.4 ± 2.1 0.162
Height (cm) 141.5 ± 13.0 141.4 ± 12.1 141.6 ± 13.8 0.867 Weight (kg) 39.3 ± 14.4 42.5 ± 15.8 36.3 ± 12.4 ,0.001 Body mass index (kg/m2) 19.0 ± 4.1 20.6 ± 4.6 17.6 ± 2.9 ,0.001 Percent of body fat (%) 30.8 ± 7.8 36.7 ± 5.4 25.5 ± 5.4 ,0.001 Waist circumference (cm) 65.0 ± 11.0 69.3 ± 12.2 61.0 ± 8.1 ,0.001 Birth weight (kg) 3.1 ± 688.4 3.1 ± 674.5 3.0 ± 697.3 0.093 Systolic blood pressure (mmHg) 102.7 ± 13.4 104.5 ± 12.7 101.1 ± 13.8 0.012 Diastolic blood pressure (mmHg) 63.9 ± 9.7 65.1 ± 9.7 62.7 ± 9.6 0.013 Total cholesterol (mg/dL) 161.4 ± 29.3 163.6 ± 29.2 159.5 ± 29.2 0.167 HDL-C (mg/dL) 58.2 ± 14.1 57.4 ± 14.3 58.9 ± 14.0 0.306 LDL-C (mg/dL) 87.3 ± 29.5 89.1 ± 28.9 85.7 ± 29.9 0.248 Glucose (mg/dL) 82.6 ± 8.0 83.1 ± 8.6 82.2 ± 7.4 0.287 Triacylglycerides (mg/dL) 79.9 ± 48.2 85.4 ± 52.6 74.9 ± 43.5 0.030 Insulin (mU/mL) 8.0 ± 6.9 8.9 ± 7.5 7.1 ± 6.2 0.008b
HOMA-IR 1.7 ± 1.5 1.9 ± 1.8 1.5 ± 1.3 0.018
Gender, N (%)
Male 186 (46.2) 93 (50.0) 93 (50.0) 0.219
Female 217 (53.8) 99 (45.6) 118 (54.4)
Data are reported as means±SD or number with percent in parenthesis.aP value for ANOVA (continuous variables) and Pearson’s chi-square test or Fisher’s exact test (categorical variables) for comparison of frequency between overweight and normal weight.
following criteria: 1) positive association with obesity in at least five previous studies and ethnic groups related to the formation of the population of Minas Gerais, 2) no rare allele, and 3) involves exchanges by guanine or cytosine. Gene fragments were co-amplified (5mL) with 100 ng DNA, 0.4mM of each primer (c) and 16Qiagen Multiplex PCR Master Mix commercial kit (Qiagen, The Netherlands). The polymerase chain reaction (PCR) conditions were 15 min at 956C, 39 cycles of 30 s at 946C, 90 s at 576C, 60 s at 726C, and 10 min at 726C. After amplification, 2mL of the PCR product was digested by enzymatic solution containing 2 U/mL ofEscherichia coli exonuclease I (Fermentas Life Sciences, USA), 0.2 U/mL shrimp alkaline phosphatase (Fermentas Life Sciences), and 16 shrimp alkaline phosphatase buffer and then incubated at 376C for 30 min followed by 15 min at 806C. The SNP allele identification (5mL) was 1mL digested PCR product; 0.01-0.6mM of each primer (Supplementary Table S1); 3.5 mM MgCL2, 16 Thermo Sequenase DNA polymerase buffer; 0.5mM fluorescein-labeled 2,3-dideoxycytidine-59 triphosphate (ddCTP) (PerkinElmer Life and Analytical Sciences, USA); 0.5mM each unlabeled
deoxyguanosine triphosphate (dGTP), deoxythymidine triphosphate (dTTP), and deoxyadenosine triphosphate (dATP); and 1 U Thermo Sequenase DNA Polymerase (GE Healthcare, UK). The reaction conditions were 5 min at 806C, 30 cycles of 30 s at 956C, 30 s at 556C, 20 s at 726C, and 5 min at 726C. The monochrome electrophoresis was conducted in a MegaBace 1000 sequencer (GE Healthcare). Data were analyzed using the Fragment Profiler software (GE Healthcare).
Statistical analysis
Insulin values were log10transformed to approximate normal distribution. To test for differences between normal-weight and overweight subjects and between genotype groups, we used one-way analysis of variance (ANOVA) for continuous variables and Pearson’s chi-square or Fisher’s exact tests for categorical variables. Genotype frequencies were tested for Hardy-Weinberg equilibrium. Logistic regression analysis adjusted by age and gender was used to calculate the odds ratios (ORs) for selected phenotype risks associated with obesity and metabolic syndrome in each normal-weight and
Table 2. Single-nucleotide polymorphism (SNP) genotypes and alleles frequencies in overweight and normal-weight individuals.
GenedbSNP Genotypes/alleles All Overweight Normal weight
IGF2rs680 GG 187 (57.2) 90 (55.6) 97 (58.8) GA 120 (36.7) 62 (38.3) 58 (35.2) AA 20 (6.1) 10 (6.1) 10 (6.0)
A 160 (24.5) 82 (25.3) 78 (23.6) G 494 (75.5) 242 (74.7) 252 (76.4) LEPRrs1137101 GG 318 (91.6) 154 (91.7) 164 (91.6) GA 28 (8.1) 13 (7.7) 15 (8.4) AA 1 (0.3) 1 (0.6) 0 (0.0) A 30 (4.3) 15 (4.5) 15 (4.2) G 664 (95.7) 321 (95.5) 343 (95.8) POMCrs28932472 GG 68 (27.2) 31 (27.2) 37 (27.2) GC 117 (46.8) 51 (44.7) 66 (48.5) CC 65 (26.0) 32 (28.1) 33 (24.3) C 247 (49.4) 115 (50.4) 132 (48.5) G 253 (50.6) 113 (49.6) 140 (51.5)
PPARGrs1801282 CC 318 (95.2) 152 (95.0) 166 (95.4)
GC 15 (4.5) 7 (4.4) 8 (4.6) GG 1 (0.3) 1 (0.6) 0 (0.0) C 651 (97.5) 311 (97.2) 340 (97.7) G 17 (2.5) 9 (2.8) 8 (2.3)
PPARGC1rs8192678 GG 138 (55.9) 63 (53.8) 75 (57.7)
GA 94 (38.1) 45 (38.5) 49 (37.7) AA 15 (6.0) 9 (7.7) 6 (4.6)
A 124 (25.1) 63 (26.9) 61 (23.5) G 370 (74.9) 171 (73.1) 199 (76.5)
overweight group. Statistical analyses were performed using the SPSS version 18.0 software (SPSS Inc., USA). Significance level was set at P#0.05, except for multiple comparisons, in which P values were adjusted using Bonferroni’s correction (P#0.01).
Results
As expected, mean weight (P,0.001), BMI (P,0.001), waist circumference (P,0.001), systolic blood pressure (P=0.012), diastolic blood pressure (P=0.013), triacylglycerides (P=0.030), insulin (P=0.008), and HOMA-IR (P=0.018) were higher in overweight individuals than in normal-weight individuals. There were no differences in other continuous variables and gender between the overweight and normal-weight groups (Table 1).
Table 2 shows the genotype and allele distributions of the five SNPs in all individuals and in the overweight and normal-weight groups. There were no differences in genotype and allele distributions. The genotype distribu-tions of all SNPs were in Hardy-Weinberg equilibrium.
Table 3 summarizes the comparison of the anthropo-metric, clinical, and biochemical variables between the groups for the SNPs that showed significant association with at least one obesity-related risk phenotype for children or adolescents. In children, subjects with the POMC rs28932472 allele C presented lower diastolic blood pressure (P=0.001) and higher LDL cholesterol
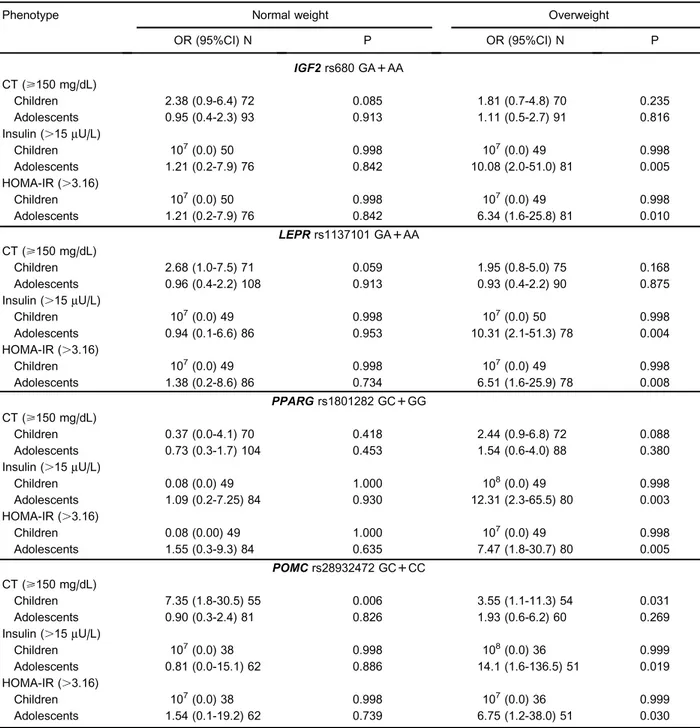
(P=0.014) thanGhomozygous alleles. TheIGF2rs680 allele A was associated with higher glucose (P=0.012) concentrations than measured inGhomozygous alleles. The PPARGC1 rs8192678 allele A presented higher triacylglycerol (P=0.005) concentrations than G homo-zygous alleles. Subjects with theLEPRrs1137101 allele Apresented higher LDL cholesterol concentrations thanG homozygous alleles that were only marginally significant (P=0.017). In adolescents, only the POMCrs28932472 allele C was associated with lower glucose (P=0.009) concentrations thanGhomozygous subjects. No associa-tion was found for PPARG rs1801282 or the other variables tested (BMI, body fat percentage, waist circum-ference, birth weight, systolic blood pressure, total cholesterol, LDL/HDL cholesterol, insulin, and HOMA-IR). Table 4 shows the results of the logistic regression for the obesity-related risk phenotype forIGF2rs680,LEPR rs1137101, PPARGrs1801282, and POMCrs28932472 in normal and overweight children or adolescents, with the common homozygous allele as reference (dominant model). With respect to lipid profile, overweight children carrying theCallele forPOMCrs28932472 polymorphism had higher odds for higher total cholesterol (OR=7.35, 95% confidence interval [CI]=1.77-30.49, P=0.006). Additionally, overweight adolescents carrying theAallele forIGF2rs680 or theAallele forLEPRrs1137101 or the Gallele forPPARGrs1801282 polymorphism had higher odds for higher insulin (OR=10.08, 95%CI=1.99-51.04, P=0.005; OR=10.31, 95%CI=2.07-51.27, P=0.004;
Table 3.Summary of anthropometric, clinical, and biochemical characteristics of children or adolescents according to genotype groups in the dominant model.
Variable Children Adolescents
DBP (mmHg) LDL-C (mg/dL) Glucose (mg/dL) TG (mg/dL) Glucose (mg/dL)
LEPR rs1137101
GG 62.2 ± 10.2 (131) 81.3 ± 29.9 (134) 80.4 ± 7.8 (134) 79.8 ± 62.2 (134) 80.4 ± 7.8 (134) GA++AA 62.9 ± 5.6 (10) 102.8 ± 23.5 (12) 78.5 ± 6.0 (12) 80.0 ± 31.0 (12) 82.4 ± 7.2 (17)
P 0.835 0.017 0.409 0.988 0.253
POMC rs28932472
GG 66.2 ± 9.3 (25) 74.4 ± 28.3 (25) 81.9 ± 8.7 (25) 77.6 ± 34.3 (25) 86.4 ± 6.8 (43) GC++CC 60.2 ± 7.5 (78) 89.6 ± 26.1 (84) 79.9 ± 7.8 (84) 85.3 ± 65.2 (84) 82.8 ± 7.4 (98)
P 0.001 0.014 0.283 0.574 0.009
IGF2 rs680
GG 60.8 ± 8.8 (81) 88.9 ± 28.2 (86) 79.1 ± 7.8 (86) 80.9 ± 43.9 (86) 84.7 ± 8.7 (100) GA++AA 63.5 ± 10.9 (54) 80.4 ± 29.4 (56) 82.4 ± 7.1 (56) 83.7 ± 88.2 (56) 83.3 ± 6.3 (84)
P 0.117 0.084 0.012 0.805 0.234
PPARGC1 rs8192678
GG 62.1 ± 7.9 (58) 84.2 ± 28.7 (61) 80.7 ± 8.4 (61) 65.7 ± 28.3 (61) 85.3 ± 7.2 (77) GA++AA 61.9 ± 8.5 (45) 85.7 ± 24.3 (47) 79.0 ± 7.3 (47) 95.0 ± 72.5 (47) 83.1 ± 9.4 (62)
P 0.914 0.772 0.282 0.005 0.131
and OR=12.31, 95%CI=2.31-65.50, P=0.003, respec-tively) and higher odds for higher HOMA-IR (OR=6.34, 95%CI=1.56-25.81, P=0.010; OR=6.51, 95%CI=
1.64-25.86, P=0.008; and OR=7.47, 95%CI=1.82-30.72, P=0.005, respectively). No association was found forPPARGC1rs8192678.
Table 4. Summary of odds ratio and 95% confidence intervals for selected phenotypes of the SNPs studied in the dominant model.
Phenotype Normal weight Overweight
OR (95%CI) N P OR (95%CI) N P
IGF2rs680 GA++AA
CT (>150 mg/dL)
Children 2.38 (0.9-6.4) 72 0.085 1.81 (0.7-4.8) 70 0.235 Adolescents 0.95 (0.4-2.3) 93 0.913 1.11 (0.5-2.7) 91 0.816 Insulin (.15mU/L)
Children 107(0.0) 50 0.998 107(0.0) 49 0.998
Adolescents 1.21 (0.2-7.9) 76 0.842 10.08 (2.0-51.0) 81 0.005 HOMA-IR (.3.16)
Children 107(0.0) 50 0.998 107(0.0) 49 0.998
Adolescents 1.21 (0.2-7.9) 76 0.842 6.34 (1.6-25.8) 81 0.010
LEPRrs1137101 GA++AA CT (>150 mg/dL)
Children 2.68 (1.0-7.5) 71 0.059 1.95 (0.8-5.0) 75 0.168 Adolescents 0.96 (0.4-2.2) 108 0.913 0.93 (0.4-2.2) 90 0.875 Insulin (.15mU/L)
Children 107(0.0) 49 0.998 107(0.0) 50 0.998
Adolescents 0.94 (0.1-6.6) 86 0.953 10.31 (2.1-51.3) 78 0.004 HOMA-IR (.3.16)
Children 107(0.0) 49 0.998 107(0.0) 49 0.998
Adolescents 1.38 (0.2-8.6) 86 0.734 6.51 (1.6-25.9) 78 0.008 PPARGrs1801282 GC++GG
CT (>150 mg/dL)
Children 0.37 (0.0-4.1) 70 0.418 2.44 (0.9-6.8) 72 0.088 Adolescents 0.73 (0.3-1.7) 104 0.453 1.54 (0.6-4.0) 88 0.380 Insulin (.15mU/L)
Children 0.08 (0.0) 49 1.000 108(0.0) 49 0.998
Adolescents 1.09 (0.2-7.25) 84 0.930 12.31 (2.3-65.5) 80 0.003 HOMA-IR (.3.16)
Children 0.08 (0.00) 49 1.000 107(0.0) 49 0.998 Adolescents 1.55 (0.3-9.3) 84 0.635 7.47 (1.8-30.7) 80 0.005
POMCrs28932472 GC++CC CT (>150 mg/dL)
Children 7.35 (1.8-30.5) 55 0.006 3.55 (1.1-11.3) 54 0.031 Adolescents 0.90 (0.3-2.4) 81 0.826 1.93 (0.6-6.2) 60 0.269 Insulin (.15mU/L)
Children 107(0.0) 38 0.998 108(0.0) 36 0.999
Adolescents 0.81 (0.0-15.1) 62 0.886 14.1 (1.6-136.5) 51 0.019 HOMA-IR (.3.16)
Children 107(0.0) 38 0.998 107(0.0) 36 0.999
Adolescents 1.54 (0.1-19.2) 62 0.739 6.75 (1.2-38.0) 51 0.030
Discussion
In children and adolescents, BMI is the traditional method used to characterize nutritional status (22). However, it does not provide information on the proportions of fat and lean masses, so other methods have been used to infer the body composition of children and adolescents, such as skinfold thicknesses, body circumferences, bioe-lectrical impedance analysis, and dual-energy X-ray absorptiometry (23). In fact, there are few nutrigenetics studies of Southern Hemisphere populations, especially in children and adolescents (24,25). Because genetic ances-tral background appears to contribute to the variation in adiposity at the population level (26), and gene-environ-ment interactions account for risk phenotypes, the results of nutrigenetics studies can only be applied or extrapolated in well characterized populations. Thus, our study con-tributes to studies on mixed populations.
Although we did not find any association between the five SNPs and adiposity, other risk phenotypes related to obesity were associated withLEPRrs1137101,POMCrs28932472, IGF2rs680,PPARGrs1801282, andPPARGC1rs8192678. We found thatLEPRrs1137101 was associated with higher LDL cholesterol values in adolescents. Studies with children and adolescents did not reveal an association between this SNP and HDL or LDL cholesterol values, waist circumference, body fat percentage, insulin, triacyl-glycerides, glucose, total cholesterol, HOMA-IR, or blood pressure (27,28). Conflicting results have been reported for BMI (27,28), and higher daily energy intake was observed in Brazilian children at 4 years of age (29). Even though some studies showed an association between POMC rs28932472 and early age of obesity onset in children and adolescents (30,31), there is little information about the phenotypes associated with this SNP. We observed associations betweenPOMC rs28932472 and lower diastolic blood pressure and higher LDL cholesterol values in adolescents. Additionally, we observed an association of this SNP with lower glucose in children. In a study with Italian children and adolescents, the LDL cholesterol values for heterozygous individuals were similar to those found in our study (32). We also found that IGF2 rs680 was associated with higher glucose in adolescents. In Brazilian adults, this SNP was associated with BMI and birth weight (33). We also observed an association between PPARGC1 rs8192678 and higher triacylglycerol concentration in adolescents, which is similar to the results of an adult study (34). Although we did not observe an association ofPPARGrs1801282 with clinical, biochemical, or anthropometric characteristics in our study, the association of this SNP with higher glucose was reported in Brazilian children at 4 years of age (29).
The association of these five SNPs with obesity-related risk phenotypes has not been routinely investigated in children and adolescents. We found that the LEPR rs1137101, IGF2 rs680, and PPARG rs1801282 SNPs were associated with higher ORs for insulin and HOMA-IR, andPOMCrs28932472 SNP was associated with a higher OR for total cholesterol. The relationship betweenPPARG rs1801282 with insulin and HOMA-IR is known because this SNP has been associated with type 2 diabetes (35,36). On the other hand, there is no information about an association ofIGF2rs680 orLEPRrs1137101 with type 2 diabetes. Although the association ofPOMCrs28932472 with a higher OR for total cholesterol has not been previously reported, one study reported a higher preva-lence of this SNP in obese individuals that characteristically tended to exhibit higher values of total cholesterol (31).
Genetics studies of obesity are often performed in Caucasian populations; little is known about the frequency of obesity-related polymorphisms in the admixture popu-lation. Thus, the present study provides new information about the frequency of these polymorphisms and risk in an admixture cohort such as the Brazilian population.
The study has some limitations. First, because the case and control groups were assessed in a cross-sectional study, the effects of the SNPs on the risk phenotypes over time are unknown. We also did not consider environmental factors such as diet or physical activity that might change the effect of the polymorphisms on the phenotypes. Lastly, we cannot rule out the possibility that the identified associations were due to chance, even though the analyses used to examine the relationship between candidate genotypes and risk pheno-types were based ona priorihypotheses. Nevertheless, this is an original study of an understudied population, and our results will help clarify the genetics of risk phenotypes associated with obesity in children and adolescents.
In conclusion, our results revealed associations between SNPs in candidate genes and obesity-related phenotypes in Brazilian children and adolescents, which could suggest increased risk for cardiovascular diseases or type 2 diabetes later in life for individuals carrying these alleles.
Supplementary Material
Click here to view [pdf].
Acknowledgements
We thank Julio Cesar Rodrigues Fontenelle for provid-ing suggestions and performprovid-ing the statistical analysis. Research supported by CNPq (#47.4965/2004-0), CAPES, FAPEMIG (#EDT-325/05, #EDT-CDS770/05,
References
1. WHO. Obesity and overweight. Fact sheet No. 311. Accessed March, 2015. http://www.who.int/mediacentre/ factsheets/fs311/en/.
2. Bell CG, Walley AJ, Froguel P. The genetics of human obesity. Nat Rev Genet2005; 6: 221-234, doi: 10.1038/nrg1556. 3. Walley AJ, Blakemore AI, Froguel P. Genetics of obesity
and the prediction of risk for health.Hum Mol Genet2006; 15 (Spec No. 2): R124-R130, doi: 10.1093/hmg/ddl215. 4. Calle EE, Rodriguez C, Walker-Thurmond K, Thun MJ.
Overweight, obesity, and mortality from cancer in a prospectively studied cohort of U.S. adults.N Engl J Med 2003; 348: 1625-1638, doi: 10.1056/NEJMoa021423. 5. Meyre D, Delplanque J, Chevre JC, Lecoeur C, Lobbens S,
Gallina S, et al. Genome-wide association study for early-onset and morbid adult obesity identifies three new risk loci in European populations.Nat Genet2009; 41: 157-159, doi: 10.1038/ng.301.
6. Jiao H, Arner P, Hoffstedt J, Brodin D, Dubern B, Czernichow S, et al. Genome wide association study identifies KCNMA1 contributing to human obesity. BMC Med Genomics2011; 4: 51, doi: 10.1186/1755-8794-4-51. 7. Wang K, Li WD, Zhang CK, Wang Z, Glessner JT, Grant
SF, et al. A genome-wide association study on obesity and obesity-related traits. PLoS One 2011; 6: e18939, doi: 10.1371/journal.pone.0018939.
8. Dahlman I, Arner P. Obesity and polymorphisms in genes regulating human adipose tissue. Int J Obes 2007; 31: 1629-1641, doi: 10.1038/sj.ijo.0803657.
9. Speliotes EK, Willer CJ, Berndt SI, Monda KL, Thorleifsson G, Jackson AU, et al. Association analyses of 249,796 individuals reveal 18 new loci associated with body mass index.Nat Genet2010; 42: 937-948, doi: 10.1038/ng.686. 10. Voight BF, Scott LJ, Steinthorsdottir V, Morris AP, Dina C,
Welch RP, et al. Twelve type 2 diabetes susceptibility loci identified through large-scale association analysis. Nat Genet2010; 42: 579-589, doi: 10.1038/ng.609.
11. The Coronary Artery Disease (C4D) Genetics Consortium. A genome-wide association study in Europeans and South Asians identifies five new loci for coronary artery disease. Nat Genet2011; 43: 339-344, doi: 10.1038/ng.782. 12. Wen W, Cho YS, Zheng W, Dorajoo R, Kato N, Qi L, et al.
Meta-analysis identifies common variants associated with body mass index in east Asians.Nat Genet2012; 44: 307-311, doi: 10.1038/ng.1087.
13. Ehret GB, Munroe PB, Rice KM, Bochud M, Johnson AD, Chasman DI, et al. Genetic variants in novel pathways influence blood pressure and cardiovascular disease risk. Nature2011; 478: 103-109, doi: 10.1038/nature10405. 14. Rankinen T, Zuberi A, Chagnon YC, Weisnagel SJ,
Argyropoulos G, Walts B, et al. The human obesity gene map: the 2005 update. Obesity 2006; 14: 529-644, doi: 10.1038/oby.2006.71.
15. Candido AP, Benedetto R, Castro AP, Carmo JS, Nicolato RL, Nascimento-Neto RM, et al. Cardiovascular risk factors in children and adolescents living in an urban area of Southeast of Brazil: Ouro Preto Study.Eur J Pediatr2009; 168: 1373-1382, doi: 10.1007/s00431-009-0940-1. 16. Deurenberg P, Pieters JJ, Hautvast JG. The assessment of
the body fat percentage by skinfold thickness measurements
in childhood and young adolescence.Br J Nutr1990; 63: 293-303, doi: 10.1079/BJN19900116.
17. Zimmet P, Alberti KG, Kaufman F, Tajima N, Silink M, Arslanian S, et al. The metabolic syndrome in children and adolescents - an IDF consensus report.Pediatr Diabetes 2007; 8: 299-306, doi: 10.1111/j.1399-5448.2007.00271.x. 18. Sociedade Brasileira de Cardiologia. I diretriz de prevenc¸a˜o
da aterosclerose na infaˆncia e na adolesceˆncia.Arq Bras Cardiol2005; 85 (Suppl 6): 3-36.
19. Matthews DR, Hosker JP, Rudenski AS, Naylor BA, Treacher DF, Turner RC. Homeostasis model assessment: insulin resistance and beta-cell function from fasting plasma glucose and insulin concentrations in man. Diabetologia 1985; 28: 412-419, doi: 10.1007/BF00280883.
20. Keskin M, Kurtoglu S, Kendirci M, Atabek ME, Yazici C. Homeostasis model assessment is more reliable than the fasting glucose/insulin ratio and quantitative insulin sensi-tivity check index for assessing insulin resistance among obese children and adolescents. Pediatrics 2005; 115: e500-e503, doi: 10.1542/peds.2004-1921.
21. Miller SA, Dykes DD, Polesky HF. A simple salting out procedure for extracting DNA from human nucleated cells.Nucleic Acids Res1988; 16: 1215, doi: 10.1093/nar/ 16.3.1215.
22. Flores LS, Gaya AR, Petersen RD, Gaya A. Trends of underweight, overweight, and obesity in Brazilian children and adolescents.J Pediatr2013; 89: 456-461, doi: 10.1016/ j.jped.2013.02.021.
23. Wells JC. Toward body composition reference data for infants, children, and adolescents.Adv Nutr2014; 5: 320S-329S, doi: 10.3945/an.113.005371.
24. Hurlimann T, Stenne R, Menuz V, Godard B. Inclusion and exclusion in nutrigenetics clinical research: ethical and scientific challenges.J Nutrigenet Nutrigenomics2011; 4: 322-343, doi: 10.1159/000334853.
25. Fernandez JR, Klimentidis YC, Dulin-Keita A, Casazza K. Genetic influences in childhood obesity: recent progress and recommendations for experimental designs.Int J Obes 2012; 36: 479-484, doi: 10.1038/ijo.2011.236.
26. Fernandez JR, Shriver MD, Beasley TM, Rafla-Demetrious N, Parra E, Albu J, et al. Association of African genetic admixture with resting metabolic rate and obesity among women.Obes Res2003; 11: 904-911, doi: 10.1038/oby.2003.124. 27. Pyrzak B, Wisniewska A, Kucharska A, Wasik M, Demkow
U. No association of LEPR Gln223Arg polymorphism with leptin, obesity or metabolic disturbances in children.Eur J Med Res2009; 14 (Suppl 4): 201-204, doi: 10.1186/2047-783X-14-S4-201.
28. Riestra P, Garcı´a-Anguita A, Schoppen S, Lo´pez-Simo´n L, De Oya M, Garce´s C. Sex-specific association between leptin receptor polymorphisms and leptin levels and BMI in healthy adolescents.Acta Paediatr2010; 99: 1527-1530, doi: 10.1111/j.1651-2227.2010.01877.x.
30. Echwald SM, Sorensen TI, Andersen T, Tybjaerg-Hansen A, Clausen JO, Pedersen O. Mutational analysis of the proopiomelanocortin gene in Caucasians with early onset obesity.Int J Obes Relat Metab Disord1999; 23: 293-298, doi: 10.1038/sj.ijo.0800814.
31. Challis BG, Pritchard LE, Creemers JW, Delplanque J, Keogh JM, Luan J, et al. A missense mutation disrupting a dibasic prohormone processing site in pro-opiomelano-cortin (POMC) increases susceptibility to early-onset obesity through a novel molecular mechanism.Hum Mol Genet 2002; 11: 1997-2004, doi: 10.1093/hmg/11.17. 1997.
32. Santoro N, Perrone L, Cirillo G, Raimondo P, Amato A, Coppola F, et al. Weight loss in obese children carrying the proopiomelanocortin R236G variant. J Endocrinol Invest 2006; 29: 226-230, doi: 10.1007/BF03345544.
33. Gomes MV, Soares MR, Pasqualim-Neto A, Marcondes CR, Lobo RB, Ramos ES. Association between birth weight, body mass index and IGF2/ApaI polymorphism. Growth
Horm IGF Res 2005; 15: 360-362, doi: 10.1016/j.ghir. 2005.06.016.
34. Zhang SL, Lu WS, Yan L, Wu MC, Xu MT, Chen LH, et al. Association between peroxisome proliferator-activated receptor-gamma coactivator-1alpha gene polymorphisms and type 2 diabetes in southern Chinese population: role of altered interaction with myocyte enhancer factor 2C.Chin Med J2007; 120: 1878-1885.
35. Ludovico O, Pellegrini F, Di Paola R, Minenna A, Mastroianno S, Cardellini M, et al. Heterogeneous effect of peroxisome proliferator-activated receptor gamma2 Ala12 variant on type 2 diabetes risk. Obesity 2007; 15: 1076-1081, doi: 10.1038/oby.2007.617.