Power Plants and Deforestation: Recent Evidence
from the Amazon
Juliano Assunção
PUC-Rio
Climate Policy Initiative
Francisco Costa
FGV EPGE
Dimitri Szerman
PUC-Rio
Climate Policy Initiative
October 17, 2017
Abstract
This paper estimates the impacts of the construction of the new HPPs built in the Brazil-ian Amazon between 2003 and 2011 on local deforestation patterns. We assemble a compre-hensive geo-referenced dataset combining dams’ locations and characteristics with remote sensing data. We use the synthetic control method to identify the causal impact of the con-struction of each HPP on forest cover around the HPP site. We find that building plants does not always stimulate deforestation. While some HPP projects stimulate deforestation, others help to avoid it. Overall, we can attribute 14% of the observed deforestation in areas within 50 kilometers around the HPPs to the construction process.
Key Words: Hydro-power, Amazon, Deforestation, Brazil. JEL Codes:.
We thank Gustavo Albuquerque for excellent research assistance. We thank BNDES for the technical co-operation. Costa greatfully acknowledges support from Rede de Pesquisa Aplicada FGV. E-mails: Assunção, [email protected]; Costa, [email protected]; Szerman, [email protected] version here.
1
Introduction
Infrastructure is a key ingredient for economic development and growth. However, large projects are often controversial because of the externalities and distributive impacts they im-pose. Since year 2000, more than one thousand hydroelectric power plants (HPPs) were built around the world. This expanded electricity generation capacity by 427 GW – equal to France and India’s energy production capacity combined (ICOLD, 2016; EIA, 2012). Investments in renewable energy are positive in several ways, and hydro energy is particularly praised for its low generation costs. Yet, the construction of a HPP may create environmental damages in several dimensions (Fearnside and Pueyo,2012), such as CO2 emissions (Kemenes et al.,2011). Since, often, these new HPPs are located in rivers in remote areas with high coverage of na-tive vegetation, the construction process may also lead to loss of forest cover and biodiversity (Benchimol and Peres, 2015). These local effects could be a direct consequence of the flooding of the dam or an indirect effect via economic mechanisms, like altered land use pattern (Duflo and Pande,2007;Strobl and Strobl,2011) or increased population density (Severnini,2014). The environmental risks associated with the construction of large HPPs are particularly relevant for the Amazon area (ANEEL,2016). Brazil has the second largest hydroelectric generation po-tential in the world, and almost all of the country’s unexplored popo-tential is in the Amazon. New plants may have significantly affected the deforestation dynamics in the region. How-ever, identifying the specific contribution of each plant is requires the estimation of the proper counterfactuals – the deforestation paths in the absence of the HPP projects. This challenge is particularly important because the new HPP are generally located in areas with high deforesta-tion rates, along the so-called “Arc of deforestadeforesta-tion”. Although substantial improvements were implemented in deforestation policies, as described inNepstad et al.(2009) andAssunção et al.
(2015), lack of law enforcement is still an issue in Amazon. In such context, where governance structures are still being developed and consolidated, large investment projects might have a non-trivial impact. On the one hand, deforestation is expected to increase due to the construc-tion itself and related processes but, on the other hand, the arrival of big investment firms along with the set of requirements established by the licensing procedures might improve the local governance and thus reduce deforestation.
This paper estimates the impacts of the construction of the new HPPs built in the Brazilian Amazon between 2003 and 2011 on local deforestation patterns. We assemble a comprehensive geo-referenced dataset combining dams’ locations and characteristics with remote sensing data from various sources. The main data source is the Global Forest Change 2000–2014 described byHansen et al.(2013). We focus on deforestation which is one salient potential environmental damage associated with HPP construction, which can be well measured in a comparable way across space and time. Furthermore, loss of forest cover is closely related to other environmental
damages – e.g., biodiversity and GHG emissions.
We use the synthetic control method (Abadie and Gardeazabal, 2003) to build counterfactuals and to identify the causal impact of the construction of each HPP on forest cover within different perimeters around the HPP site. To form the comparison (synthetic) area, we use location points suitable for the construction of a HPP, but that did not actually receive a HPP (Greenstone et al.,
2010). The impact of the construction of a HPP is then the difference between the evolution of forest loss in an affected area and its counterfactual area.
We find that building plants does not always stimulate deforestation. While some HPP projects stimulate deforestation, others help to avoid it. Our main results show that the construction of 4 HPPs accelerated forest loss in their adjacent areas, when compared to their synthetic coun-terparts. We estimate that these HPPs caused around 54 thousand hectares of forest loss per year, or 37% of the observed forest loss in these areas. On the other hand, we find that the other 4 HPPs prevented forest loss – that is, had those HPPs not been constructed, forest loss would have been greater than what we actually observe. We estimate that this group of HPPs avoided 23 thousand hectares of forest loss per year, which means that deforestation around those HPPs in the counterfactual scenario would have been 28% larger than what was actually observed. We cannot identify the impact of the remains 3 HPPs on local forest loss. Overall, considering the 8 HPPs we obtain robust results, 14% of the observed deforestation within 50km buffers around the HPPs can be attributed to the construction of the HPPs.
Our findings contribute to a relatively large body of literature that finds negative impacts of infrastructure on forest cover – e.g. Stavins and Jaffe(1990) andPfaff(1999). Our results sug-gest that the interaction between large infrastructure projects and environmental outcomes are more complex than previously thought. By showing that the construction of some large HPPs avoided forest loss, this paper suggests that not all infrastructure projects are alike, highlight-ing the need for more case-by-case assessment of the environmental risks these projects pose. The specific context of the project location seems to matter substantially. Although our data do not allow the identification of the specific mechanisms behind those results, a few possible explanations are compatible with our results. Project implementation is commonly associated with increased revenues for local governments. In addition, the licensing process might im-pose specific criteria for increased forest protection. Or even, at a broader level, the arrival of the investment along with the exposure of large operating companies to political and interna-tional pressures might create conditions of improved enforcement of environmental regulation, especially in areas of high risk of deforestation.
The paper proceeds as follows. Section 2 provides background information. We describe the core empirical method and detail the data used in Sections 3 and 4. Section 5 presents our main results. Section 6 concludes.
2
Background
Brazil has the second largest hydroelectric power generation in the world, ranked just behind China. Until 2003, Brazil had 139 HPPs with capacity greater than 30 MW, adding up to almost 70 GW of total installed capacity. Since then, the government continued investing in hydro en-ergy licensing the construction of 67 new HPPs (ANEEL, 2016). This expansion may represent a sizable environmental issue because most of the Brazil’s unexplored hydric potential is in the world’s largest tropical forest: the Amazon. Only during the 2000s, 11 new HPPs started to be built in the region – see the list in Table1.
The construction of a dam may affect the local environment in many dimensions, both directly and indirectly. The direct impacts are due to engineering of the plant: the excavations, the clearing of the construction site, and the widening of the vicinity roads. The flooding of the dam and its reservoirs also cause direct loss of forest cover and biodiversity (Benchimol and Peres, 2015), and increase GHG emissions (Kemenes et al., 2011; Fearnside and Pueyo, 2012;
Deemer et al.,2016). Furthermore, by retaining water in the reservoirs, the HPP also affects the quality of water in the area and downstream the river.
The indirect impacts of the construction reflect economic mechanisms. HPPs are often built in remote areas with economies based on land or forestry activities, especially those built in the Amazon. During the construction of a HPP, which lasts around 4 years on average, a large amount of resources and people are attracted to the site of the construction. The average total investment in the HPPs constructed since 1996 is around $650 million dollars, or eleven times the average GDP of the municipalities where these HPPs were built.1 This influx of resources increases the budget of the local municipalities by XXX % during the construction, both through taxes and direct compensations from the federal government and the HPP consortium. Further-more, the construction site employs about 3,700 formal workers, more than the average size of the formal sector in these municipalities at baseline (3,368 workers). Therefore, the size of the construction process imposes a massive shock to the local economy and population. How these indirect changes affect the local environment, however, is ambiguous. While agglomeration and increased demand for local products increase the environmental pressure, the change in the opportunity cost of forestry jobs – due to more opportunities in construction and services sector (Assunção et al., 2016), e.g. – and the change in land use pattern due to water quality and crop suitability (Duflo and Pande,2007) could attenuate the pressure on the forest.
The process of defining which new HPPs to build and its characteristics – site, capacity, size of reservoirs etc – is key to understand this ambiguity. In Brazil, the government centralize
1These values correspond to HPPs with more than 30MW. All figures in 2000 values, deflated using Consumer
the planning and the expansion of such infrastructure projects. The federal government con-ducts initial feasibility studies which need to be approved by the Energy Regulatory Agency (ANEEL). The government, then, auction the construction rights for the approved HPP to the private sector through public bidding. All projects are taken. After that, the winning firm, usually a consortium, develops a full construction plan which need to satisfy all regulatory framework.
A key part in the whole process is obtaining a range of environmental licenses. By law, the Environmental Agency and other competent organs are responsible for supervising the instal-lation and operation of any activity which make use of any natural resource or which may have environmental impact. The consortiums need to present a suitable plan to mitigate environ-mental and social impacts of the construction. This includes the reallocation of population and wildlife affected by flooding, investment in reforestation and in the promotion of sustainable use of natural resources in the affected area. According to each specific aspect, the supervising and licensing agency may be in the federal, state and municipal levels, what makes the pro-cess decentralized. Since each organ may have their local specificities, the propro-cess is costly and noisy. It is estimated that the cost of the mitigating actions account for 12% of the total cost of the project, and the costs associated with contractual and regulatory issues represent additional 7.5% of the total costs (Bank,2008).
Given the physical size of these projects, the sum of investments, and all the actors involved, the choice of where and when to build the dam is made by a combination of technical suitability and political will. The debate is often presented as a choice of development and progress at the expense of the environment and the local population. Even in a setting where regulation explicitly aims to minimize the environmental impacts and in a period where the government made a big push to strengthen environmental policies in the Amazon.2 Thus, the construction process often brings an overlooked region into the spotlight. Federal institutions – such the Environmental Agency itselsf –, NGOs and other steering groups turn to the area around the construction site, potentially creating conditions of improved monitoring and enforcement of environmental regulation.
Taking all these direct, indirect and political considerations, the net effect of the construction of the HPP on local deforestation trends is ambiguous. It all pins down whether the adverse direct effects are greater (or smaller) than the indirect effects of potential mitigating efforts. This is an empirical question which we provide a first evidence.
3
Data Sources and Summary Statistics
3.1
Hydroelectric power plants
To determine the locations of the HPPs built during our study period, we use the Sistema de In-formações Geográficas do Setor Elétrico (SIGEL). It is a publicly available database which contains a comprehensive inventory of suitable sites for the construction of power plants in Brazil. The SIGEL database is maintained by the Brazilian Electricity Regulatory Agency (ANEEL), gath-ering data from all feasibility studies carried in Brazil. The database lists the geographic coor-dinates of all suitable sites, irrespective of their development stage. This is key to our empirical exercise because it allows us to compare deforestation patterns in the surrounding areas of de-veloped and undede-veloped locations. Besides geographic coordinates and development stage, the database provides hydropower potential, the reservoir’s area, and upstream and down-stream water flow from a given location. We complement these data with the construction start dates of each HPP, which we collected from various dispersed online sources.
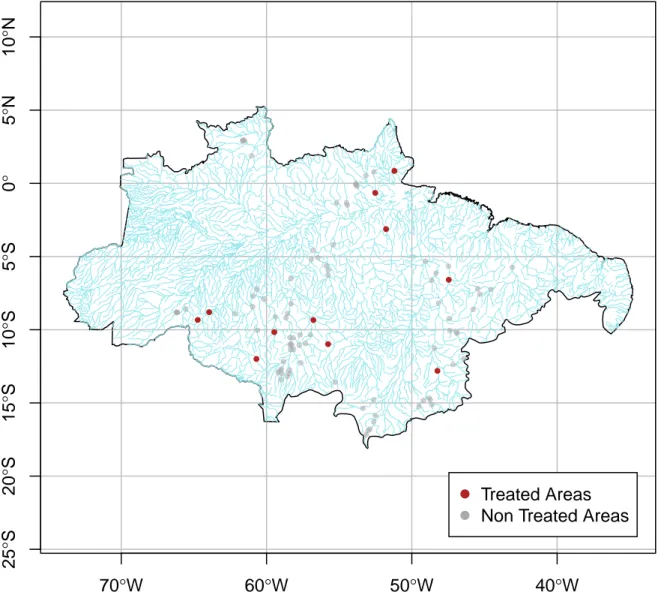
Since our primary interest is on the large HPPs built in the Amazon, we exclude from our sample undeveloped sites outside of Amazonian rivers or with a hydropower potential of fewer than 30 megawatts, which is the regulator’s threshold for a power plant to be consid-ered “large”.These restrictions mitigate concerns that developed and undeveloped sites are substantially different regarding their geophysical characteristics. Furthermore, we exclude undeveloped sites located less than 100 kilometers from any of the 11 HPPs that we study. This restriction is to avoid “contamination” between treated and control sites. After applying these filters, our sample consists of the 11 HPPs built during our sample period and 88 undeveloped sites. Figure1displays the 99 study locations.
3.2
Forest cover and deforestation data
We measure forest cover and deforestation using version 1.3 of the Global Forest Watch (GFW) data (seeHansen et al.,2013). This is a publicly available raster dataset derived from LANDSAT 5, 7 and 8 images, with resolution of approximately 30 x 30 meters at the equator. The GFW data applies algorithms to calculate the percentage of tree cover of each pixel in year 2000, where tree cover is defined as all vegetation greater than 5 meters in height. For each pixel, it also indicates the year of tree cover loss, defined as “stand replacement disturbance”, or the complete removal of tree cover canopy at the Landsat pixel scale.
4
The Area of Influence: Pixel-Level Evidence
In examining the impacts of constructing an HPP on deforestation, the first methodological challenge we face concerns the spatial scale for our analysis. The existing literature gives little guidance on how far from an HPP one should expect to find effects, if any. For a given construc-tion site, different models from the natural scieces would recommend different “correct” areas of influence of the HPP depending on local geographic features and specific characteristics from the HPP (Baylis et al.,2016). In our study, the challenge is compounded by the fact that we aim to apply the same methodology to 11 different interventions, hence it is unavoidable to miss details to some degree. Moreover, the choices must take into account trade-offs between the relevance of the study area, and our ability to credibly estimate causal impacts. Finally, these choices have some arbitrary components, and the best we can do is to use a common procedure to define the main area of analysis and to provide robustness checks by using units of analysis at different spatial scales.
To overcome this challenge, we take a data driven approach to decide how far from an HPP we should look for effects from the construction process. We analyze the most fine-grained unit of analysis possible, namely the pixels from remote sensing images at the 30 x 30 meters resolution. Using pixel-level data, we use a event-study type of specification to examine the probability that a pixel suffers tree cover loss as a function of the distance to the HPP since contruction start.
4.1
Data and Method
We create a yearly panel dataset of pixels by randomly sampling one percent of the pixels within a 75-kilometer radiusof each of the 11 HPPs that were built in the Amazon between 2003 and 2011, spanning the years 2001–2015. This data set contains 33 million pixels-years. We examine the probability of a pixel suffering tree cover loss as a function of being in the influence area of an HPP. The longitudinal aspect of the data allows us to control for pixel fixed-effects, which absorb any time-invariant characteristics, such as geophysical features and distance to urban centers. Table X in the appendix reports summary statistics of this data set.
We use these data to fit the following econometric model: yiht =α+β1[Construction Start]ht
+
K
∑
k=1
θk1[Distance k]ih·1[Construction Start]ht+γi+δt+εiht, (1)
t. The variable 1[Construction Start]ht is an indicator equal to one for years t after construc-tion of HPP h starts. To flexibly allow for the probability of tree cover loss in pixel i to change with its distance to the nearest HPP h, we discretize the pixel i’s distance to HPP h in K bins, represented by 1[Distance k]ih. The coefficients of interest are the θk’s, which capture the
dif-ferential deforestation rate in pixels located k km from the nearest HPP after the beginning of the construction process. We include pixel fixed-effects, γi, to ensure that the θ’s are estimated
using variation from the start of the construction processes of the HPPs. The year dummies, δt,
capture time-varying shocks that are common to all pixels, such as alterations in remote sensor and macroeconomic fluctuations.
4.2
Results
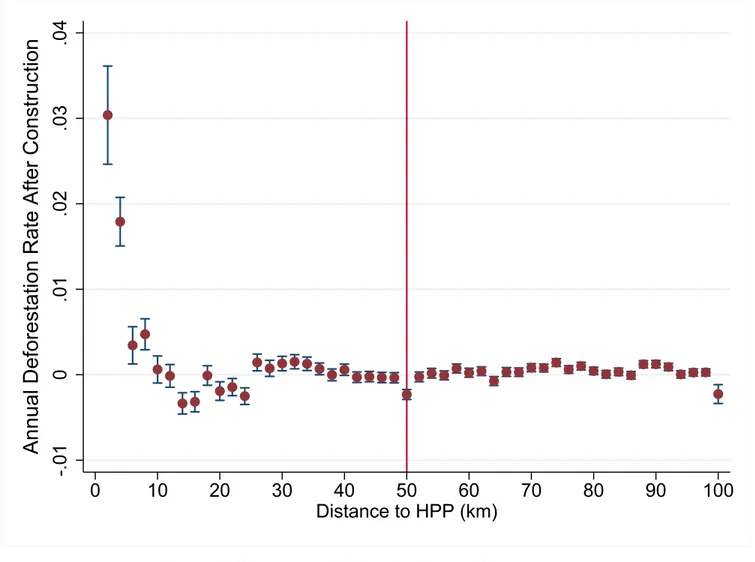
Figure 3 show the estimates of θk using 2km bins. We see that the probability that a pixel
suffers tree cover loss decreases rapidly with the distance from the HPP construction site. We see large (both positive and negative) effects until the 10 or 20-kilometer mark. This is roughly the range one would expect to see the “engineering effects” from the construction of an HPP — installation of the workers’ lodge, flooding of the reservoir, etc. After that, effects seem to stabilize around the 40-kilometer mark.
In the next step of the analysis, we therefore adopt two units of analysis. The first is the con-centric circle of 15-kilometer radius around the HPP, aimed to capture the “direct” effect of building the HPP. The second is the annulus (or “donut”) with a 15-kilometer inner radius and 50-kilometer outer radius. In this area, we hope to capture the more indirect effects of the con-struction process — i.e., the deforestation consequences of population movements and overall economic effects, and of changes in the monitoring and enforcement of environmental regula-tions. We choose the 50-kilometer limit to be conservative and avoid neglecting farther effects.3
5
Direct and Indirect Impacts: Synthetic Control
In this section, we present our main results, the estimates of the impact of the construction of hydroelectric power plants (HPPs) on deforestation around the construction site. But first, we detail our data and empirical strategy.
3Pfaff et al.(2007), for example, finds deforestation spillovers from road construction to about 100-kilometers.
In Appendix X, we experiment with different raddi for the circles an annulli, and results are qualitatively un-changed.
5.1
Data
In this step of the analysis, we turn to data aggregated at concentric circles around the HPPs, with the choice of radio being guided by the pixel-level analysis in the previous section. Our unit of analysis is the area around each HPP, both constructed and planned. More specifically, we focus on the 50-kilometer radius circles around each HPP. We further divide this area in a 15-kilometer radius circles to capture direct impacts, and the annuli (or “donuts”) between 15 and 50 kilometers to measure indirect effects. We therefore aggregate the pixel-level data to calculate tree cover in year 2000, and annual deforestation for these areas. To aggregate tree cover, we take the percentage of pixels with at least 30 percent tree cover.To calculate deforestation in a given year, we first take the percentage of pixels with tree cover loss in that year: pit =
100× Li,t
Ni
, where Li,t is the number of pixels with tree cover loss in area i and year t, and Ni is
the total number of pixels in area i.
InGlobalForestWatch(2017), the authors of the dataset assert that they are “75 percent confident that the loss occurred within the stated year, and 97 percent confident that it occurred within a year before or after”. In order to be more precise, but at the expense of losing yearly variation, we adjust the deforestation variable, by taking moving averages of pit:
Di,t =
pi,t−1+pi,t+pi,t+1
3 . (2)
In our main analysis, we se Dit as our deforestation variable. As a robustness check, we also
provide results using the raw measure pitin the Appendix XXX. Table2summarizes our data,
showing the deforestation trends in treated and control units.
5.2
Empirical Strategy
Our second empirical challenge is to build a counterfactual for what would have happened to forest clearing had the HPPs not been constructed. An accounting exercise of all forest clearing authorized by the environmental authorities is not sufficient, because those areas could have being cleared regardless of the HPPs being built, and deforestation could have being beyond the authorazed areas.Also, during the construction process, the actual clearing could be larger or smaller than the authorized one. More importantly, the decision to build an HPP in a specific place is based on a series of technical, economic, environmental, and political cost-benefit cal-culations undertaken by the regulator and private parties. Therefore, affected areas are likely to be inherently different from non-affected areas along various dimensions. Empirical strategies that rely on simple comparisons between affected and non-affected areas will be confounded by these pre-existing differences, hence failing to identify a causal relationship.
In this step of the analysis, we turn to data aggregated at concentric circles around the HPPs, with the choice of radio being guided by the pixel-level analysis in the previous section. We take advantage of observing multiple pre-treatment periods and multiple potential control units (i.e., suitable but undeveloped sites) and employ the synthetic control method to build a counterfactual for the treated areas. The central idea of this methods is to use, for each area around a newly constructed HPP (treated), pre-construction data of the non-affected ar-eas around planned but not built HPPs to find a “synthetic” area whose deforestation patterns are identical to those of the corresponding affected (treated) area. After construction begins, the deforestation patterns of the synthetic unit serves as the counterfactual for what would have happened to the treated unit in absence of construction. The post-construction differences between deforestation in the affected area and its synthetic counterpart are interpreted as the causal effect of the construction process.
When using more aggregate units of analysis, the synthetic control method is particularly well suited for our application. With only 11 treated units, other quasi-experimental methods, such as instrumental variables or differences-in-differences, are not feasible. In contrast, the synthetic control method requires data on just one treated unit and many non-treated areas, as well as on many pre-treatment periods. Moreover, it provides us with the opportunity to perform 11 case studies, one for each HPP that was built in our study period, using the same methodology and procedures, thus rendering results comparable. To the best of our knowledge, ours is the first attempt to study the impacts of various large infrastructure projects on environmental outcomes in a systematic and comparable fashion.4
The assumption required for the synthetic unit to be a valid counterfactual for the treated area is that there are no shocks specific to the treated area in the post-intervention period, other than the construction of the HPP itself. As an example, the opening of a mining project coinciding or after the construction of the HPP would threaten the interpretation that the start of the construc-tion of the HPP causes all the difference between each treated unit and its synthetic counterpart. As discussed in section 2, it is generally true that the construction of an HPP triggers various changes to the surrounding areas which include, but are not restricted to, the opening of access roads, population movements, and an increase in monitoring and enforcement of environmen-tal regulations. However, it is precisely the combination of such changes brought about by the construction process that our empirical exercise aims to capture. In our case, the concern with these idiosyncratic shocks is diminished because we repeat this exercise for each of the 11 HPPs built.
4The synthetic control method (Abadie and Gardeazabal,2003) has become a popular tool to study the impacts
of a wide range of interventions, including local initiatives to curb tropical deforestation (seeSills et al.,2015, and references therein).
5.2.1 Technical and implementation details
We observe each treated unit together with other J HPPs that are planned but not yet con-structed, these will be our donor pool. Without loss of generality, let j = 1 be a HPP that was constructed, henceforth the treated unit. Suppose also that we observe these units for T peri-ods starting in t = 1 and let T0 < T be the period of HPP’s construction beginning in HPP 1,
henceforth the treatment period.
Let yjt be the realized annual forest clearing in the area around HPP j and time t. Say that in
the absence of the treatment – i.e. if the HPP had not been constructed –, the counterfactual outcome of j in periods t ≥ T0 would be yCjt. We define the difference between the realized
outcome and the potential outcome in the absence of the treatment as the causal effect of the HPP construction in HPP j in period t ≥T0:
αjt=yjt−yCjt, ∀t≥T0. (3)
Since we do not observe yC1t, we estimate it using synthetic control. We obtain ˆy1tC using a weighted average of the J non-affected HPPs. We choose the optimal weight vector W∗ that minimizes ||yj− ˆyCj || = T0−1
∑
t=1 (yjt− ˆyCjt)2 (4) subject to∑jJ=1wj =1, wj ≥0∀j ∈ J.; where W = (w1, w2, ..., wJi) 0and ˆyC 1t =∑ J+1 j=2 yjtwj.We estimate the causal impact of the construction of the HPP on annual forest loss as ˆαjt =
yjt− ˆyCjt in every post treatment period t ≥ T0. To calculate the aggregate impact of the HPP
over the years since the beginning of the construction, we calculate ˆαj =∑t≥T0 ˆαjt.
When applying the synthetic control method, researchers are faced with various implemen-tation decisions. We pursue consistency across the case studies, and therefore use the same implementation of the method for all HPPs. The main choice concerns what data to use for determining the weights of each of the donor pool units. In our main specification, we use all pre-treatment data available for determining the weights of each of the donor pool units, and we do not use any other data. Moreover, we let the optimization algorithm to determine the weights to the data on each of the pre-intervention periods.
Last, we would like to point other limitations of the method and its implementation. First, it may happen that no convex combination of the units in the donor pool convey a good ap-proximation of the pre-construction trends. In our case, the pre-trends of one treated unit, Belo Monte, are so different from the others in the donor pool that the optimization procedure fails to find weights that produce a reasonable synthetic counterctual unit. Second, one
disadvan-tage of the synthetic control method is the absence of widely recognized proceedings for doing statistical inference with more than one treated unit. We overcome this issue by replicating the estimation for many different treated units.
5.3
Results
We turn to present the results. Table XX shows the fit of the synthetic controls for each one of the 11 treated HPPs. We obtained synthetic control units that fit well the pre-trends of 10 of these HPPs. Figure XX in the appendix present the infdividual synthetic control figures showing the trends of each treated and its synthetic control unit. As we can see, the synthetic control unit of Belo Monte shows a loose fit.With this caveat in mind, we discuss the results for this unit in separate.
In what follows, we first show the aggregate effects of the HPPs on deforestation. We then discuss the direct – in areas very close to the plants – and the indirect effects – in a larger radius. We close listing our robustness exercises, presented in Appendix X.
5.3.1 Aggregate Effects
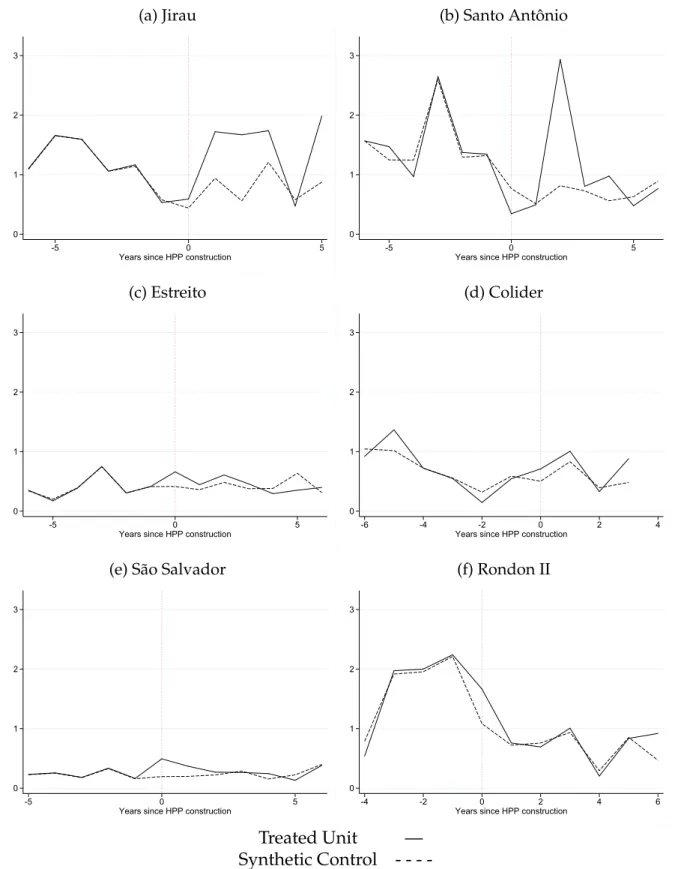
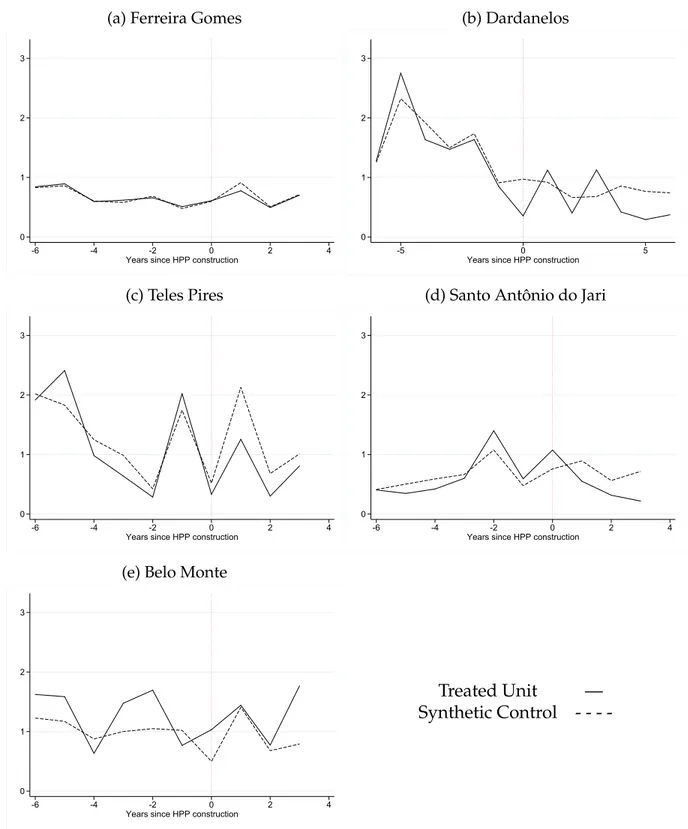
Figure4shows the main results for each of the 50-kilometer radius circles around the 11 HPPs we study. As the figures make clear, in some cases — notably HPP Santo Antônio and HPP Jirau — deforestation rates increase dramatically after construction begins in the areas affected by an HPP, in comparison with the counterfactual scenario where the HPP was not built. In most cases, however, the differences tend to be relatively modest. More surprisingly, in some cases — notably HPP Dardanelos, Santo Antônio do Jari, and Teles Pires — deforestation in the counterfactual scenario is higher than deforestation in the treated unit. Besides evidencing that some HPPs reduce deforestation, these results point to heterogeneity in the treatment effects that we explore in separate section below.
To gain a quantitative grasp of these results, table3aggregates the post-construction impacts of each HPP. Columns 1 and 2 show, respectively, the observed and counterfactual deforestation after the construction started. One striking feature of these figures is that the counterfactual scenarios for the three HPPs that caused the most deforestation are very close to the scenarios of the thee HPPs that most avoided deforestation. In general, there is more heteregeneity in the observed deforestation than in the counterfactual scenarios, suggesting that the source of heterogeneity is in the implementation of the different projects rather than in their location. Column 3 summarizes the effects of HPP by presenting the difference between the first two columns. For example, of the 75.9 thousand hectares that were deforested around HPP Jirau,
37.8 thousand hectares can be attributable to the its construction process. Finally, column 4 nor-malizes the effects by the number of post-construction years, to make figures directly compara-ble across HPPs. We see that the heterogeneity in treatment effects is, if anything, amplified. Overall, of the 460,300 hectares of forest cleared in the post-construction period, 32,500 hectares (or 7 percent) can be attributable to the construction processes of the 11 HPPs. This remarkably small contribution for the overall deforestation can be better understood by noting that most of the HPPs were built in high-deforestation areas, known as the “Arc of Deforestation”.Our results suggest that the shocks induced by the construction of the HPPs were, in general, small in comparison with the ongoing deforestation dynamics of those places.
5.3.2 Direct and Indirect Effects
We now breakdown the results by distance to the HPP. We use 15-kilometer raidius circles to capture the direct (i.e., “engineering”) effects of building a HPP , and areas (annuli or “donuts”) between 15 and 50 kilometers, in which deforestation is unlikely to be driven by engineering works. These indirect effects are more likely to be the result of population movements – and the ensuing land use changes –, of changes in the local economy, and of the tightening in mon-itoring and enforcement of environmental legislation.
Figures 5and 6 show the results for each HPP. As figure 5make clear, deforestation rates in-crease after construction begins in the areas immediately affected by an HPP, in comparison with the counterfactual scenario where the HPP was not built. In some cases, the increase is dramatic: two years after it’s construction started, the observed deforestation rates within a 15-kilometer radius of HPPs Jirau, Santo Antonio, and Rondon II were more than twice that of their respective synthetic control areas. The only exception is the Dardanelos HPP, which displays less deforestation than it’s synthetic control group in every year after its construction started. The indirect effects are more mixed. Figure6reveals that the heterogeneity in treatment effects described in section5.3.1stem from the more distant areas. We summarize these results in table4.
Our finding that the construction of an HPP spurs deforestation in its immediate adjacent area, is not surprising. As discussed in section2, the engineering works make it necessary for native vegetation to be suppressed. For instance, environmental authorities require the flooded area to be cleared of vegetation to avoid excess organic matter in the reservoir. Moreover, developers build small villages to host thousands of workers close to the construction site. At least in part therefore, the increase in deforestation in the affected areas stem from an engineering effect, which is usually legal and previously authorized by the regulator.
5.3.3 Robustness checks
We perform various of robustness checks and placebo tests by experimenting with different radii of the concentric circles and annuli, changing the deforestation measure, dropping donor pool observations with large weights, and manipulating the start of the treatment period. The results are shown in Appendix X.
6
Conclusion
We provide the first evidence isolating the impact the construction of hydroelectric power plants (HPPs has on deforestation. We investigate the 11 HPPs newly built in the Legal Ama-zon area between 2005 and 2011. The wide variation found in the cases studied illustrates that discussions about hydropower plants cannot be reduced to evaluations of particular de-velopments on deforestation. Extreme cases, both of success and failure, are often too salient in the policy debate. The evidence presented here allows researchers and policymakers to take a more nuanced view on the matter. Such perspective should be incorporated in the licensing procedures of future projects and, more generally, in related public policies.
As the World, and Brazil, plans to expand hydroelectric power capacity, we need a deeper un-derstanding of conditions associated with the construction of hydropower plants. Only through that evidence can policymakers begin to mitigate the environmental risks and impact associated with the development of desirable projects.
References
Abadie, A. and Gardeazabal, J. (2003). The economic costs of conflict: A case study of the basque country. American Economic Review, pages 113–132.
ANEEL (2016). Banco de informações de geração. Agencia Nacional de Energya Elétrica. Data accessed June 2016.
Assunção, J., Gandour, C. C., and Rocha, R. (2015). Deforestation slowdown in the legal ama-zon: prices or policies? Environment and Development Economics, 20(6):697–722.
Assunção, J., Costa, F., and Szerman, D. (2016). Local socioeconomic impacts of brazilian hy-droelectric power plants. Working paper.
Bank, W. (2008). Environmental licensing for hydroelectric projects in brazil. Technical Report Report no40995-BR, World Bank.
Baylis, K., Honey-Rosés, J., Börner, J., Corbera, E., Ezzine-de Blas, D., Ferraro, P. J., Lapeyre, R., Persson, U. M., Pfaff, A., and Wunder, S. (2016). Mainstreaming impact evaluation in nature conservation. Conservation Letters, 9(1):58–64.
Benchimol, M. and Peres, C. A. (2015). Widespread forest vertebrate extinctions induced by a mega hydroelectric dam in lowland amazonia. PloS one, 10(7):e0129818.
Deemer, B. R., Harrison, J. A., Li, S., Beaulieu, J. J., DelSontro, T., Barros, N., Bezerra-Neto, J. F., Powers, S. M., dos Santos, M. A., and Vonk, J. A. (2016). Greenhouse gas emissions from reservoir water surfaces: a new global synthesis. BioScience, 66(11):949–964.
Duflo, E. and Pande, R. (2007). Dams. The Quarterly Journal of Economics, 122(2):pp. 601–646. EIA (2012). International energy statistics. Technical report, U.S. Energy Information
Adminis-tration (EIA). Data accessed June 2016.
Fearnside, P. M. and Pueyo, S. (2012). Greenhouse-gas emissions from tropical dams. Nature Climate Change, 2(6):382–384.
GlobalForestWatch (2017). Tree cover loss (hansen/umd/google/usgs/nasa).
Greenstone, M., Hornbeck, R., and Moretti, E. (2010). Identifying agglomeration spillovers: Evidence from winners and losers of large plant openings. Journal of Political Economy, 118(3):536–598.
Hansen, M. C., Potapov, P. V., Moore, R., Hancher, M., Turubanova, S. A., Tyukavina, A., Thau, D., Stehman, S. V., Goetz, S. J., Loveland, T. R., Kommareddy, A., Egorov, A., Chini, L., Justice, C. O., and Townshend, J. R. G. (2013). High-resolution global maps of 21st-century forest cover change. Science, 342(6160):850–853.
ICOLD (2016). World register of dams. Technical report, International Commission on Large Dams (ICOLD). Data accessed June 2016.
Kemenes, A., Forsberg, B. R., and Melack, J. M. (2011). Co2 emissions from a tropical hydro-electric reservoir (balbina, brazil). Journal of Geophysical Research: Biogeosciences, 116(G3). Nepstad, D., Soares-Filho, B. S., Merry, F., Lima, A., Moutinho, P., Carter, J., Bowman, M.,
Cattaneo, A., Rodrigues, H., Schwartzman, S., et al. (2009). The end of deforestation in the brazilian amazon. Science, 326:1350–1351.
Pfaff, A., Robalino, J., Walker, R., Aldrich, S., Caldas, M., Reis, E., Perz, S., Bohrer, C., Arima, E., Laurance, W., and Kirby, K. (2007). Road investments, spatial spillovers, and deforestation in the brazilian amazon. Journal of Regional Science, 47(1):109–123.
Pfaff, A. S. (1999). What drives deforestation in the brazilian amazon?: evidence from satellite and socioeconomic data. Journal of Environmental Economics and Management, 37:26–43. Severnini, E. (2014). The power of hydroelectric dams: Agglomeration spillovers. IZA
Discus-sion Paper No. 8082.
Sills, E. O., Herrera, D., Kirkpatrick, A. J., Brandão Jr, A., Dickson, R., Hall, S., Pattanayak, S., Shoch, D., Vedoveto, M., Young, L., et al. (2015). Estimating the Impacts of Local Policy Innovation: The Synthetic Control Method Applied to Tropical Deforestation. PloS ONE, 10(7):e0132590.
Stavins, R. N. and Jaffe, A. B. (1990). Unintended impacts of public investments on private decisions: the depletion of forested wetlands. The American Economic Review, pages 337–352. Strobl, E. and Strobl, R. O. (2011). The distributional impact of large dams: Evidence from
70°W 60°W 50°W 40°W 25 ° S 20 ° S 15 ° S 10 ° S 5 ° S 0 ° 5 ° N 10 ° N ● ● ● ● ● ● ● ● ● ● ● ● ● Treated Areas Non Treated Areas
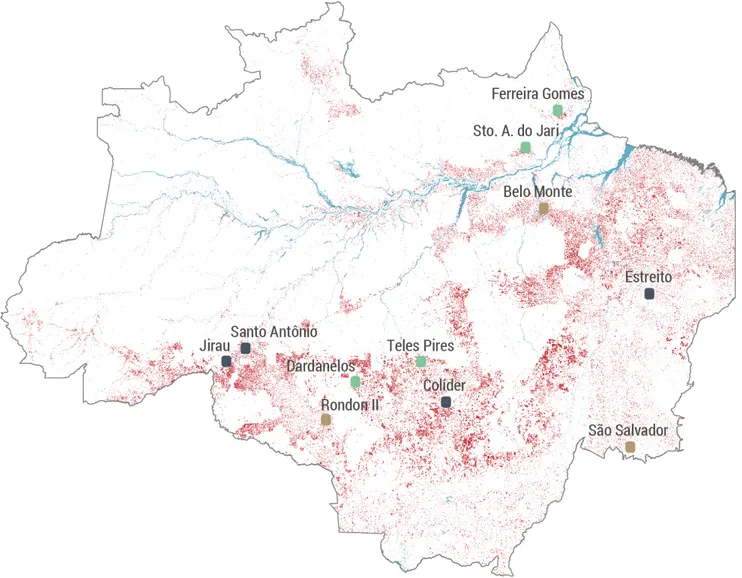
Figure 2: Studied HPPs: geographic location and effects
This figure shows the map of the Brazilian Amazon with the eleven new HPP constructed between 2003 and 2011. The figure also shows the accumulated deforestation between 2001 and 2014, in red.
-.01 0 .01 .02 .03 .04 0 10 20 30 40 50 60 70 80 90 100 Distance to HPP (km)
Annual Deforestation Rate After Construction
Figure 3: Distance to HPP and effect on Deforestation
This figure shows results from the difference-in-difference exercise at the pixel level. It plots the estimates of
0 1 2 3 0 1 2 3 0 1 2 3 -5 0 5 -5 0 5 -5 0 5 -5 0 5
Santo Antônio Do Jari Rondon II São Salvador Estreito
Dardanelos Santo Antônio Jirau Belo Monte - Barragem
Ferreira Gomes Colider Teles Pires
Affected Area Synthetic Control Legend
Deforestation (% of area)
Years since HPP construction
0 1 2 3 4 0 1 2 3 4 0 1 2 3 4 -5 0 5 -5 0 5 -5 0 5 -5 0 5
Santo Antônio Do Jari Rondon II São Salvador Estreito
Dardanelos Santo Antônio Jirau Belo Monte - Barragem
Ferreira Gomes Colider Teles Pires
Affected Area Synthetic Control Legend
Deforestation (% of area)
Years since HPP construction
0 1 2 3 0 1 2 3 0 1 2 3 -5 0 5 -5 0 5 -5 0 5 -5 0 5
Santo Antônio Do Jari Rondon II São Salvador Estreito
Dardanelos Santo Antônio Jirau Belo Monte - Barragem
Ferreira Gomes Colider Teles Pires
Affected Area Synthetic Control Legend
Deforestation (% of area)
Years since HPP construction
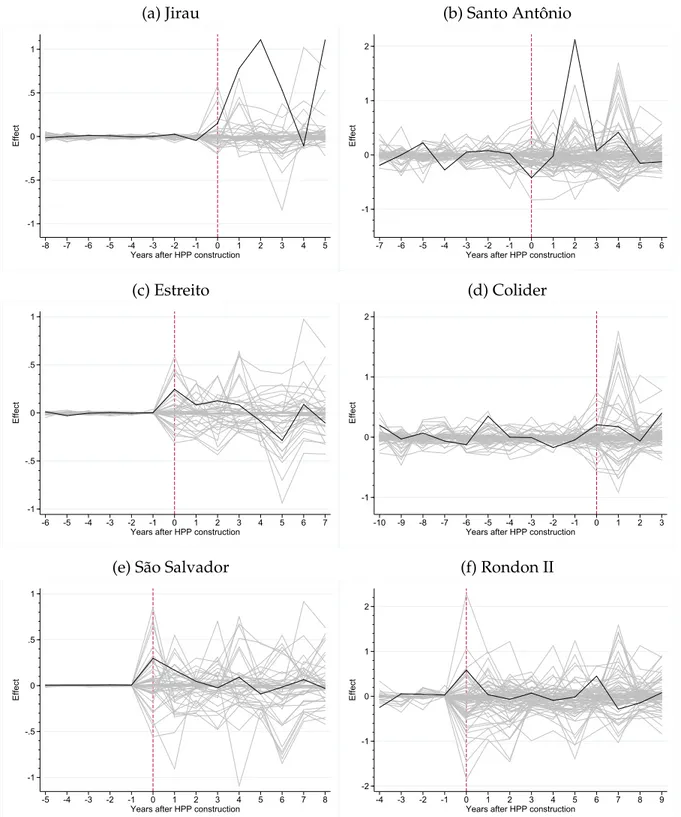
(a) Jirau -1 -.5 0 .5 1 Effect -7 -6 -5 -4 -3 -2 -1 0 1 2 3 4 Years after HPP construction
(b) Santo Antônio -2 -1 0 1 2 Effect -6 -5 -4 -3 -2 -1 0 1 2 3 4 5 Years after HPP construction
(c) Estreito -1 -.5 0 .5 Effect -5 -4 -3 -2 -1 0 1 2 3 4 5 6 Years after HPP construction
(d) Colider -1 -.5 0 .5 1 Effect -9 -8 -7 -6 -5 -4 -3 -2 -1 0 1 2 Years after HPP construction
(e) São Salvador
-1 -.5 0 .5 1 Effect -4 -3 -2 -1 0 1 2 3 4 5 6 7 Years after HPP construction
(f) Rondon II -2 -1 0 1 2 Effect -3 -2 -1 0 1 2 3 4 5 6 7 8 Years after HPP construction
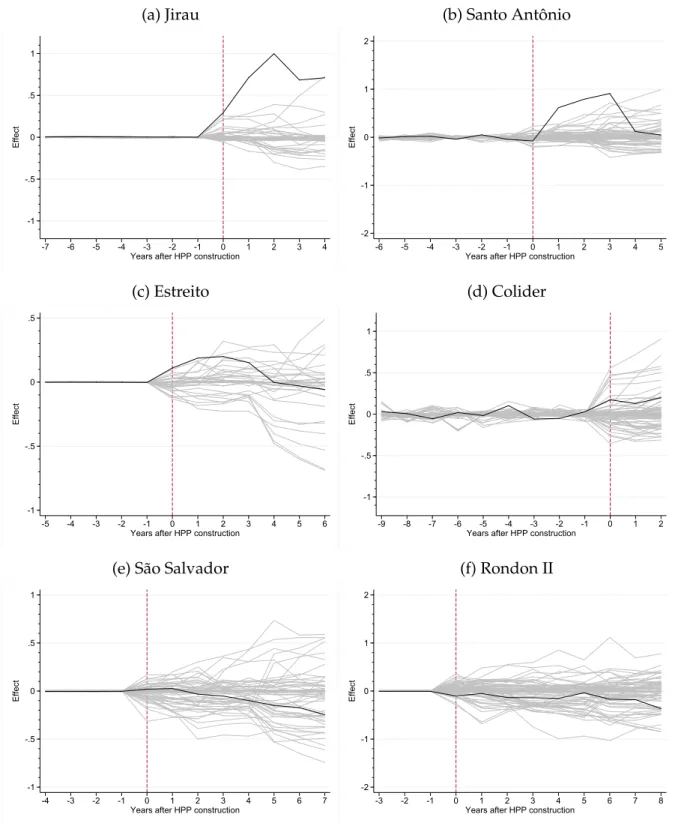
Figure 7: Deforestation Gaps in the treated buffer and placebo gaps in control buffers
We discard buffers with pre-treatment RMSPE two times higher than treated unit’s RMSPE. Number of non-discarded placebos by UHE: Jirau (42), Santo Antônio (69), Estreito (34), Colider (74), São Salvador (55), and Rondon II (75).
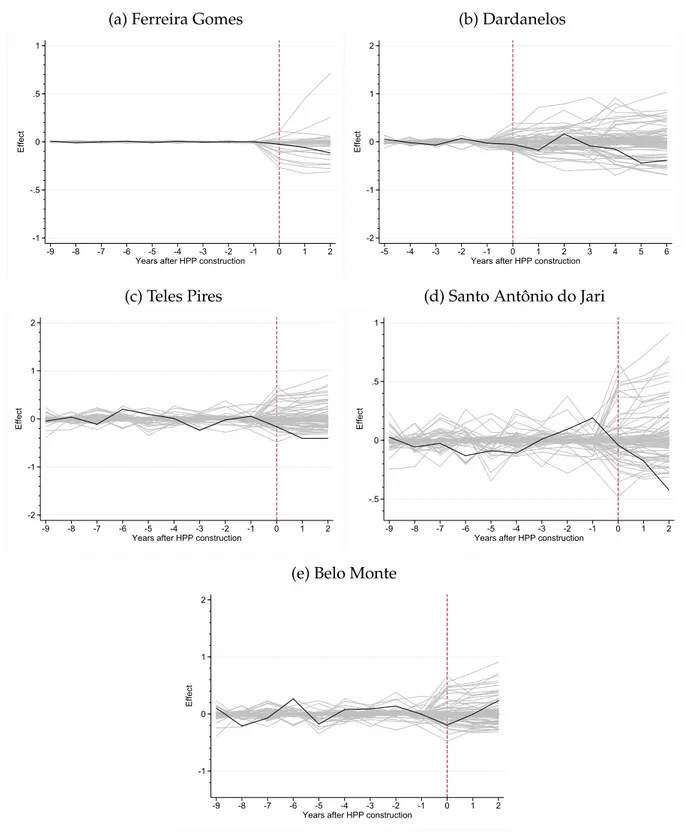
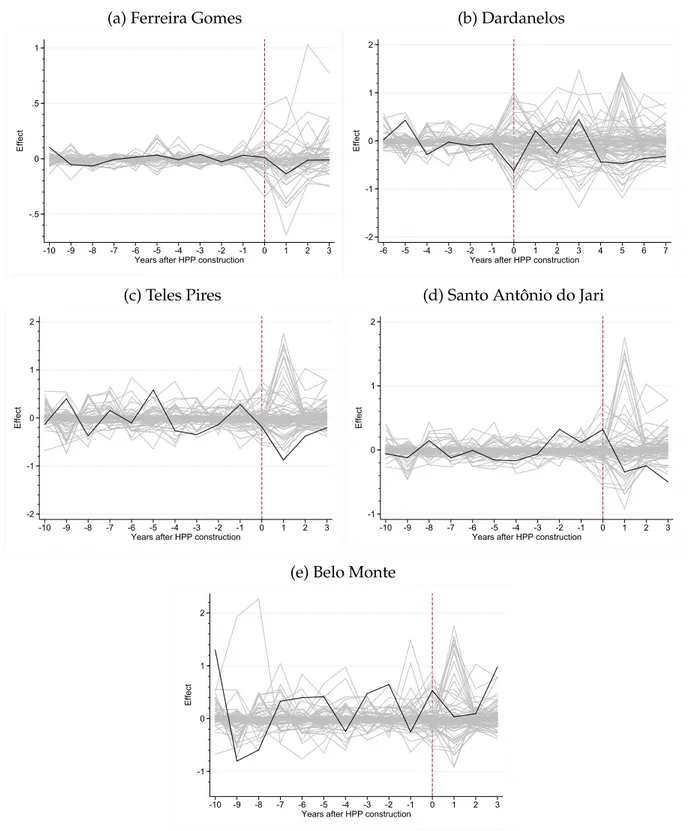
(a) Ferreira Gomes -1 -.5 0 .5 1 Effect -9 -8 -7 -6 -5 -4 -3 -2 -1 0 1 2 Years after HPP construction
(b) Dardanelos -2 -1 0 1 2 Effect -5 -4 -3 -2 -1 0 1 2 3 4 5 6 Years after HPP construction
(c) Teles Pires -2 -1 0 1 2 Effect -9 -8 -7 -6 -5 -4 -3 -2 -1 0 1 2 Years after HPP construction
(d) Santo Antônio do Jari
-.5 0 .5 1 Effect -9 -8 -7 -6 -5 -4 -3 -2 -1 0 1 2 Years after HPP construction
(e) Belo Monte
-1 0 1 2 Effect -9 -8 -7 -6 -5 -4 -3 -2 -1 0 1 2 Years after HPP construction
Figure 8: Deforestation Gaps in the treated buffer and placebo gaps in control buffers
We discard buffers with pre-treatment RMSPE two times higher than treated unit’s RMSPE. Number of non-discarded placebos by UHE: Ferreira Gomes (34), Dardanelos (80), Teles Pires (86), Santo Antônio do Jari (85), Belo Monte (86).
List of new hydroeletric power plants built in the Amazon HPP Year Construction Started Investment (Million R$) Capacity (MW) Capacity (MWm) Reservoir (km2) Direct Employment Belo Monte 2011 28, 869 11, 233 4, 571 516 28, 000 Colider 2011 1, 917 300 180 172 2, 500 Dardanelos 2007 754 261 155 0.2 1, 200 Estreito 2007 4, 940 1, 087 585 555 11, 488 Ferreira Gomes 2011 939 252 150 18 2, 500 Jirau 2009 15, 702 3, 750 2, 185 258 23, 614 Santo Antônio 2008 19, 358 3, 569 2, 425 293 18, 400 Santo Antonio Do Jari 2011 1, 098 373 218 32 2, 089
Sao Salvador 2006 848 243 149 104 1, 600
Teles Pires 2011 3, 736 1, 820 931 135 7, 073
Rondon II 2005 −− 74 −− 84 −−
This table lists the set of hydroeletric power plants in the Legal Amazon that started construction between 2005 and 2011.
Average forest cover and deforestation rates by year
Within 15km of HPP Between 15km and 50km of HPP
(1) (2) (3) (4)
Donor Pool Treated Units Donor Pool Treated Units Forest cover in 2000 72.99 72.32 71.38 78.10 Deforestation in ... 2002 0.48 0.98 0.61 1.04 2003 0.57 1.21 0.78 1.33 2004 0.55 1.26 0.75 1.35 2005 0.52 1.26 0.66 1.33 2006 0.39 0.98 0.48 1.01 2007 0.39 0.89 0.43 0.81 2008 0.34 0.83 0.39 0.66 2009 0.32 0.94 0.37 0.78 2010 0.27 0.92 0.32 0.79 2011 0.39 0.90 0.42 0.89 2012 0.35 0.69 0.40 0.66 2013 0.41 0.92 0.47 0.71 2014 0.34 1.14 0.40 0.69 Number of HPPs 88 11 88 11
Notes: The table shows averages of forest cover in 2000 and deforestation rates around suitable points for hydropower plants (HPPs), by year. Columns 1 and 2 show averages for 15-kilometer circles around untreated and treated points, respectively. Columns 3 and 4 show averges for areas between 15 and 50 kilometers of untreated and treated points, respectively. Forest cover and deforestation are constructed from the Global Forest Cover data version 1.3 (seeHansen et al.,2013). Forest cover in year 2000 is measured as the percentage of the area with forest cover. Deforestation in each year is measured as the percentage of the area with tree cover loss in a moving average centered in that year. See section3for more details on the definition of variables.
Forest Loss After Construction Begins: Observed vs Synthetic
Deforestation Attributable to HPP
(1) (2) (3) (4)
Observed Synthetic Total Per Year After
Construction Jirau 75.9 38.0 37.8 5.4 Santo Antônio 60.0 41.6 18.4 2.3 Colider 34.0 22.7 11.3 2.3 Estreito 34.8 28.4 6.4 0.7 Ferreira Gomes 26.3 28.2 -1.9 -0.4 Dardanelos 39.5 49.3 -9.8 -1.1
Santo Antonio do Jari 19.1 28.2 -9.1 -1.8
Teles Pires 27.3 34.5 -7.1 -1.4
Belo Monte 54.2 47.2 7.0 1.4
São Salvador 25.3 32.4 -7.1 -0.7
RondonII 63.8 77.3 -13.5 -1.2
Total 460.3 427.8 32.5 5.4
Notes: All figures are measured in 1000 hectares. This table summarizes the main results for 50-kilometer radius around the HPP coordinates. Column 1 shows actual (observed) deforestation after the construction of each HPP begins, using the raw GFW data. Column 2 shows the counterfactual deforestation, as estimated by the synthetic control procedure described in section5.2. Colum 3 shows the difference between columns 1 and 2. Column 4 di-vides the column 3 by the number of years in the post-construction period, to enable more accurate comparisons across HPPs. The synthetic control procedures described in section5.2was applied to data on concentric circles of 15-kilometer radius, and annulli with inner radius of 15-kilometer and outer radius of 50-kilometers. We add the 15-kilometer and the 15-to-50-kilometer results to produce this table. Table ?? shows results applying the method for data on concentric circles of 50-kilometer radius.
Direct and Indirect Effects
Within 15km of HPP Betweem 15km and 50km of HPP
(1) (2) (3) (4) Observed Deforestation Attributable to HPP Observed Deforestation Attributable to HPP Jirau 10.0 7.1 65.9 30.8 Santo Antônio 5.7 3.8 54.3 14.6 Colider 5.3 3.2 28.7 8.0 Estreito 4.0 1.3 30.8 5.0 Ferreira Gomes 2.2 1.1 24.1 -2.9 Dardanelos 2.9 -2.0 36.6 -7.8
Santo Antonio do Jari 2.5 0.7 16.6 -9.7
Teles Pires 4.9 0.7 22.5 -7.8
Belo Monte 7.9 4.5 46.3 2.4
São Salvador 2.1 1.2 23.2 -8.3
RondonII 8.2 1.2 55.6 -14.6
Total 55.8 22.8 404.5 9.7
(a) Jirau 0 1 2 3 -5 0 5
Years since HPP construction
(b) Santo Antônio 0 1 2 3 -5 0 5
Years since HPP construction
(c) Estreito 0 1 2 3 -5 0 5
Years since HPP construction
(d) Colider 0 1 2 3 -6 -4 -2 0 2 4
Years since HPP construction
(e) São Salvador
0 1 2 3
-5 0 5
Years since HPP construction
(f) Rondon II 0 1 2 3 -4 -2 0 2 4 6
Years since HPP construction
Treated Unit — Synthetic Control
-Figure A1: Impact of HPP on deforestation (raw data) by HPP – treated vs synthetic unit
This figure shows the observed annual deforestation of each HPP built and its synthetic counterfactual trend (synthetic control). The gap between the treated unit and its synthetic control counterpart is the estimated treat-ment effect. This exercises usesHansen et al.(2013) raw data, not treated.
(a) Ferreira Gomes 0 1 2 3 -6 -4 -2 0 2 4
Years since HPP construction
(b) Dardanelos 0 1 2 3 -5 0 5
Years since HPP construction
(c) Teles Pires 0 1 2 3 -6 -4 -2 0 2 4
Years since HPP construction
(d) Santo Antônio do Jari
0 1 2 3
-6 -4 -2 0 2 4
Years since HPP construction
(e) Belo Monte
0 1 2 3
-6 -4 -2 0 2 4
Years since HPP construction
Treated Unit — Synthetic Control
-Figure A2: Impact of HPP on deforestation (raw data) by HPP – treated vs synthetic unit
This figure shows the observed annual deforestation of each HPP built and its synthetic counterfactual trend (synthetic control). The gap between the treated unit and its synthetic control counterpart is the estimated treat-ment effect. This exercises usesHansen et al.(2013) raw data, not treated.
(a) Jirau -1 -.5 0 .5 1 Effect -8 -7 -6 -5 -4 -3 -2 -1 0 1 2 3 4 5 Years after HPP construction
(b) Santo Antônio -1 0 1 2 Effect -7 -6 -5 -4 -3 -2 -1 0 1 2 3 4 5 6 Years after HPP construction
(c) Estreito -1 -.5 0 .5 1 Effect -6 -5 -4 -3 -2 -1 0 1 2 3 4 5 6 7 Years after HPP construction
(d) Colider -1 0 1 2 Effect -10 -9 -8 -7 -6 -5 -4 -3 -2 -1 0 1 2 3 Years after HPP construction
(e) São Salvador
-1 -.5 0 .5 1 Effect -5 -4 -3 -2 -1 0 1 2 3 4 5 6 7 8 Years after HPP construction
(f) Rondon II -2 -1 0 1 2 Effect -4 -3 -2 -1 0 1 2 3 4 5 6 7 8 9 Years after HPP construction
Figure A3: Deforestation Gaps (raw data) in the treated buffer and placebo gaps in control buffers
We discard buffers with pre-treatment RMSPE two times higher than treated unit’s RMSPE. Number of non-discarded placebos by UHE: Jirau (42), Santo Antônio (69), Estreito (34), Colider (74), São Salvador (55), and Rondon II (75). This exercises usesHansen et al.(2013) raw data, not treated.
(a) Ferreira Gomes -.5 0 .5 1 Effect -10 -9 -8 -7 -6 -5 -4 -3 -2 -1 0 1 2 3 Years after HPP construction
(b) Dardanelos -2 -1 0 1 2 Effect -6 -5 -4 -3 -2 -1 0 1 2 3 4 5 6 7 Years after HPP construction
(c) Teles Pires -2 -1 0 1 2 Effect -10 -9 -8 -7 -6 -5 -4 -3 -2 -1 0 1 2 3 Years after HPP construction
(d) Santo Antônio do Jari
-1 0 1 2 Effect -10 -9 -8 -7 -6 -5 -4 -3 -2 -1 0 1 2 3 Years after HPP construction
(e) Belo Monte
-1 0 1 2 Effect -10 -9 -8 -7 -6 -5 -4 -3 -2 -1 0 1 2 3 Years after HPP construction
Figure A4: Deforestation Gaps (raw data) in the treated buffer and placebo gaps in control buffers
We discard buffers with pre-treatment RMSPE two times higher than treated unit’s RMSPE. Number of non-discarded placebos by UHE: Ferreira Gomes (34), Dardanelos (80), Teles Pires (86), Santo Antônio do Jari (85), Belo Monte (86). This exercises usesHansen et al.(2013) raw data, not treated.