Ciências da Saúde
Strategies for reducing the allergenic capacity of
ovalbumin using phenolic compounds
Ana Sofia Augusto Soares
Dissertação para obtenção do Grau de Mestre em
Ciências Biomédicas
(2º ciclo de estudos)
Orientador: Prof. Doutor António José Geraldes de Mendonça
Coorientador: Prof. Doutora Cândida Ascensão Teixeira Tomaz
iii
Dedication
iv
Acknowledgements
Ao meu orientador, Professor Doutor António Mendonça, um profundo agradecimento por toda a orientação, dedicação, paciência e motivação constante que para comigo demonstrou ao longo do desenvolvimento deste trabalho. Para além de toda a partilha de conhecimentos, a sua total presença e disponibilidade. E para o resto da vida levarei: “Para fazer ciência é preciso paciência!”.
À minha coorientadora, Professora Doutora Cândida Tomaz, pelo seu espírito crítico, pela sua boa disposição contagiante, assim como as valiosas sugestões que contribuíram para um melhor desenvolvimento deste trabalho.
À minha família, em especial aos meus pais, por todo o amor, carinho e compreensão que sempre me deram. Sem eles nunca conseguiria ter chegado onde cheguei. Aos meus dois manos chatos, Fábio e Carlitos, pela cumplicidade, pelo incentivo e porque estão sempre quando preciso de alguém. Ao meu ‘dearest cousin and english gramar supervisor’, Ricardo Matos, um muito obrigada. A tua ajuda e dicas foram preciosas. E à restante família por toda a preocupação.
Ao meu boy, Rui Miguel, pelo seu amor, cumplicidade, companheirismo, confiança, incentivo e por me aturar nos dias bons e menos bons. Sem ele a Covilhã não era a mesma coisa. És o que eu sempre desejei para mim.
À minha Super Cate, amiga de faculdade mas que é para toda a vida. Pela sua amizade sincera, cumplicidade, apoio constante e alegria contagiante. Os nossos momentos foram únicos.
Aos #9 por terem sido a minha família nesta Cidade Neve, por todas as aventuras e por terem tornado esta importante fase da minha vida muito mais fácil e cheia de magia.
A todos os restantes amigos e colegas, pelos bons momentos da vida e do espírito académico, contribuindo igualmente para todas as boas memórias que levo da Covilhã.
vi
Resumo Alargado
As alergias alimentares, um problema de saúde pública, são causadas por respostas imunológicas anormais a componentes dos alimentos (alergénios), nomeadamente proteínas. As alergias mais comuns são as mediadas por imunoglobulinas E (IgE), denominadas tipo I, e caraterizam-se por reações de hipersensibilidade que podem ocorrer entre menos de um minuto ou várias horas após a ingestão do alimento que contém o(s) alergénio(s). A alergia ao ovo, mediada por IgE, é uma das formas mais frequentes de alergia alimentar em crianças, sendo a maioria reativa à clara do ovo. A ovalbumina (OVA) é a principal proteína da clara do ovo e apresenta uma elevada percentagem de reações alérgicas.
A indústria tem procurado aplicar métodos e técnicas para diminuir a alergenicidade dos ovos, contudo, como em geral os alergénios possuem propriedades que lhes conferem estabilidade e resistência, tal tarefa não tem sido bem sucedida. Os compostos fenólicos, existentes na fruta e vegetais, ligam-se a péptidos e proteínas podendo promover alteração da sua conformação nativa e, deste modo, alterar a sua alergenicidade.
Assim, este trabalho teve como objetivo estudar os efeitos dos compostos fenólicos na estrutura nativa da OVA, utilizando técnicas de dicroísmo circular e de fluorescência. Para tal, tratou-se a OVA com diferentes compostos fenólicos (Ácidos Gálico, Cafeico, Ferúlico, Clorogénico e Tânico, Resveratrol e Quercetina) e estudaram-se as alterações ocorridas na sua estrutura secundária e terciária, os tipos de interações envolvidas, bem como a formação de complexos entre a OVA e os compostos fenólicos em estudo.
Os resultados obtidos a partir do cálculo de Kb, ΔH e ΔS evidenciaram a formação de complexo entre cada composto fenólico e a OVA, sendo as interações hidrofóbicas o principal tipo de interação envolvida. As alterações na estrutura terciária foram verificadas ao nível dos resíduos de triptofano com todos os compostos fenólicos, exceto com o Ácido Gálico e Quercetina onde não foram evidentes. Quanto à estrutura secundária, observaram-se alterações significativas com os Ácidos Gálico, Cafeico e Tânico. Estas alterações verificadas na conformação nativa, após tratamento da OVA, poderão eventualmente promover a redução da sua alergenicidade. Através dos resultados também podem ser sugeridos os ácidos Gálico e Tânico como potenciais promotores da redução da alergenicidade, visto que foram os únicos que promoveram alterações (diminuição) no conteúdo de folha-β e voltas-β, onde é estimado estarem as principais zonas alergénicas (epítopos) da OVA.
Por conseguinte, este estudo poderá ser um bom indicador na aplicação de compostos fenólicos para promover alterações na alergenicidade do ovo, bem como o potenciamento de um novo método para produção de ovos hipoalergénicos. Para tal, propõe-se como perspetiva
vii futura deste trabalho, um estudo para testar a diminuição da alergenicidade do ovo completo com compostos fenólicos, através de ensaios imunoenzimáticos utilizando soro de doentes alérgicos ao ovo.
Palavras-chave
ix
Abstract
Egg allergy, is an IgE mediated reaction and is one the most common food allergies, mainly in infants and young children. Eggs present allergens both in the egg white and yolk, but most of the allergenic proteins are found in egg white where ovalbumin (OVA) is the main protein and one the main allergens identified. The industry has sought to implement methods and techniques for reducing the allergenicity, however, this task has not been successful. Phenolic compounds bind to peptides and proteins and can promote alteration of their native conformation and thereby alter its allergenicity.
Thus, this work aimed to study the effect of phenolic compounds on the native structure of OVA, using circular dichroism and fluorescence techniques. OVA was treated with different phenolic compounds (Gallic, Caffeic, Ferulic, Chlorogenic and Tannic Acids, Resveratrol and Quercetin) and the changes in their secondary and tertiary structure were studied as well as, the type of interactions involved through the calculation of the thermodynamic parameters, and complex formation between the OVA and phenolic compounds under study. Also, the Kb was evaluated.
The results indicated that all tested phenolic compounds bind to OVA and the hydrophobic interactions are the main kind of interaction involved. The structure of OVA is affected by the binding with phenolic compounds, mainly with Gallic and Tannic Acid, at the level of β-sheet and β-turns content. Thus, these phenolic compounds are likely to affect epitopes of OVA and hence its allergenicity.
This study is a good indicator that the application of phenolic compounds can promote changes in egg proteins which may influence egg allergenicity.
Keywords
x
Scientific communications resulting from this
work
Poster entitled “Circular dichroism studies on the interaction of bovine serum albumin with phenolic compounds”, on 4º Ciclo de Conferências da Faculdade de Ciências: “Ciência: Fazer, Comunicar e Ensinar”. University of Beira Interior. Covilhã, 2015. Poster entitled “Studies on the interactions of ovalbumin with phenolic compounds”,
on 6th European Conference Chemistry in the Life Sciences. Lisboa, 2015.
Oral presentation entitled “Ovalbumin and phenolic compounds: interaction studies”, on X Annual CICS-UBI Symposium 2015. University of Beira Interior. Covilhã, 2015.
xii
Contents
Chapter 1 - Introduction 1
1.1 Food Allergy 1
1.2 Egg 3
1.3 Allergy reduction methods 6
1.4 Phenolic Compounds 8
1.5 Interactions between Proteins and Phenolic Compounds 10
1.6 Spectroscopic techniques 11
1.7 Objectives of the study 13
Chapter 2 - Materials and Methods 14
2.1 Materials 14
2.2 Fluorescence 14
2.3 Circular Dichroism 14
2.4 Descriptive Analysis 15
Chapter 3 - Results and Discussion 16
3.1 Fluorescence quenching 16
3.2 Binding data analysis 22
3.3 Thermodynamic analysis of binding mode 23
3.4 Changes in the secondary structure 25
Chapter 4 - Conclusions and Future Perspectives 28
Chapter 5 - References 29
Attachments 35
Annex 1: Stern-Volmer and Lineweaver-Burk plots 35
Annex 2: Van’t Hoff plots 41
xiii
List of Figures
Figure 1 - Exemplification of conformational and sequential epitopes. 2
Figure 2 - Crystal structure of OVA from the Protein Data Bank. 5
Figure 3 – Structure of the used phenolic compounds. 10
Figure 4 - Fluorescence spectra of OVA in the presence of concentration of GA. 16
Figure 5 - Fluorescence spectra of OVA in the presence of concentration of GA. 17
Figure 6 - Fluorescence spectra of OVA in the presence of concentration of GA. 18
Figure 7 - Fluorescence spectra of OVA in the presence of concentration of GA. 18
Figure 8 - Fluorescence spectra of OVA in the presence of concentration of GA. 19
Figure 9 - Fluorescence spectra of OVA in the presence of concentration of GA. 20
Figure 10 - Fluorescence spectra of OVA in the presence of concentration of GA. 20
Figure 11 - Stern-Volmer plot for the quenching of RES by OVA at 310K. 22
Figure 12 - CD spectrum of OVA at 298K. 26
Figure 13 - Stern-Volmer plots for the quenching of OVA by GA in different
temperatures.
35
Figure 14 - Lineweaver-Burk plot for the binding of GA to OVA at different
temperatures.
35
Figure 15 - Stern-Volmer plots for the quenching of OVA by CA in different
temperatures.
36
Figure 16 - Lineweaver-Burk plot for the binding of CA to OVA at different
temperatures.
36
Figure 17 - Stern-Volmer plots for the quenching of OVA by FA in different
temperatures.
37
Figure 18 - Lineweaver-Burk plot for the binding of FA to OVA at different
temperatures.
37
Figure 19 - Stern-Volmer plots for the quenching of OVA by CHA in different
temperatures.
38
Figure 20 - Lineweaver-Burk plot for the binding of CHA to OVA at different
temperatures.
38
Figure 21 - Stern-Volmer plots for the quenching of OVA by RES in different
temperatures.
39
Figure 22 - Lineweaver-Burk plot for the binding of RES to OVA at different
temperatures.
39
Figure 23 - Stern-Volmer plots for the quenching of OVA by QCT in different
temperatures.
40
Figure 24 - Lineweaver-Burk plot for the binding of QCT to OVA at different
temperatures.
xiv
Figure 25 - Stern-Volmer plots for the quenching of OVA by TA in different
temperatures.
41
Figure 26 - Lineweaver-Burk plot for the binding of TA to OVA at different
temperatures.
41
Figure 27 - Van’t Hoff plot of GA-OVA complex. 42
Figure 28 - Van’t Hoff plot of CA-OVA complex. 42
Figure 29 - Van’t Hoff plot of FA-OVA complex. 42
Figure 30 - Van’t Hoff plot of CHA-OVA complex. 43
Figure 31 - Van’t Hoff plot of RES-OVA complex. 43
Figure 32 - Van’t Hoff plot of QCT-OVA complex. 43
Figure 33 - Van’t Hoff plot of TA-OVA complex. 44
Figure 34 - CD spectra of OVA and OVA with GA. 45
Figure 35 - CD spectra of OVA and OVA with CA. 45
Figure 36 - CD spectra of OVA and OVA with FA. 45
Figure 37 - CD spectra of OVA and OVA with CHA. 46
Figure 38 - CD spectra of OVA and OVA with RES. 46
Figure 39 - CD spectra of OVA and OVA with QCT. 46
xv
List of Tables
Table 1 – The quenching constants and binding constants between OVA and
phenolic compounds at different temperatures.
21
Table 2 – The thermodynamic parameters of OVA-phenolic compounds interaction
at different temperatures.
24
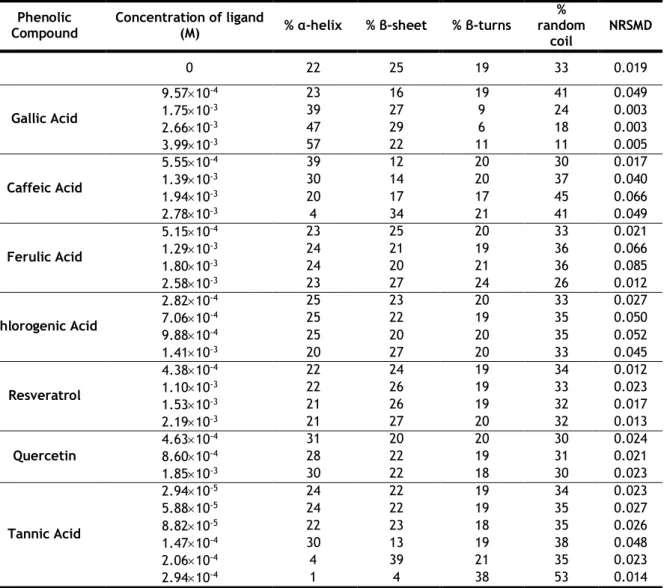
Table 3 – The secondary structure content of OVA upon interaction with phenolic
compounds.
xvi
List of Acronyms
AD Atopic Dermatitis CA Caffeic Acid CD Circular Dichroism CHA Chlorogenic Acid
Cys Cysteine
DEW Dehydrated Egg White FA Ferulic Acid
FAO Food and Agriculture Organization GA Gallic Acid
Gal d 5 α-livetin Gal d 6 YGP42
HDLs High Density Lipoproteins HHP High Hydrostatic Pressure HSA Human Serum Albumin IgE Immunoglobulin E LDLs Low Density Lipoproteins LYS / Gal d 4 Lysozyme
MR Maillard Reaction
NRMSD Normalized Root Mean Square OVA / Gal d 2 Ovalbumin
OVM / Gal d 1 Ovomucoid OVT / Gal d 3 Ovotransferrin Phe Phenylalanine pI Isoelectric Point QCT Quercetin RES Resveratrol REW Raw Egg White SPT Skin Prick Test TG Transglutaminase
Trp Tryptophan
Tyr Tyrosine
1
Chapter 1
Introduction
Adequate nutrition is one of the pillars of public health. Feeding is very closely linked to human survival and people’s physical and mental health. An inadequate intake of food may result in impaired immunity and development, among others, but excessive food intake is also not healthy. What is necessary is a correct food management [1].
Food allergies are a unique health problem, because there are no pharmaceutical interventions to prevent allergic reactions, except avoid the food source, leading to a restricted diet [2]. This can have a major impact on nutrient intake and compromise the public health [3].
1.1 Food Allergy
Food allergy, a worldwide health problem, affects as many as 6% of young children and 3% to 4% of adults [4,5]. It is caused by adverse immunological responses to certain food components that are typically proteins [5]. The reactions can be immunoglobulin E (IgE)-mediated and non-IgE-(IgE)-mediated [6].
IgE-mediated reactions, also known as immediate hypersensitivity reactions, are considered as Type I allergy [5]. This kind of allergy is the most common and dangerous type since its symptoms may involve the skin, gastrointestinal tract and respiratory tract and appear in less than a minute to a few hours after the ingestion of the offending foods [4,5]. IgE is one of the classes of antibodies present in the human body and although all humans have low levels of IgE, individuals predisposed to the development of allergies produce high levels of this immunoglobulin that are specific for recognize allergenic epitopes, a localized region on the surface of an allergen [7].
The gastrointestinal tract’s main function is to process ingested food into a form that can be absorbed and used for energy and growth, while at the same time preventing the penetration of harmful pathogens into the body. For this purpose, it contains physiologic and immunologic components [8]. When the allergen is consumed and enters the body, it occurs sensitization, which results in production of allergen-specific IgE-antibodies. Then it binds to receptors on mast cells and basophils so that, in case of re-exposure to the food, the allergens cross-link the cell bound specific IgE, triggering the release of symptom causing mediators [7].
There are several diagnostic methods for determination of food allergies, but the most frequently used are: skin prick test (SPT) and the determination of food-specific IgE
2 antibodies. The results of SPT are read 20 minutes after the test and it is sensitive and specific. The determination of food-specific IgE antibodies is based on increase of concentrations of food-specific IgE and it is correlate with an increase likelihood of a clinical reaction. This test is very sensitive and requires only a small amount (4-5 µL) of serum [4,5].
1.1.1 Food Allergens
Although any food can provoke a reaction, relatively few foods are responsible for the vast majority of significant food-induced allergic reactions [4]. The most common food allergens are contained in eight kinds of food: milk, egg, fish, peanut, soybeans, seafood, wheat and tree nuts. They are responsible for the majority of food allergic reactions throughout the world, as reported by the Food and Agriculture Organization (FAO) and the World Health Organization (WHO) [9].
The reason why some proteins are allergenic and others are not remains poorly understood. However, certain properties are considered common in allergens: water soluble glycoproteins with a molecular weight of 10-70 kDa, stable to changes in heat, pH and digestion and an acid isoelectric point (pI) [5].
The specific profiles of epitopes are also important to distinguish the persistence of allergenicity, because they can be sequential or conformational (Figure 1) [10]. Sequential epitopes comprise consecutive amino acids along the protein backbone, whereas conformational epitopes contain amino acids from different regions of the protein that are in close proximity due to the folding of the protein [11]. IgE antibody binding to conformational epitopes is associated with transient allergy, while binding to sequential epitopes is a marker for persistent allergy [10]. [12]
3
1.2 Egg
Hen’s egg (Gallus domesticus) is a versatile ingredient used in the gastronomy of many cultures, including a wide range of manufactured food products [10,13]. In addition to its use in the food area, medications and vaccines may have ingredients derived from egg. For example, influenza vaccines are derived from the extra embryonic fluid of chicken embryos inoculated with specific types of influenza virus [10].
Egg is considered the best source of proteins, lipids, vitamins and minerals, consisting of three main components: eggshell (9-12% weight/weight of the egg content ), yolk (30-33% weight/weight of the egg content) and egg white (60% weight/weight of the egg content) [13]; these last two are distinct fractions separated by the vitelline membrane [14]. The presence of this membrane is useful in the separation of two fractions, either manually or industrially. However, due to the high adhesion of egg white to the vitelline membrane, complete separation is only possible for the preparations of egg white yolk-free. In prepared commercial liquid yolk there is always 15-20% egg white [14].
The composition of egg yolk have as main constituent the lipids (65-70%) and proteins (30%), consisting of proteins in solution as livetins, lipoprotein particles including high-density lipoproteins (HDLs), and low-density lipoproteins (LDLs), and phosvitin [15,16]. Yolk is considered one source of active principles with application in medical, pharmaceutical cosmetic and biotechnological industries [16].
Egg white can be considered as an aqueous solution of proteins of globular nature and one sulfated glycoprotein, the ovomucin [14]. The main proteins are ovalbumin (OVA) (54% weight/weight of protein content), ovotransferrin (OVT) (12% weight/weight of protein content), ovomucoid (OVM) (11% weight/weight of protein content), lysozyme (LYS) (3.5% weight/weight of protein content) and ovomucin (3.5% weight/weight of protein content) [13,17]. These proteins are associated to diverse biological properties, such as antimicrobial activity; protease inhibitors; immunomodulatory, anticancer, and antihypertensive activities, just like nutrients supplement [13,18].
1.2.1 Egg Allergy
Egg allergy, an IgE mediated reaction, is one the most common food allergies, mainly in infants and young children [19], where the prevalence was estimated to be between 0.5 and 2.5% [20]. The egg allergy is generally considered to have a good prognosis. Two-third of allergic children outgrow their allergy by the 5th year of age [21]. However, there is data suggesting that this does not happen so soon, but over time [22]. Furthermore, no exposure to the egg, as well as its intake has no differences in the reduction of the prevalence in allergic infants [23].
4 Several reactions are associated with egg allergy and the most common is atopic dermatitis (AD). More than 80% of infants with egg allergy suffer from AD. The risk for development of asthma is also increased in egg allergic children [24]. Egg allergy is also important in the decision of which childhood vaccines are safe to administer [22] because the vaccines typically contain measurable quantities of egg white protein [10] and anaphylaxis cases has been reported after administration of influenza vaccine [25].
Eggs present allergens both in the egg white and yolk, but most of the allergenic egg proteins are found in egg white [10], which can justify the two-thirds of children more reactive to egg white [5]. The main allergens identified are designated Gal d 1-5 and includes OVM (Gal d 1), OVA (Gal d 2), OVT (Gal d 3), LYS (Gal d 4) and α-livetin (Gal d 5) [10]. However, a new allergen has been identified, YGP42 (Gal d 6), a yolk glycoprotein [26].
There is no clear consensus about the relative allergenicity of each egg white protein. In studies of human subjects utilizing serum IgE tests, Aabin et al have reported OVT and OVM as the dominant allergens and then OVA and LYS [27]. However, Urisu et al have reported the order of allergenicity as OVM >OVA >OVT >LYS [28], which are in accordance with the results achieved by Bernisel-Broadbent et al [29]. Walsh et al showed that OVM, OVA and OVT are indeed important allergens for many individuals [30], just as, Jarvinem et al demonstrated that children with persistent egg allergy had significantly higher levels of serum IgE antibodies to OVM and OVA than those with transient egg allergy and that IgE are more directed at sequential than to conformational epitopes [31]. This proves the association made between epitopes and the persistence of allergy. The different results can be explained by the diversity of groups in the studies and the purity of allergens used [27,31], but also by genetic predisposition to produce IgE antibodies to one group of egg proteins or another, i.e., the sensitization to egg allergens depends on the patients and not exactly of the allergens [30]. Nevertheless, by the reported studies, it is possible to conclude that there is a greater genetic predisposition and an increased risk of allergy to OVM and OVA.
The diagnosis is done as previously mentioned and, for egg allergy, a strongly positive SPT wheal > 7 mm was found to be strongly predictive of adverse reaction on formal food challenge and a wheal < 3 mm is useful in excluding egg allergy [25]. The IgE levels depend on the kit used, but normally, when egg-specific IgE antibody levels are of 7kUA/L or greater the probability of having egg allergy is ≥ 95% [10,25].
Currently, the mainstay of treatment for food allergy is strict or minimal avoidance of the offending food. This places a burden on food allergic patients and their parents, if they are children, like in the case of egg allergies [32]. Allen et al conclude that despite the high rate of reported strict avoidance of egg in all forms for children, nearly half of the cohort had at least one accidental exposure to egg underlying just how difficult the total avoidance of food
5 allergens as ubiquitous as egg can be [23]. The dietary avoidance of egg can thus be challenging and can pose significant quality of life concerns [10].
1.2.2 Ovalbumin
OVA (Figure 2) is a glycoprotein with a relative molecular mass of 45 000 Da and comprising 385 amino acids [33]. Native ovalbumin possesses a typical serine protease inhibitor (serpin) fold with a three-turn α-helical reactive centre loop [33] and its structure is also homologous with the serpin superfamily, a group of protease inhibitors found in all eukaryote organisms. However, OVA does not exert any protease inhibitory activity. Besides its role as a major source of amino acid, no biological function has yet been attributed [34].
Half of OVA amino acids residues are hydrophobic and one third are charged, for the most part acidic, giving to the molecule a pI of 4.5. Its sequence includes six cysteines (Cys) residues with a single disulfide bond between Cys73 and Cys120. Each OVA molecule contains four sulfhydryl groups, three of which are weakly reactive in native protein, whereas the fourth is reactive only in the denatured protein [15]. The N-terminal amino acid is acetylated glycine and the C-terminal is proline [13].
There are several reports that involved the binding of OVA to IgE antibodies to analyze and identify the epitopes recognized by IgE antibodies. Honma et al has identified the C-terminal fragment 347-385 as an allergenic region of OVA and that the epitopes on OVA357-366 are among the ones that were more recognized by the IgE antibodies [35]. Mine et al have determined the IgE-binding epitopes in the primary sequence of OVA and five distinct IgE recognition sites were identified: OVA38-49, OVA95-102, OVA191-200, OVA243-248 and OVA251-260. Four of the five epitopes are exposed to the protein surface in the three dimensional structure except epitope OVA191-200. The OVA38-49 is part of a pair of α-helix and β-turn; OVA 95-102 is composed of a single α-helix; OVA191-200 is made up of β-sheet plus random, OVA243-248 of β-turn and OVA251-260 of β-sheet plus β-turn. These results
6 indicate that major structural component of IgE epitopes in OVA are β-sheet and β-turn structures [36].Beside this, they classified the amino acids of the epitopes as hydrophobic, polar or charged. For a total of 46 amino acids in all of the sequential IgE epitopes, hydrophobic residues were found to be the most frequently occurring (25), followed by polar residues (11) and then charged residues (10) [36]. In a recent study, a high IgE binding corresponded to the regions OVA125−134, OVA135−144, OVA141−154, OVA159−172, OVA164−176, OVA188−198, OVA326−336, but the C-fragment OVA370-385 had the highest IgE binding [37].
1.3 Allergy reduction methods
Many methods have been applied in an attempt to produce hypoallergenic foods. Foods and food ingredients are often subjected to a variety of processing conditions, which may affect the integrity of the allergenic proteins by changing protein conformation and this will affect IgE binding to the epitopes. These changes can lead to epitope destruction, modification, generation (neoallergen formation), masking, or unmasking, thereby, decreasing, increasing or having no effect on allergenicity [38].
The most used processing methods are the heat treatment, Maillard reaction (MR), high hydrostatic pressure (HHP), food irradiation and enzymatic crosslinking [39].
Heat treatment of food proteins may produce different modifications, including denaturation, hydrolysis of peptide bonds, aggregation by non-covalent and disulfide bonds and reactions with other food molecules [39]. The effect of heat treatment on egg has been largely studied. Escudero et al have compared the allergenicity between dehydrated egg white (DEW) and raw egg white (REW). DEW has undergone two thermal processes: pasteurization and drying. The double heat treatments did not affect the allergenicity of its proteins or its capacity to bind IgE, but removes the risk of food poisoning [40]. On the other hand, Bloom et al also explored the effects of heating on egg proteins and they observed the IgE antibody binding was strongest to the REW and decreased gradually with increasing heating time and temperature [41]. The results of these studies were contradictories because the effect of heating on protein allergenicity is modified by duration, temperature and presence of other foods [41]. The MR is a non-enzymatic reaction between amino acids of proteins and non-reducing sugars, which may modify the tertiary structure of the proteins and occurs in foods during heat treatment or after long term storage [39]. Since egg white contain carbohydrates with glucose, it may easily undergo the MR during processing [42]. Ma et al evaluated changes in the antigenicity of OVA after MR in a wet thermal processing system under different concentration of buffer. They found that IgE binding ability of the glycated OVA increased with buffer concentration, so, the antigenicity of the glycated OVA increased possibly by exposing the epitopes initially buried [42].
7 HHP can lead to a partial or complete inactivation of the biological function of the protein depending on pressure, temperature and chemical conditions. The effects have been attributed to changes in non-covalent bonds, such as electrostatic and hydrophobic interactions, which cause different reversible and irreversible changes on the levels of quaternary, tertiary, and secondary structures [39]. Studies demonstrated that OVA loses its tertiary structure above 400 MPa pressure and also its IgE binding may be affected [43]. López-Expósito et al hydrolyzed egg white ovalbumin with pepsin under 400 MPa. All the intact protein was rapidly digested, leading to the production of hydrolysates with lower antigenicity than those produced in hours at atmospheric pressure. Nonetheless, the hydrolysates retained some residual IgE binding properties, as a result of the accumulation of large and hydrophobic peptides during the initial stages of hydrolysis [44].
Food irradiation is a treatment that consists on the exposition of foods to ionizing radiation, usually by high-energy electrons or electromagnetic waves. Protein’s exposure to radiation produces denaturation, due to diverse radicals generated from radiolysis. The radiation may induce fragmentation and aggregation of proteins through strong interactions such as electrostatic or disulfide bonds [39]. Manzocco et al evaluated if UV-C light could be exploited to modify the structure of egg white proteins, which may induce allergenic reactions. The results indicated a decrease in immunoreactivity of egg white proteins and that loss was attributed to denaturation phenomena [45].
Enzymatic crosslinking of proteins is currently exploited in the food industry as means to stabilize food structure. It is based on the enzyme transglutaminase (TG), being able to form an isopeptide bond between glutamine and lysine residues of proteins [39]. Research on the effect of enzymatic crosslinking on allergenicity of food proteins is very limited, but in a recent study Ma et al assessed the allergenicity potential of polymerized allergens by crosslink OVA and egg white with TG under high pressure. The treatment led to the formation of high-molecular weight polymers, but left a substantial amount of monomeric proteins. In OVA caused a slight increase the binding to IgE while for egg white does not modified its IgE-binding [46].
Noteworthy, in a study that allowed the identification of the epitopes and where there was substitution of a single amino acid within of the epitope, it was observed that in some cases it led to the decrease or loss of binding activity and, in a few cases, increased the IgE-binding activity [36].
Based on what has been described above it is possible to verify the difficulty of reducing the allergenicity of food. To date, there is reduction of egg allergy but only partial. This could be explained by the fact that conformational epitopes are typically more susceptible to processing induced destruction than the linear epitopes on the same allergen [38]. So, it is still a challenge the development of hypoallergenic foods. Chung et al studied the reduction
8 of the allergenic capacity of peanut by phenolic compounds and verified that the IgE binding of peanut proteins was reduced as a result of the complexation between both [47].
1.4 Phenolic Compounds
Phenolic compounds are recognized as compounds that bear one hydroxyl group in one or more aromatic rings. Phenol is the unit structure upon which the entire group of compounds is based. The aromatic ring is a benzene. When more than one phenol structural unit is presented we have a polyphenol. The phenolic hydroxyl group is influenced by the presence of the aromatic ring, because the hydrogen of the phenolic hydroxyl is labile, which makes phenols weak acids [48].
They are synthesized as secondary plant metabolites by plants and are widely distributed in the plant kingdom [49], such as foods and drinks, e.g. fruits, vegetables, cereals, olive, coffee, tea and wine [50]. Despite their wide distribution, the health effects of dietary phenolic compounds have received much attention only in the last years. As antioxidants, phenolic compounds may protect cell constituents against oxidative damage and, therefore, limit the risk of various degenerative diseases associated to oxidative stress [50]. But the role of phenolic compounds in the prevention of cardiovascular disease, cancer, osteoporosis, diabetes mellitus and neurodegenerative disease has been also supported by experimental studies [51].
1.4.1 Classification
These compounds can be classified in different ways, but the more complete classification is based on the number of carbons in the molecule. Within these five groups to highlight: 1) the C6 group, comprising simple phenols; 2) the C6Cn group, which includes phenolic acid derivatives and hydroxycinnamic acid derivatives; 3) the C6-Cn-C6 group, which includes stilbenes (C6-C2-C6) and flavonoids (C6-C3-C6); 4) the (C6-C3)n group, consisting of lignans and lignins and 5) the tannins group [48].
1.4.1.1 The C6Cn group
Phenolic acids (C6C1) are characterized by the presence of a carboxyl group substituted on a phenol [48]. An example is the gallic acid (GA) (Figure 3 a)). This phenolic compound is found in very few plants eaten by humans, but tea is an important source of GA: tea leaves may contain up to 4.5 g/kg of GA [50].
The hydroxycinnamic acids (C6C3) consist chiefly of coumaric, caffeic (CA) (Figure 3 b)) and ferulic (FA) (Figure 3 c)) acid, but are commonly found in plants as esters of quinic, shikimic and tartaric acid. The combination between CA and quinic acid form chlorogenic acid (CHA) (Figure 3d)) [48]. CA is the most abundant in most fruits: kiwi contain up to 1g/kg of CA. FA is the most abundant in cereal grains: its content of wheat grain is about 0.8-2g/kg of FA. The
9 CHA is found in many types of fruit and in high concentration in coffee: a cup of coffee may contain up to 350 mg of CHA [50].
1.4.1.2 The C6-Cn-C6 group
Stilbenes are present in low quantities in human diet and the main representative is resveratrol (RES) (Figure 3 e)) [50]. It is a naturally occurring phytoalexin produced by some spermatophytes, such as grapevines, in response to injury or stress conditions. This contributes to a relatively high concentration of RES in numerous types of wine [52].
All flavonoids have the structure C6-C3-C6; two benzene rings are linked together with three-carbon bridge commonly cyclized with oxygen. They may be grouped into subclasses, depending on the degree of unsaturation and degree of oxidation of the three-carbon segment. Flavonols is the most ubiquitous subclass of flavonoids in foods and quercetin (QCT) (Figure 3 f)) is the most representative compound. The main sources of QCT are onions, broccoli and blueberries [48,50].
1.4.1.3 The tannins group
Tannins are a group of compounds with a wide diversity in structure that share their ability to bind and precipitate proteins. They can be presented in the leaves bark, fruits and they protect the plant against infection. Tannins can be divided in three groups: condensed tannins, hydrolysable tannins and complex tannins [48]. Hydrolysable tannins consist of GA and its dimeric condensation product, which is mainly glucose. This group can be further subdivided into gallotannins or ellagitannins. The best-known hydrolysable tannin is tannic acid (TA) (Figure 3 g)), which is a gallotannin consisting of a pentagalloyl glucose molecule that can further esterify with another five GA units [53].
10
1.5 Interactions between Proteins and Phenolic Compounds
Many studies have shown that proteins can bind to phenolic compounds [54]. The ingestion of foods with phenolic compounds causes them to bind to the salivary proteins and lead to the precipitation of an insoluble complex and the perception of astringent flavor [55]. The interactions are mainly non-covalent hydrophobic interactions which may subsequently be stabilized by hydrogen bonding. Non covalent binding interactions comprise hydrophobic-, van der Waals, hydrogen bond- and ionic interactions. They are weaker than covalent binding and are always reversible, however, covalent binding can also occur between proteins and phenolic compounds. They are result of irreversible association between the two, where phenols are transformed into quinones which may react with nucleophilic groups on the protein molecule [56].
Whatever the type of interactions, two types of complexation mechanisms can be distinguished: a monodentate and a multidentate. For the monodentate mechanism, a phenolic compound interacts only with one protein site and a higher concentration of phenolic compound is required. In the multidentate mechanism, a phenolic compound can
11 connect simultaneously to more than one point in the protein or may connect two or more different molecules. It is required a much lower phenolic compound/proteins molar ratio and, thus, a lower concentration of phenolic compound is needed [57].
Protein-phenolic compound interactions are affect by many parameters, such as temperature, pH, types of proteins, protein concentration, types and structures of phenolic compounds, among others [54]. Beyond that, the interactions can also influence protein structure, their functionality and quality [56]. For example, the interaction of CHA and FA with the protein human serum albumin (HSA) includes: the hydrophobic forces between the aromatic ring of phenolic compounds and the hydrophobic amino acid residues; the electrostatic forces between carboxylate group and the basic amino acid residues; and the hydrogen bonding between the hydroxyl groups and the polypeptide chain. These interactions phenolic-protein cause structural change in the protein and has effect on its functional properties [58].
The structure and molecular weight of phenolic compounds play an important role in protein-phenolic compounds interactions, because high molecular weight protein-phenolic compounds (tannins) are able to bond more strongly or preferentially to proteins [59] and tannins can readily combine with SH and amino groups of proteins [54]. Moreover, the order of binding to proteins increase as the number of OH group on the phenolic compound molecule increase [56]. This may be due to the phenolic group be an excellent hydrogen donor that forms hydrogen bonds with the carboxyl group of the protein. For a phenolic compound having an high protein affinity, it must be small enough to penetrate regions of protein molecules, but large enough to crosslink peptide chains at more than one point [54].
1.6 Spectroscopic techniques
Spectroscopic techniques, namely, fluorescence and circular dichroism (CD), are useful to study the interaction of proteins with ligands. The secondary structure of a protein can be monitored by CD, whereas the tertiary structure can be tracked down using fluorescence spectroscopy, in particular intrinsic protein fluorescence [60]. It can provide the binding information and reflect the conformational changes of proteins by binding of ligand [58].
1.6.1 Fluorescence Spectroscopy
Fluorescence is the result of a three-stage (excitation, excited-state lifetime and fluorescence emission) process that occurs in certain molecules called fluorophores [60]. The proteins have three amino acids with of intrinsic fluorescence properties, phenylalanine (Phe), Tyrosine (Tyr) and Tryptophan (Trp). These properties can be studied by fluorescence quenching [60].
There are two mechanism of fluorescence quenching: dynamic or static. The dynamic fluorescence quenching is the deactivation of fluorescence of the fluorophore by collision
12 with the quenching agent (quencher). In static fluorescence quenching there is the formation of non-fluorescent complex, between the fluorophore and the quencher. The Stern-Volmer
equation (1) is employed to distinguish the kind of fluorescence quenching mechanism [60]:
F0/F = 1 + Ksv x [Q] (1)
where F0 and F are the steady-state fluorescence intensities in the absence and presence of the quencher, respectively. KSV is the Stern–Volmer quenching constant and [Q] is the concentration of the quencher. The graphic representation of equation (1) and relation is F0/F versus [Q] [60]. The distinction between the two mechanisms is complicated, because the linear plot is not sufficient to define the quenching type. Hence, the procedure of quenching is further confirmed from the value of biomolecular quenching rate constant, Kq, which is evaluated using equation (2) [61]:
Kq = Ksv/τ0 (2)
where τ0 is the average lifetime of fluorophores without the quencher and the usually used is about 10-8 ns[61].
1.6.2 Circular Dichroism
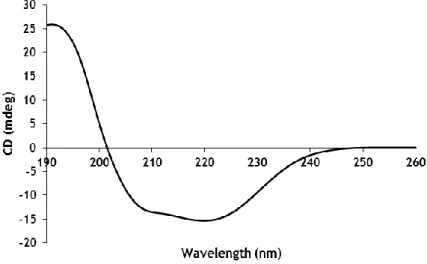
The CD signal is observed in the presence of an asymmetrical or optically active chromophore which is chiral. In proteins, the chromophores of interest for secondary structure are the peptide bond, aromatic amino acid side chains and disulphide bonds. The dominant region for peptide bonds is the far-UV (190-260 nm), where there is quantitative information about secondary structure content. The α-helix, β-sheet, β-turns and random coil have characteristic CD spectra [62].
The α-helix spectrum is due to electronic transitions that occur in the peptide amide bond, namely the intense positive band at 190 nm and a negative band at 208 nm are due to the transition π→π*, while the other negative band located at 222 nm arises from transition n→π*. The β-sheet spectrum is less intense than α-helix spectrum and is characterized by presenting a negative band at around 217 nm due to a transition n→π* and a positive band near 195 nm caused by a transition π→π*. Proteins that have a random structure have a CD spectrum with an intense negative band near 195-200 nm originated by a transition π→π* and a weak positive band caused by a transition n→π*. The β-turns presents a CD spectra quite variable, but usually have a positive band near 205 nm and a negative band in the zone of 190 nm [62].
There are many theoretical protocols and software available such as Dichroweb [63], to evaluate the relative amounts of the different components of secondary structure. Dichroweb web server enables online analysis of CD spectroscopic data, providing calculations of
13 secondary structure content by comparison of calculated structures and experimental data [63]. An additional advantage is that it calculates a standard goodness-of-fit parameter, the normalized root mean square (NRMSD) [64]. This statistical parameter is an important measure of the correspondence between experimental and calculated spectra and can be used to judge the quality of the results. A low NRMSD value (≤0.1) is the most suitable [64].
1.7 Objectives of the study
It is known that the complexation of peanut proteins with phenolic compounds decreases the allergenicity of peanuts by decrease of IgE binding [47]. OVA is one of the main allergenic egg proteins. Thus, it is relevant the study of the interaction of OVA with phenolic compounds for a further study of a possible reduction of their allergenicity. Hereupon and also knowing that the secondary and tertiary structure of food proteins is crucial to their allergenic potential [39], this work aimed to study:
1) The tertiary and secondary structure changes of OVA caused by phenolic compounds (GA; CA; FA; CHA; RES; QCT; and TA);
2) The kinds of interactions that are established and verify if there is complex formation between OVA and phenolic compounds (GA; CA; FA; CHA; RES; QCT; and TA).
14
Chapter 2
Materials and Methods
2.1 Materials
Albumin from chicken egg white (OVA; ≥ 98%, lyophilized powder), Gallic Acid (≥ 98%) Caffeic Acid (≥ 98%), Ferulic Acid (≥ 99%), Chlorogenic Acid (≥ 95%), Resveratrol (≥ 99%), Quercetin (≥ 95%) and Tannic Acid (≥ 95%) were purchased from Sigma-Aldrich (Sintra, Protugal) and used without further purification. MiliQ double distilled water was used in the experiments. The OVA and phenolic compounds solutions were dissolved in 0.05M phosphate buffer (K2HPO4 and KH2PO4), pH 7.4 for the experiments.
2.2 Fluorescence
Fluorescence measurements were made on FluoroMax-4 spectrofluorimeter (Horiba Jobin Yvon – Edison, NJ USA). Experiments were carried out in a 3.5 mL quartz cuvette and the fluorescence emission spectra were recorded in the range of 290-600 nm following an excitation at 280 nm. The excitation and emission bandwidths were both 5 nm. The OVA concentration was fixed at 4.44x10⁻⁶M and the phenolic compounds concentration were varied and after each addition a fluorescent spectrum was recorded immediately. Spectra were corrected for buffer signal and the correspondent concentration of phenolic compound in the solution with OVA. To evaluate the effect of temperature on OVA-phenolic compounds interaction, fluorescence was recorded at two temperatures (298 and 310 K). The instrument was controlled by a NesLABRTE7 thermostatic bath (±273.5 K). All experiments were carried out in duplicate and the data are expressed as mean.
2.3 Circular Dichroism
For CD Spectra of OVA, pure phenolic solutions and OVA-phenolic compounds complexes were recorded with a Jasco J-815 spectropolarimeter (JASCO Corporation, Tokyo, Japan). For measurements in the far-UV region, a quartz cell with a path length of 0.1 cm was used under nitrogen atmosphere (1 Bar). Protein concentration was kept constant (4.44x10⁻⁶M), whilst varying each phenolic compound concentration. An accumulation of 3 scans with a scan speed of 50 nm per minute was performed and data were collected for each nanometer from 260 to 190 nm. These were carried out six times and the results are expressed as mean. Samples were incubated 15 min at 298 K and using a LAUDA RE-104 circulating water bath connected to the water-jacketed quartz cuvettes. Spectra were corrected for buffer signal and the spectra of phenolic compounds at the correspondent concentration were subtracted of
15 spectra OVA-phenolic compound. The protein secondary structure was calculated using CDSSTR program, which calculates the different components of the secondary structures by comparison of obtained CD spectra with a CD spectra collection of globular proteins measured in the same range of wavelength. The program CDSSTR is provided in Dichroweb software which is available at the website: http://dichroweb.cryst.bbk.ac.uk/html/home.shtml.
2.4 Descriptive Analysis
Data from CD and fluorescence spectra were transferred to Microsoft Excel 2013 (15.0.4420.1017) software, where all calculation were done as well the construction of figures and tables.
16
Chapter 3
Results and Discussion
3.1 Fluorescence quenching
The fluorescence spectra of OVA are due to the Trp residues (Trp148, Trp184 and Trp267) because the Phe residues have a very low quantum yield [60] and the fluorescence of Tyr residues are almost totally quenched when it is ionized by an amino group, a carboxyl group or a Trp [61]. The interaction of OVA with the phenolic compounds at physiological pH (7.4) was evaluated by measuring the intrinsic fluorescence intensity of OVA. Figures (Figure 4 to
Figure 10) show the emission fluorescence spectra of OVA in the absence and presence the
phenolic compounds at two temperatures (298 and 310 K).
a) b) 387 nm 389 nm 387 nm 388 nm
Figure 4 - Fluorescence spectra of OVA (4.44x10⁻⁶M) in the presence of concentration of GA [0M ();
3.50x10⁻⁶M (); 5.21x10⁻⁶M (); 6.90x10⁻⁶M (); 8.57x10⁻⁶M (); 1.02x10⁻⁵M (); 1.35x10⁻⁵M (); 1.67x10⁻⁵M
(); 1.97x10⁻⁵M (); 2.42x10⁻⁵M (); 2.99x10⁻⁵M (); 3.67x10⁻⁵M () and 4.31x10⁻⁵M ()] at 298K (a) and
310K (b). The arrow indicates the trend of the fluorescence change in OVA upon addition of GA as well as the trend of the GA concentration increase in the experiment and the shift of λmax.
17
Figure 5 - Fluorescence spectra of OVA (4.44x10⁻⁶M) in the presence of concentration of CA [0M ();
1.15x10⁻⁶M (); 2.30x10⁻⁶M (); 3.43x10⁻⁶M (); 5.69x10⁻⁶M (); 1.12x10⁻⁵M (); 2.17x10⁻⁵M (); 3.15x10⁻⁵M
(); 4.08x10⁻⁵M (); 4.96x10⁻⁵M (); 5.78x10⁻⁵M (); 6.64x10⁻⁵M () and 8.01x10⁻⁵M ()] at 298K (a) and
310K (b). The arrow indicates the trend of the fluorescence change in OVA upon addition of CA as well as the trend of the CA concentration increase in the experiment and the shift of λmax.
a) b) 386 nm 395 nm 387 nm 396 nm 387 nm 392 nm a)
18
386 nm
Figure 6 - Fluorescence spectra of OVA (4.44x10⁻⁶M) in the presence of concentration of FA [0M ();
8.55x10⁻⁷M (); 2.55x10⁻⁶M (); 4.22x10⁻⁶M (); 5.87x10⁻⁶M (); 7.50x10⁻⁶M (); 9.11x10⁻⁶M (); 1.23x10⁻⁵M
(); 1.53x10⁻⁵M (); 1.98x10⁻⁵M (); 2.55x10⁻⁵M (); 3.23x10⁻⁵M (), 3.87x10⁻⁵M () and 4.76x10⁻⁵M ()] at
298K (a) and 310K (b). The arrow indicates the trend of the fluorescence change in OVA upon addition of FA as well as the trend of the FA concentration increase in the experiment and the shift of λmax.
393 nm b) a) b) 388 nm 403 nm 387 nm 403 nm
Figure 7 - Fluorescence spectra of OVA (4.44x10⁻⁶M) in the presence of concentration of CHA [0M ();
2.79x10⁻⁶M (); 4.63x10⁻⁶M (); 6.44x10⁻⁶M (); 8.22x10⁻⁶M (); 9.98x10⁻⁶M (); 1.17x10⁻⁵M (); 1.51x10⁻⁵M
(); 1.85x10⁻⁵M (); 2.17x10⁻⁵M (); 2.49x10⁻⁵M (); 2.95x10⁻⁵M (), 3.54x10⁻⁵M () and 4.24x10⁻⁵M ()] at
298K (a) and 310K (b). The arrow indicates the trend of the fluorescence change in OVA upon addition of CHA as well as the trend of the CHA concentration increase in the experiment and the shift of λmax.
19
Figure 8 - Fluorescence spectra of OVA (4.44x10⁻⁶M) in the presence of concentration of RES [0M ();
3.68x10⁻⁶M (); 1.09x10⁻⁵M (); 1.79x10⁻⁵M (); 2.47x10⁻⁵M (); 3.14x10⁻⁵M (); 3.79x10⁻⁵M (); 4.43x10⁻⁵M
(); 5.35x10⁻⁵M (); 6.24x10⁻⁵M (); 7.38x10⁻⁵M (); 8.47x10⁻⁵M () and 9.76x10⁻⁵M ()] at 298K (a) and
310K (b). The arrow indicates the trend of the fluorescence change in OVA upon addition of RES as well as the trend of the RES concentration increase in the experiment and the shift of λmax.
a) 387 nm 386 nm b) a) 386 nm 400 nm 389 nm 403 nm
20 b) 387 nm 386 nm a) 387 nm 391 nm b) 387 nm 392 nm
Figure 10 - Fluorescence spectra of OVA (4.44x10⁻⁶M) in the presence of concentration of TA [0M ();
3.89x10⁻⁷M (); 5.82x10⁻⁷M (); 7.73x10⁻⁷M (); 9.63x10⁻⁷M (); 1.15x10⁻⁶M (); 1.34x10⁻⁶M (); 1.71x10⁻⁶M
(); 2.08x10⁻⁶M (); 2.44x10⁻⁶M (); 2.80x10⁻⁶M (); 3.15x10⁻⁶M () and 3.50x10⁻⁶M ()] at 298K (a) and
310K (b). The arrow indicates the trend of the fluorescence change in OVA upon addition of TA as well as the trend of the TA concentration increase in the experiment and the shift of λmax.
Figure 9 - Fluorescence spectra of OVA (4.44x10⁻⁶M) in the presence of concentration of QCT [0M ();
1.10x10⁻⁶M (); 3.28x10⁻⁶M (); 5.42x10⁻⁶M (); 7.54x10⁻⁶M (); 9.64x10⁻⁶M (); 1.37x10⁻⁵M (); 1.77x10⁻⁵M
(); 2.36x10⁻⁵M (); 2.92x10⁻⁵M (); 3.63x10⁻⁵M (); 4.32x10⁻⁵M (), 5.13x10⁻⁵M () and 5.89x10⁻⁵M ()] at
298K (a) and 310K (b). The arrow indicates the trend of the fluorescence change in OVA upon addition of QCT as well as the trend of the QCT concentration increase in the experiment and the shift of λmax.
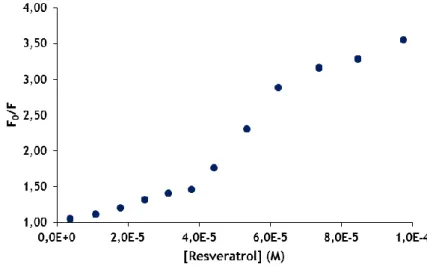
21 For all tested phenolic compounds, the fluorescence intensity of OVA decreased gradually when the concentration of the compounds increased, i.e., there was the OVA fluorescence quenching (Figure 4 to Figure 10). This was observed in the experiments, even after the first
addition of the phenolic compound and for the two temperatures. Also, a red shift in λmax may be observed with some phenolic compounds: CA (Figure 5), FA (Figure 6), CHA (Figure 7), RES (Figure 8), TA (Figure 10) while in GA (Figure 4) and QCT (Figure 9) is not verifiable. The shift suggests that the OVA fluorophores became more accessible to the solvent, which presumably increases the propensity of the Trp side chain to form H-bonds [65] and, therefore, disturb the protein tertiary structure [66]. The lack of a spectral shift is indicative that the Trp is not exposed to any change in polarity and temperature had no influence on this parameter.
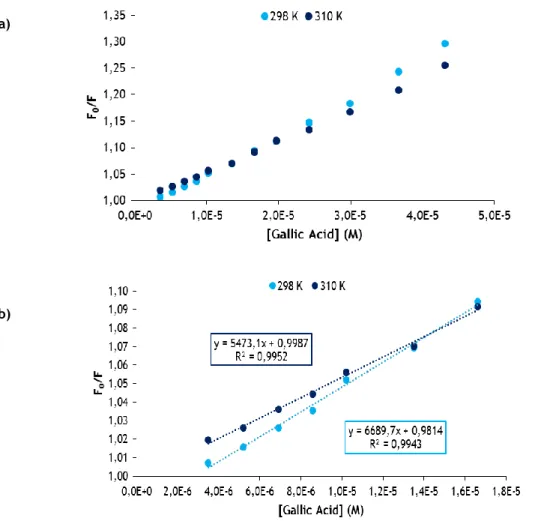
In order to clarify the fluorescence quenching mechanism, i.e., to determine whether the observed quenching was due to bonding or to collisional phenomena induced by phenolic compounds in study, the equation (1) and (2) were utilized. The final results are presented in the Table 1, together with the binding constant (Kb) which will be discussed later. However, in annex 1 there are graphical representations (F0/F versus [Q]) for each phenolic compound. Table 1 - The quenching constants and binding constants between OVA and phenolic compounds at different temperatures.
The Stern-Volmer plots (annex 1) are almost all linear and for high concentrations of phenolic compounds there is an upward curvature more or less evident in the different cases. Since a linear plot suggests the predominance of dynamic quenching and an upward curvature indicates an additional static component [67], this reveals a combined quenching for our experiments, but it is not sufficient to define the quenching type [61]. Also in the cases where an upward curvature is more evident this may be due to a very large ligand/OVA ratio [68]. Consequently, by equation (2) it is verified that the values of Kq (Table 1) for all tested compounds at both temperatures are higher than the maximum scatter collision quenching constant of the biomolecule (Kq = 2.0 x 10¹⁰ M-s s-1), which indicate that the static quenching T (K) Compound Phenolic Ksv (M-1) Kq (M-s s-1) Kb (M-1) T (K) Ksv (M-1) Kq (M-s s-1) Kb (M-1) 298 Gallic Acid 6.9103 6.91011 2.6103 310 5.5103 5.51012 4.1103 Caffeic Acid 1.6104 1.61012 9.5103 1.8104 1.81012 2.0104 Ferulic Acid 1.1104 1.11012 7.9103 1.2104 1.21012 1.2104 Chlorogenic Acid 2.1104 2.11012 1.1104 2.4104 2.41012 2.1104 Resveratrol 1.1104 2.11012 2.6103 1.3104 1.31012 9.0103 Quercetin 6.2103 6.21011 3.7103 1.2104 1.21012 1.1105 Tannic Acid 9.9104 9.91012 7.7104 9.1104 9.11012 1.0105
22 mechanism is the main reason of protein fluorescence quenching [61]. There is the formation of a complex between OVA and each one of the phenolic compounds, which agree with other similar studies [61,65,69]. From Table 1 it is verified that Ksv values increase with temperature for CA, FA, CHA, RES and QCT. Thus, these phenolic compounds affect the microenvironment of OVA with the increase of temperature, while GA and TA do not.
Ultimately, it should be highlighted the Stern-Volmer plot of RES for 310 K (Figure 11). From the concentration of 4.43x10⁻⁵ M of RES the slope of the curve increases markedly, which means a great decrease in fluorescence (F). After 6.24x10⁻⁵ M the slope decreases, when the fluorescence is already low, which means that the quenching is maximum and almost the entire of Trp fluorescence disappears.
3.2 Binding data analysis
Admitting that phenolic compounds bind independently to a set of equivalent sites on a protein, the equilibrium between free and bound molecules is given by the Lineweaver-Burk
equation (3) [61]:
1/(F0-F) = 1/F0 + 1/(Kbx F x [Q]) (3)
where Kb is the binding constant between protein and ligand and a plot of (1/(F0-F)) versus 1/[Q]) can be used to determine Kb [61]. The results obtained by plot and equation (3) are presented in Table 1 for all phenolic compounds and the two different temperatures. The plots (1/(F0-F)) versus 1/[Q]) are presented in annex 1.
Kb increases with temperature (Table 1). Thus, this factor influences the microenvironment of OVA in order to increase the binding sites or the stability of the formed complex. Thus, temperature may be beneficial in futures applications. The data shown in Table 1 for 298 K reveals weak interactions due to a low stability of the binding in almost all cases (≤103 M−1),
23 except for CHA and TA that gave higher equilibrium binding constants (≤104 M−1). Inversely, for 310 K there are only two cases with weak interactions (GA and RES) [59].
Despite concentration between the phenolic compounds under study and OVA were not the same, from Table 1, it can be seen that the highest Kb belongs to OVA-TA complex. This may be due to the TA having the largest number of OH groups [56]. These groups of phenolic compounds can bind to polypeptide chain of protein through hydrogen bonds, so, the phenolic compounds that have more phenolic hydroxyl groups have more chances to form hydrogen bond and, consequently, a stronger complex with higher Kb [58].
3.3 Thermodynamic analysis of binding mode
The acting forces between small molecules and macromolecules include hydrogen bonds, van der Waals interactions, electrostatic forces, and hydrophobic interactions. The thermodynamic parameters for protein reactions can account for the main forces contributing to protein stability. If the enthalpy change (ΔH) does not vary significantly over the studied temperature range, then the values of the enthalpy change (ΔH), as well as entropy change (ΔS) and free energy change (ΔG), can be determined from the following equations (4) and
(5) [60,61]:
ln Kb = - ΔH/R x T + ΔS/R (4) ΔG = ΔH-T x ΔS = -R x T x ln Kb (5)
Kb is the binding constant that was previously calculated by equation (3) at corresponding temperature and R is the gas constant (8.31 J K-1 mol-1). The values of ΔH, ΔG and ΔS are summarized in Table 2 and the van’t Hoff plot (ln Kb versus 1/T) of the phenolic compounds-OVA complexes are in annex 2.
24
Table 2 – The thermodynamic parameters of OVA-phenolic compounds interaction at different temperatures.
From Table 2 it can be seen that all complexes are accompanied by negative free energy change and positive enthalpy and entropy changes. The negative sign for ΔG means that the binding process occur spontaneously [70] and according to Ross and Subramanian, for typical hydrophobic interactions both ΔH and ΔS changes are positive, while negative ΔH and ΔS
changes arise from the van der Waals force and hydrogen bonding. On the other hand, negative ΔH and positive ΔS imply electrostatic interactions [71]. Therefore, in this study the formation of complexes between phenolic compounds and OVA are a spontaneous process and hydrophobic interactions are considered to be main driving forces towards association, probably enhanced by hydrogen bonding [72], caused by changes in polarity.
T (K) Phenolic Compound ΔH (J mol-1) ΔG (J mol-1) ΔS (J mol-1 K-1)
298 Gallic Acid 2.9x10⁴ -1.9x10⁴ 1.6x10² 310 -2.1x10⁴ 298 Caffeic Acid 4.8x10⁴ -2.3x10⁴ 2.4x10² 310 -2.6x10⁴ 298 Ferulic Acid 2.7x10⁴ -2.2x10⁴ 1.6x10² 310 -2.4x10⁴ 298 Chlorogenic Acid 4.1x10⁴ -2.3x10⁴ 2.2x10² 310 -2.6x10⁴ 298 Resveratrol 7.9x10⁴ -1.9x10⁴ 3.3x10² 310 -2.3x10⁴ 298 Quercetin 2.1x10⁵ -2.0x10⁴ 8.0x10² 310 -3.0x10⁴ 298 Tannic Acid 1.7x10⁴ -2.8x10⁴ 1.5x10² 310 -3.0x10⁴
![Figure 1 – Exemplification of conformational and sequential epitopes (adapted from [12])](https://thumb-eu.123doks.com/thumbv2/123dok_br/19170083.940833/19.892.284.648.755.1025/figure-exemplification-conformational-sequential-epitopes-adapted.webp)