Magnetic-Field Generation and Amplification in an Expanding Plasma
K. M. Schoeffler,1 N. F. Loureiro,1 R. A. Fonseca,1,2 and L. O. Silva1
1
Instituto de Plasmas e Fusão Nuclear—Laboratório Associado, Instituto Superior Técnico, Universidade de Lisboa, 1049-001 Lisboa, Portugal
2
DCTI/ISCTE—Instituto Universitário de Lisboa, 1649-026 Lisboa, Portugal (Received 15 August 2013; published 30 April 2014)
Particle-in-cell simulations are used to investigate the formation of magnetic fieldsB in plasmas with perpendicular electron density and temperature gradients. For system sizes L comparable to the ion skin depth di, it is shown that B ∼ di=L, consistent with the Biermann battery effect. However, for large L=di, it
is found that the Weibel instability (due to electron temperature anisotropy) supersedes the Biermann battery as the main producer of B. The Weibel-produced fields saturate at a finite amplitude (plasma β ≈ 100), independent of L. The magnetic energy spectra below the electron Larmor radius scale are well fitted by the power law with slope−16=3, as predicted by Schekochihin et al. [Astrophys. J. Suppl. Ser. 182, 310 (2009)].
DOI:10.1103/PhysRevLett.112.175001 PACS numbers: 52.35.Qz, 52.38.Fz, 52.65.Rr, 98.62.En
Introduction.—The origin and amplification of magnetic fields are central problems in astrophysics[1]. The turbu-lent dynamo [2,3] is generally thought to be the basic process behind the amplification of a magnetic seed field; however, some other process is required to originate the seed itself. Among the few mechanisms able to do so is the Biermann battery effect, due to perpendicular electron density and temperature gradients [4]. It is often conjec-tured that the observed magnetic fields in the Universe may be of Biermann origin, subsequently amplified via dynamo action [1]. However, simple theoretical estimates suggest that Biermann-generated magnetic fieldsB should be such that [5–7]
β ≡ 8πP=B2∼ ðd
i=LÞ−2; (1)
where P is the plasma pressure, di¼ c=ωpi is the ion inertial length (with c the speed of light and ωpi the ion plasma frequency), and L is the characteristic length scale of the system. Given the extremely small values of di=L typical of astrophysical systems, it is an open question whether such seeds are sufficiently large to account for the microgauss fields observed today.
Megagauss magnetic fields are observed to form in intense laser-solid interaction laboratory experiments
[8–12]. In these experiments, the laser generates an expanding bubble of plasma by ionizing a foil of metal or plastic. The plasma is denser closer to the plane of the target foil and hotter closer to the laser beam axis. Perpendicular density and temperature gradients are thus generated, giving rise to magnetic fields via the Biermann effect. Besides their intrinsic interest, these experiments offer a unique opportunity to illuminate a fascinating, and poorly understood, astrophysical process.
In this Letter, we perform ab initio numerical inves-tigations of the generation and growth of magnetic fields in
a configuration akin to that of laser-generated plasma systems. For small to moderate values of the parameter L=di, our simulations confirm the theoretical predictions of Haines[7]; in particular, for L=di≳ 1, the magnetic fields obey the scaling of Eq.(1). However, when L=di≫ 1, we find that the plasma is unstable to the Weibel instability
[13], which amplifies the magnetic fields such thatβ ≈ 100, independent of L. These results have strong implications for the interpretation of laser-solid interaction experiments; they also shed new light on the currently accepted view of the origin of the observed cosmic magnetic fields.
Computational model.—We perform a set of particle-in-cell simulations using theOSIRIS framework [14,15]. The initial fluid velocity, electric field, and magnetic field are all uniformly 0. We start with a spheroid distribution of density that has a shorter length scale in one direction: n ¼ ðn0− nbÞ cosðπR1=2LTÞ þ nb, if R1< LT; nb; other-wise, R1¼ ffiffiffiffiffiffiffiffiffiffiffiffiffiffiffiffiffiffiffiffiffiffiffiffiffiffiffiffiffiffiffiffiffiffiffiffiffiffiffiffiffi x2þ ðLT=LnyÞ2þ z2 p and nb ¼ 0.1n0 is the uniform background density. The characteristic lengths of the temperature and density gradients generated by the laser beam are denoted by LT and Ln, respectively. To represent the recently ionized foil, which is flatter in the direction of the laser y, we set LT=Ln¼ 2. (This is a generic choice that appears to be qualitatively consistent with experiments, e.g., Refs. [9–12]; note, however, that the specific value of LT=Ln depends on target and laser properties.) The initial velocity distributions are Maxwellian, with a uniform ion thermal velocity vTi0. The spatial profile for the electron thermal velocity is cylindrically symmetric along the y direction, where it is hottest in the center: vTe¼ðvTe0−vTebÞcosðπR2=2LTÞþvTeb, if R2< LT;vTeb; otherwise, R2¼
ffiffiffiffiffiffiffiffiffiffiffiffiffiffiffi x2þ z2 p
, resulting in a maximum initial electron pressure Pe0¼ men0v2Te0=2. The numerical values of the thermal velocities are vTe0¼ 0.2c and vTi0¼ vTeb¼ 0.01c. Note that in our setup, the pressure
is dominated by the electrons, and thusβ ≈ βe≡ 8πPe=B2. For simplicity, the boundaries are periodic, but the box is large enough that they do not interfere with the dynamics [Lðx;y;zÞ max¼ −Lðx;y;zÞ min¼ 15=8LT]. In order to investi-gate a larger range of LT=di, the simulations are run with a reduced mass ratio of 25. The spatial resolution is 16 grid points/de, or 2.26 grid points=λd, where de ¼ c=ωpe is the electron inertial length (ωpe is the electron plasma frequency) andλd is the electron Debye length. The time resolution isΔtωpe ¼ 0.07. The 2D simulations have 196 or 64 particles per cell (ppc); the 3D simulation has 27 ppc. Biermann regime.—Figure1shows contours of constant magnetic energy density and magnetic-field lines from a 3D simulation with LT=de¼ 50 taken at tωpe ¼ 235.2, after the magnetic-field strength saturates (see Fig.3). As expected based on the initial conditions, we observe the formation of large-scale azimuthal Biermann magnetic fields which are nearly axisymmetric. Although Biermann generation of magnetic fields has been investigated before
[16], this is the first fully self-consistent kinetic 3D simulation.
The axisymmetry in the 3D simulation suggests that a scaling study in system size can be performed using a more computationally efficient 2D setup. To this end, we take a cut of the 3D system at z ¼ 0, where the azimuthal (out-of-plane) magnetic fields are in the z direction, and perform a set of 2D simulations with LT=de¼ ð4;8;16;25;32;50;64;128;200;400Þ. For 4≤LT=de≤128, we use 196 ppc. For LT=de¼ 200, 400, we use 64 ppc instead due to computing time limitations; convergence studies at lower values of LT=de do not show significant differences between 196 and 64 ppc. A snapshot taken at the same time of a 2D version of the simulation presented
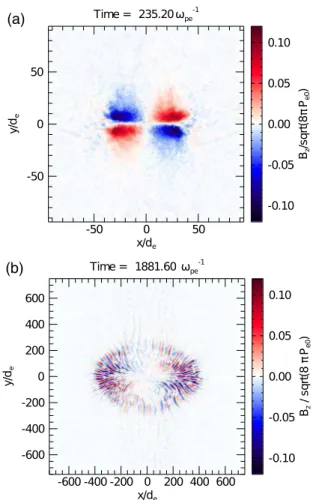
in Fig.1is shown in Fig. 2(a)for comparison. The same large-scale magnetic-field structure is manifest, with very similar levels of Bz.
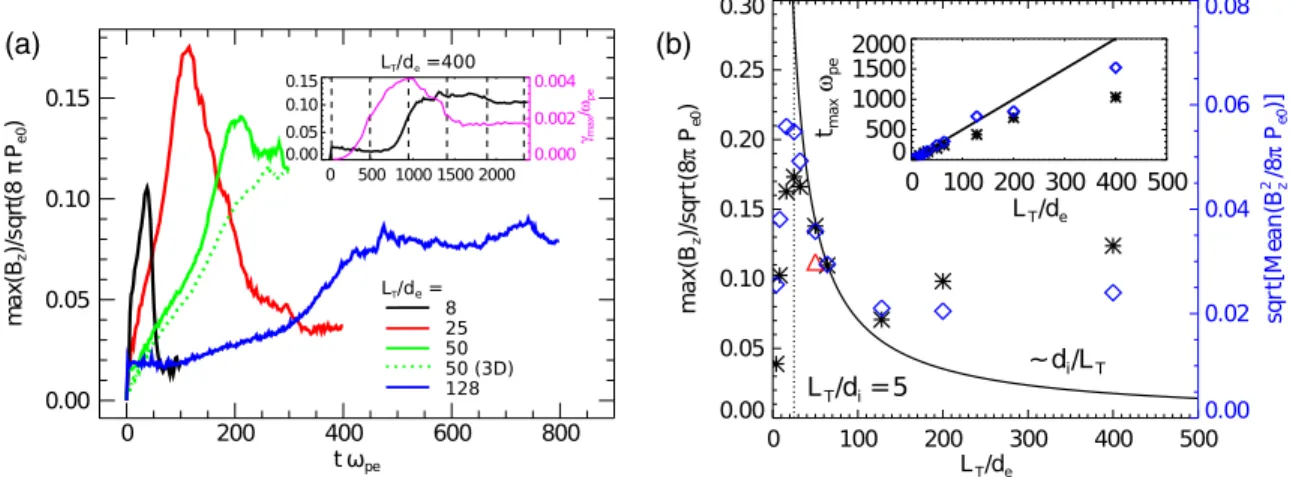
The time trace of the maximum magnetic-field strength for a selection of cases can be seen in Fig.3(a). For small systems LT=de < 50, the magnetic field reaches a maxi-mum and then decays away. On the other hand, we observe that for LT=de > 50, the magnetic field saturates at around its peak value.
Figure 3(b) shows the scaling with system size of the maximum and the average magnitude of the magnetic field (the square root of B2z averaged in a box 2LT×2Ln surrounding the expanding bubble) at the time when the field saturates (or peaks for LT=de< 50). There are three distinct regions in this plot. For LT=de < 25 (i.e., LT=di≲ 5), the magnetic field increases with system size. This stage is followed by a region where the saturated amplitude of the field decreases as di=LT, which lasts while LT=de< 100. These two stages confirm the theoretical prediction of Haines[7]: in very small systems, there is a competition between the Biermann battery effect and microinstabilities (the ion acoustic and the lower hybrid drift instabilities), triggered by an electron drift velocity in excess of the ion acoustic speed, which suppress the
(a)
(b)
FIG. 2 (color online). Out-of-plane magnetic field Bz after
saturation (see Fig.3) for (a) LT=de¼ 50 and (b) LT=de¼ 400.
FIG. 1 (color online). Magnetic energy contours after saturation (tωpe¼235.2; see Fig.3) from a 3D simulation with LT=de¼50.
Lighter to darker colors represent B2=8πPe0¼ 0.0035, 0.0071,
Biermann fields. As the system becomes larger, the electron drift velocity decreases. (Larger systems have larger-scale magnetic fields, and therefore lower currents.) The micro-instabilities thus become progressively less virulent until their complete suppression, whereupon we encounter a “pure” Biermann regime, as described in Eq. (1). Inspection of the simulations for LT=de < 50 at times after the magnetic field reaches its peak value shows clear electric-field perturbations along y ¼ 0, consistent with the ion acoustic instability. These are exemplified for LT=de ¼ 25 in Fig.4. Note that the density gradient goes to 0 at y ¼ 0, ruling out the lower hybrid drift instability as the cause of the decay of the magnetic field.
Weibel regime.—An unexpected third regime is encoun-tered for LT=de> 100. In that region of Fig. 3(b), the magnetic field produced in our simulations no longer follows the predicted di=LT Biermann scaling, but rather increases with the system size and appears to tend to a constant, finite value βe≈ 100.
In this new regime, the magnetic fields are produced by the Weibel instability [13]. The initial cloud of plasma expands due to the imposed density gradient, generating both outward ion and hot electron flows. The velocities of the electron flows vary along the temperature gradient. The higher temperature flows originating in the center stream past lower temperature inward flows originating further outward, which maintains quasineutrality. This generates a larger velocity spread (larger temperature) in the direction of the flow, while the perpendicular temperature remains unaffected. It is this temperature anisotropy that drives the Weibel instability[13]. Note that along x ¼ 0, where the temperature gradient is 0, no anisotropy is generated, and thus the Weibel instability is not observed [see Fig.2(b)]. As exemplified in Fig. 2(b) for our largest simulation (LT=de ¼ 400), the large-scale coherent Biermann magnetic
fields characteristic of the smaller systems are replaced by nonpropagating magnetic structures with very large wave numbers (kde∼ 0.2) and with a transverse wave vector k perpendicular to the direction with a larger temperature. These features are consistent with the Weibel instability
[13,17,18]. In addition, we have compared our results with the analytic growth rate predicted by Weibel [13]. In our simulations, we observe an enhanced temperature in the direction of the density gradient (parallel) as high as A ≡ T∥e=T⊥e− 1 ≈ 2.0. In a cut at y ¼ 0, we calculate the Weibel growth rateγ for the fastest growing k (kmax) using the locally measured values of n, T⊥e, and A. The maximum γ of this cut γmax is plotted vs time in Fig.3(a), showing a peak when the magnetic-field strength rises exponentially and a subsequent drop corresponding to the loss of anisotropy after saturation. The magnitude of the growth rate thus calculated is also consistent within a factor of 2, with kmaxde≈ 0.2, analogous to the structures in Fig. 2(b).
The transition between the Biermann and Weibel regimes is also visible in the inset of Fig. 3(b), where we show the time to reach the maximum magnetic field tmax as a function of system size. For LT=de< 50, we find that
(a) (b)
FIG. 3 (color online). (a) Maximum Bzvs time for a selection of system sizes (LT=de). The inset shows the LT=de¼ 400 case (black
line). The magenta line is the maximum Weibel growth rateγmaxat y ¼ 0. Dashed lines identify the times at which the spectra of Fig.5
are calculated. (b) Maximum (asterisks) and average (diamonds) magnitudes of Bzvs LT=de. The triangle represents the maximum Bz
for the 3D run. The solid curve is maxðBzÞ=pffiffiffiffiffiffiffiffiffiffiffiffi8πPe0¼p2ffiffiffidi=LT; the dotted line indicates LT=di¼ 5. The inset shows the time to
maximum magnetic field tmax vs LT=de. The solid line indicates tmax¼ LT=vTe0.
FIG. 4 (color online). Electric field in the x direction Ex for
tmax∼ LT=vTe0. A linear in time scaling is indeed to be expected for Biermann-generated fields; also, at these small scales, the electrons are not coupled to the ions and are thus free to move at their thermal velocity. A transition to a logarithmic dependence on the system size occurs after LT=de > 50; this is expected since the Weibel instability amplifies the magnetic fields at an exponential rate. Note that the Weibel instability cannot occur below a certain system size because it is suppressed by the strong, large-scale Biermann fields. (We have confirmed this suppression numerically by running a similar setup where the Biermann effect is not present; see also Ref. [19].)
We have performed additional studies that confirm our conclusions up to a mass ratio of mi=me ¼ 2000, at which point the results have converged. With these more realistic mass ratios, the saturated magnetic field increases less than twice the value obtained for mi=me ¼ 25. These results will be presented elsewhere.
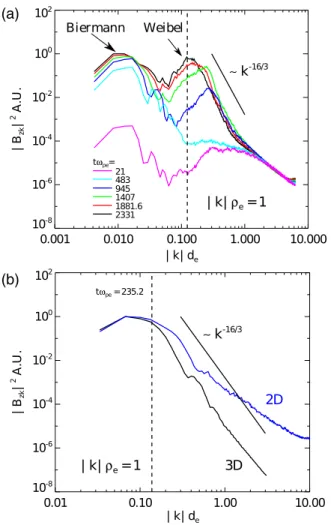
Spectra.—Figure5(a)shows the spectrum of B2z for our largest simulation (LT=de¼ 400) at the times indicated in the inset of Fig.3(a). At early times, a peak rapidly forms at kde≈ 0.01, which corresponds to the large-scale Biermann-generated magnetic field. At later times, a second peak corresponding to the Weibel-generated mag-netic fields begins to form at kde≈ 0.2 and eventually saturates at kde≈ 0.1; this scale corresponds to kρe¼ 1, whereρeis the electron Larmor radius based on the maximum Bz at saturation. Therefore, the Weibel-generated fields saturate whenβe¼ ðρe=deÞ2≈ 100 (cf. Refs.[17,20]), inde-pendently of the system size, as shown in Fig.3(b).
Another remarkable feature yielded by the spectra of Fig.5is the power law behavior of the magnetic energy at sub-ρe scales, with a slope close to −16=3. A less steep power law appears to exist at smaller scales, but this is not present in the 3D simulation, as seen in Fig.5(b). Note that this slope occurs for both small and large systems and is not, therefore, a consequence of the Weibel instability. Such a power law dependence was theoretically predicted using gyrokinetic theory in Ref.[21], where it was identified as resulting from an entropy cascade of the electron distribution function at scales below kρe∼ 1. We believe this is the first 3D confirmation of that prediction, although similar obser-vations have been made in 2D simulations[22].
Conclusions.—We have performed fully kinetic simu-lations of magnetic-field generation and amplification in expanding, collisionless plasmas with perpendicular den-sity and temperature gradients. For relatively small systems LT=de < 100, we observe the production of large-scale magnetic fields via the Biermann battery effect, fully confirming the theoretical predictions of Haines [7], in particular, the scaling of the magnetic-field strength with di=LT. For larger systems, however, we discover a new regime of magnetic-field generation: the expanding plas-mas are Weibel unstable, giving rise to small-scale (kde∼ 0.2) magnetic fields whose saturated amplitude is
such thatβe≈ 100, independent of system size, and thus much larger than would be predicted for such systems on the basis of the Biermann mechanism. We note that both of these regimes can, in principle, be probed by existing experiments. For example, the LT=di≈ 1 regime (Biermann) is accessible to the Vulcan laser[9], whereas LT=di≈ 100 (Weibel) is reachable by an OMEGA laser
[10]. In practice, however, collision frequencies that are large compared to the electron transit time prohibit electron temperature anisotropies, thereby inhibiting the Weibel instability. If less collisional regimes can be attained in the experiments, it may be possible to experimentally investigate the transition from Biermann- to Weibel-produced magnetic fields that we have uncovered here.
In the context of (largely collisionless) astrophysical plasmas, our results may significantly impact the canonical picture of cosmic magnetic-field generation [1], by sug-gesting that Biermann seed fields may be preamplified
(a)
(b)
FIG. 5 (color online). Fourier spectrum of B2z for
(a) LT=de¼ 400 and (b) LT=de¼ 50. In (a), the spectrum is
shown at several different times [see Fig.3(a)], while in (b), the 3D (black curve) and the 2D (blue curve) simulations are shown for tωpe¼ 235.2. The dashed lines represent where kρe¼ 1,
based on the maximum magnetic field. The solid black lines indicate a power law of k−16=3.
exponentially fast via the Weibel instability up to reason-ably large values (i.e., independent of the system size) previous to turbulent dynamo action.
This work was partially supported by Fundação para a Ciência e Tecnologia (Ciência 2008 and Grants No. PTDC/ FIS/118187/2010 and No. PTDC/FIS/112392/2009), by the European Research Council (ERC-2010-AdG Grant No. 267841), and by the European Communities under the Contract of Association between EURATOM and IST. Simulations were carried out at Kraken, NICS (XSEDE Grant No. AST030030), and SuperMUC (Germany) under a PRACE grant.
[1] R. M. Kulsrud and E. G. Zweibel, Rep. Prog. Phys. 71, 046901 (2008).
[2] R. M. Kulsrud and S. W. Anderson,Astrophys. J. 396, 606 (1992).
[3] A. Brandenburg, D. Sokoloff, and K. Subramanian,Space Sci. Rev. 169, 123 (2012).
[4] L. Biermann, Z. Naturforsch. 5a, 65 (1950).
[5] C. E. Max, W. M. Manheimer, and J. J. Thomson, Phys. Fluids 21, 128 (1978).
[6] R. S. Craxton and M. G. Haines, Plasma Phys. 20, 487 (1978).
[7] M. G. Haines,Phys. Rev. Lett. 78, 254 (1997).
[8] J. A. Stamper, K. Papadopoulos, R. N. Sudan, S. O. Dean, and E. A. McLean,Phys. Rev. Lett. 26, 1012 (1971). [9] P. M. Nilson, L. Willingale, M. C. Kaluza, C. Kamperidis, S.
Minardi, M. S. Wei, P. Fernandes, M. Notley, S. Bandyo-padhyay, M. Sherlock et al.,Phys. Rev. Lett. 97, 255001 (2006).
[10] C. K. Li, F. H. Séguin, J. A. Frenje, J. R. Rygg, R. D. Petrasso, R. P. J. Town, P. A. Amendt, S. P. Hatchett, O. L. Landen, A. J. Mackinnon et al., Phys. Rev. Lett. 97, 135003 (2006).
[11] C. K. Li, F. H. Seguin, J. A. Frenje, J. R. Rygg, R. D. Petrasso, R. P. J. Town, O. L. Landen, J. P. Knauer, and V. A. Smalyuk,Phys. Rev. Lett. 99, 055001 (2007). [12] N. L. Kugland, D. D. Ryutov, P.-Y. Chang, R. P. Drake, G.
Fiksel, D. H. Froula, S. H. Glenzer, G. Gregori, M. Grosskopf, M. Koenig et al.,Nat. Phys. 8, 809 (2012). [13] E. S. Weibel,Phys. Rev. Lett. 2, 83 (1959).
[14] R. A. Fonseca, L. O. Silva, F. S. Tsung, V. K. Decyk, W. Lu, C. Ren, W. B. Mori, S. Deng, S. Lee, T. Katsouleas, and J. C. Adam, Lect. Notes Comput. Sci. 2331, 342 (2002).
[15] R. A. Fonseca, S. F. Martins, L. O. Silva, J. W. Tonge, F. S. Tsung, and W. B. Mori,Plasma Phys. Controlled Fusion 50, 124034 (2008).
[16] A. Thomas, M. Tzoufras, A. Robinson, R. Kingham, C. Ridgers, M. Sherlock, and A. Bell,J. Comput. Phys. 231, 1051 (2012).
[17] F. Califano, F. Pegoraro, S. V. Bulanov, and A. Mangeney, Phys. Rev. E 57, 7048 (1998).
[18] R. A. Fonseca, L. O. Silva, J. W. Tonge, W. B. Mori, and J. M. Dawson,Phys. Plasmas 10, 1979 (2003).
[19] K. Molvig,Phys. Rev. Lett. 35, 1504 (1975).
[20] D. V. Romanov, V. Y. Bychenkov, W. Rozmus, C. E. Capjack, and R. Fedosejevs,Phys. Rev. Lett. 93, 215004 (2004).
[21] A. A. Schekochihin, S. C. Cowley, W. Dorland, G. W. Hammett, G. G. Howes, E. Quataert, and T. Tatsuno, Astrophys. J. Suppl. Ser. 182, 310 (2009).
[22] E. Camporeale and D. Burgess, Astrophys. J. 730, 114 (2011).