R E S E A R C H A R T I C L E
Open Access
The trans-Saharan slave trade
–
clues from
interpolation analyses and high-resolution
characterization of mitochondrial DNA lineages
Nourdin Harich
1, Marta D Costa
2,3, Verónica Fernandes
2,3, Mostafa Kandil
1, Joana B Pereira
2,3, Nuno M Silva
2,
Luísa Pereira
2,4*Abstract
Background:A proportion of 1/4 to 1/2 of North African female pool is made of typical sub-Saharan lineages, in higher frequencies as geographic proximity to sub-Saharan Africa increases. The Sahara was a strong geographical barrier against gene flow, at least since 5,000 years ago, when desertification affected a larger region, but the Arab trans-Saharan slave trade could have facilitate enormously this migration of lineages. Till now, the genetic
consequences of these forced trans-Saharan movements of people have not been ascertained.
Results:The distribution of the main L haplogroups in North Africa clearly reflects the known trans-Saharan slave routes: West is dominated by L1b, L2b, L2c, L2d, L3b and L3d; the Center by L3e and some L3f and L3w; the East by L0a, L3h, L3i, L3x and, in common with the Center, L3f and L3w; while, L2a is almost everywhere. Ages for the haplogroups observed in both sides of the Saharan desert testify the recent origin (holocenic) of these
haplogroups in sub-Saharan Africa, claiming a recent introduction in North Africa, further strengthened by the no detection of local expansions.
Conclusions:The interpolation analyses and complete sequencing of present mtDNA sub-Saharan lineages observed in North Africa support the genetic impact of recent trans-Saharan migrations, namely the slave trade initiated by the Arab conquest of North Africa in the seventh century. Sub-Saharan people did not leave traces in the North African maternal gene pool for the time of its settlement, some 40,000 years ago.
Background
The recent high-resolution mtDNA studies are offering the possibility of shedding light on ancient and recent human migration events, allowing to inferring more pre-cisely about the geographical origin of lineages observed nowadays in a certain region. In fact, the characteriza-tion of the full mtDNA sequence is being used to inves-tigate local events as the Chadic expansion from East Africa towards Chad Basin in the last 8,000 years [1] or historic movements as the diaspora of Jews [2,3], which could not be approached in previous more limited mtDNA surveys.
This approach is being applied to the long-enduring discussion about pre-historic migrations across the
Mediterranean Sea, leading to exchange of lineages between Iberia and Maghreb [4,5]. Recently, the sub-characterization of H-lineages observed in several North African populations revealed its affiliation within Iberian expanded lineages, after the Last-Glacial Maximum [6,7], being the same observed in Tuareg living in the Sahel [8]. The Near Eastern contribution to the pool of H lineages in North Africa was minimal, indicating that a pre-historic European lineage input occurred in ele-vated frequencies enriching the ancient Near Eastern background of North African populations mainly consti-tuted by the low frequent haplogroups U6 and M1 [9].
Another major contribution to the pool of North Afri-can populations was the sub-Saharan one. It is known that a proportion of 1/4 to 1/2 of North African female pool is made of typical sub-Saharan lineages (designated as haplogroups L0-L6), in higher frequencies as geo-graphic proximity to sub-Saharan Africa increases [4,5].
* Correspondence: [email protected]
2Instituto de Patologia e Imunologia Molecular da Universidade do Porto
(IPATIMUP), Porto, Portugal
Nevertheless, the Sahara is a strong geographical barrier against gene flow, at least since 5,000 years ago, when desertification affected a larger region, ending up the humid and greening conditions established by around 10,000 years ago, in the so called Holocene Climatic Optimum [10].
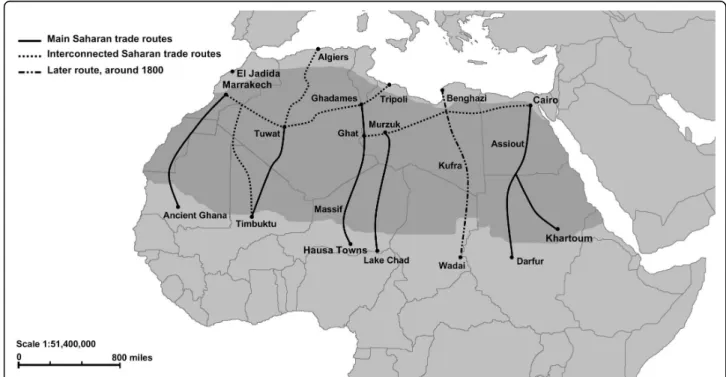
But, if geographical and climatic conditions have not been favorable to sub-Saharan gene flow to North Africa in the last 5,000 years, the Arab trans-Saharan slave trade could have facilitate enormously this migration of lineages. Till now, the genetic consequences of these forced trans-Saharan movements of people have not been ascertained, being over-shadowed by the Atlantic slave trade towards the New World. In fact, the huge number of sub-Saharan people introduced in the New World from the 16thcentury onwards allowed to inves-tigating in great detail the genetic consequences of this historical event [11-13], and the complete sequencing of L-lineages is indicating very precisely about the origin of lineages observed nowadays in America [14]. Nonethe-less, some authors affirm [15] that the Arab slave trade of black slaves was much the same in total to the Atlan-tic slave trade, and interestingly far longer in the time scale. It began in the middle of the seventh century (650 A.D.) and survives still today in Mauritania and Sudan, summing up 14 centuries rather than four as for the Atlantic slave trade. Although estimates are very rough, figures are of 4,820,000 for the Saharan trade between 650 and 1600 A.D., and, for comparison purposes, of
2,400,000 for the Red Sea and the Indian Ocean trade between 800 and 1600 A.D. [16]. Notwithstanding the thousands of kilometers along the edge of the Sahara, the Red sea and the East African coast, from where slave exports came, there were relatively few export points, concentrating geographically the impact of the trade. Black slaves were brought by Berber and Arab merchants mainly to actual Morocco, Algeria, Libya and Egypt through six main routes that crossed the desert (Figure 1): one went north to Morocco from ancient Ghana (at present southeastern Mauritania and Western Mali); a second brought slaves to Tuwat (southern Algeria) from ancient Timbutku (Mali); a third passed from the Niger valley and the Hausa towns through the Air Massif to Ghat and Ghadames; a central route linked Lake Chad region to actual Libya (Murzuk), being one of the most important in slave commerce as it offered oases at regular intervals that could satisfy the caravan’s needs; in East Africa, the slave caravan fol-lowed mainly the Nile River from actual Sudan (Dar Fur) to Egypt (Assiout); and a sixth passed north from the confluence of the Blue and the White Nile to Egypt. Some of these routes were interconnected: the routes north from Timbuktu went to Morocco, Algeria, and Libya; while the Dar Fur-Egypt route connected with the route north from the upper Nile valley.
Males were sought for a variety of functions: door-keepers, secretaries, militaries or eunuchs. Black soldiers were seen from Islamic Spain to Egypt, and in Morocco
a whole generation of black young boys were bought at the age of 10 or 11 and trained to become its army. However, the bulk of the trade was in females, as domestic servants, entertainers and/or concubines: two females for every male overall, in contrast to the ratio of two males for every female overall in the Atlantic trade [15]. Some harems could be enormous, reaching even the extravagating number of 14,000 concubines. Young female slaves were instructed in household crafts and were then provided with resources to buy a home and get married.
The Eastern sub-Saharan slave trade towards Arabia was investigated through mtDNA hypervariable region I (HVRI) diversity [17], leading to concluding that higher frequencies of L lineages are observed in Arab compara-tively with non-Arab populations in the Near East, hav-ing been introduced in the last 2,500 years. These conclusions were supported afterwards by other studies [18,19]. This Eastern sub-Saharan slave trade involved mainly maritime routes across the Red Sea, which was dominated by the Southern Arabs, already around the 12thcentury BC.
The Western trans-Saharan slave trade deserves a more careful genetic investigation. In this work we will present the results of mtDNA haplogroup affiliation of El Jadida population, approximately 100 km south of Casablanca, in the Moroccan Atlantic coast. We performed high-resolution screening of selected haplogroups in this Mor-occan sample: haplogroup H, in order to get more evidence on North Mediterranean influence; and hap-logroup L3, one of the most geographically diversified sub-Saharan haplogroup. For the L3 haplogroup, we con-ducted the complete mtDNA sequencing of 8 L3 haplo-types from El Jadida, and compared the complete North African L3 sequences which have been described [14,20-22] with the many other known sub-Saharan sequences (summed up in [23]). We also performed ana-lyses of geographical interpolation for sub-Saharan hap-logroup frequencies across Africa, by using an extended database summing up 4908 individuals.
Methods
Samples and DNA extraction
Blood samples were collected from 81 unrelated people from El Jadida, Morocco, nearly 100 km south of Casa-blanca. Appropriate informed consent was obtained from all individuals and total DNA was extracted from blood using a standard Chelex 100 protocol.
mtDNA amplification and sequencing
The mtDNA hypervariable regions I and II (HVRI and HVRII) were amplified as described elsewhere [24], in both forward and reverse directions. The amplified
samples were purified with Microspin S-300 HR col-umns (GE Healthcare, Uppsala, Sweden) and automated sequencing was carried out in an ABI Prism 3100 (AB Applied Biosystems, Foster City, CA, USA) using the kit Big-Dye Terminator Cycle Sequencing Ready Reaction (AB Applied Biosystems, Foster City, CA, USA). Tem-peratures profile for sequencing reactions consisted in denaturation at 96°C for 4 min and 35 cycles of 96°C for 15 s, 50°C for 9 s and 60°C for 2 min, followed by 60°C for 10 min. Sequence editing was performed both by using the BioEdit version 7.0.4.1 [25] and by manu-ally checking the electropherograms, tasks performed by two independent investigators.
Haplogroup H variation was dissected in a total of 14 samples according to [26], which basically consisted in sequencing four mtDNA coding-region segments encompassing the principal diagnostic positions in hap-logroup H samples: 3001-3360, 3661-4050, 4281-4820, and 6761-7050 (a total of 1580 base pairs). Furthermore, haplogroup L3 variation was investigated in 8 samples by performing complete sequence of the molecule (~16,569 bp) as described in [27], in a total of 32 over-lapping segments of around 600 bp each. The 8 com-plete mtDNA sequences are deposited in GenBank database with accession numbers: GU455415-GU455422.
Haplogroup affiliation
Mutations were scored relatively to the revised Cam-bridge Reference Sequence (rCRS; [28]), and its posi-tions numbered from 1 to 16569. For haplogroup affiliation, the most recent phylogenetic data, including information from complete sequencing, were followed: for H [29]; for K [2]; for J, R, T, and V [30]; for U [30,31]; for I and M1 [32]; for X [33]; and for L [14].
Statistical analyses
Analysis of population structure, molecular diversity measures, and tests of selective neutrality were executed in the software Arlequin version 3.0 [34].
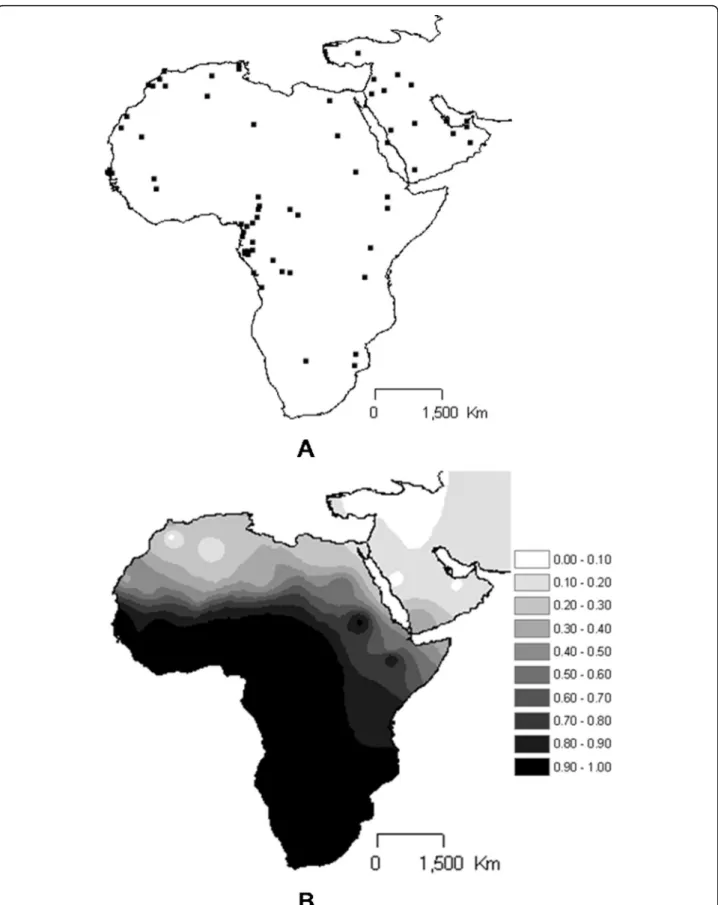
To determine and visualize the geographical distribu-tion of haplogroups L interpoladistribu-tion maps were drawn by using the “Spatial Analyst Extension” of ArcView ver-sion 3.2 http://www.esri.com/software/arcview/. The “Inverse Distance Weighted” (IDW) option with a power of two was used for the interpolation of the sur-face. IDW assumes that each input point has a local influence that decreases with distance. The geographic location used is the centre of the distribution area, from where the individual samples of each population were collected. Data for other populations were taken from several publications and are summed up in Additional File 1 and displayed in Figure 2A.
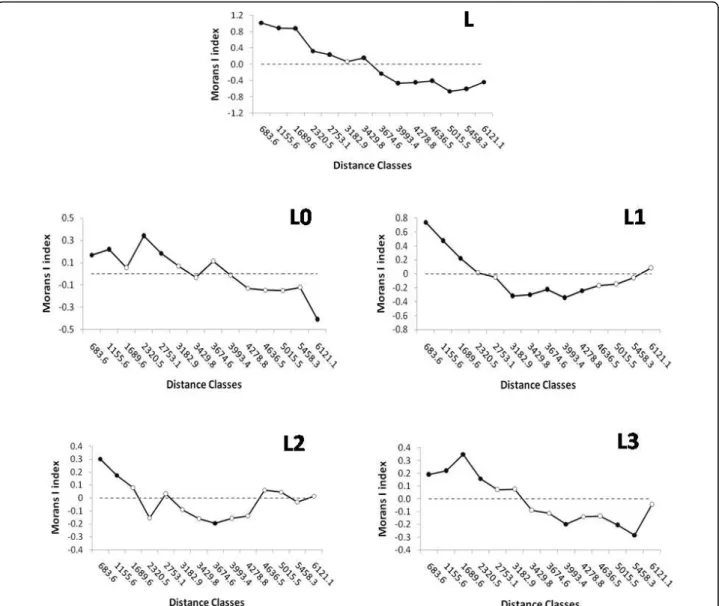
Correlograms for Morans I indices versus distances were obtained for the total L in the populations and for L0, L1, L2 and L3 proportions of the sub-Saharan pool in the samples by using the PaSSAGE software v 1.0 [37]. The existence of a cline is assumed when a continuous decline trend composed of statistical significant points is observed.
Results and Discussion
mtDNA diversity and haplogroup affiliation in El Jadida sample
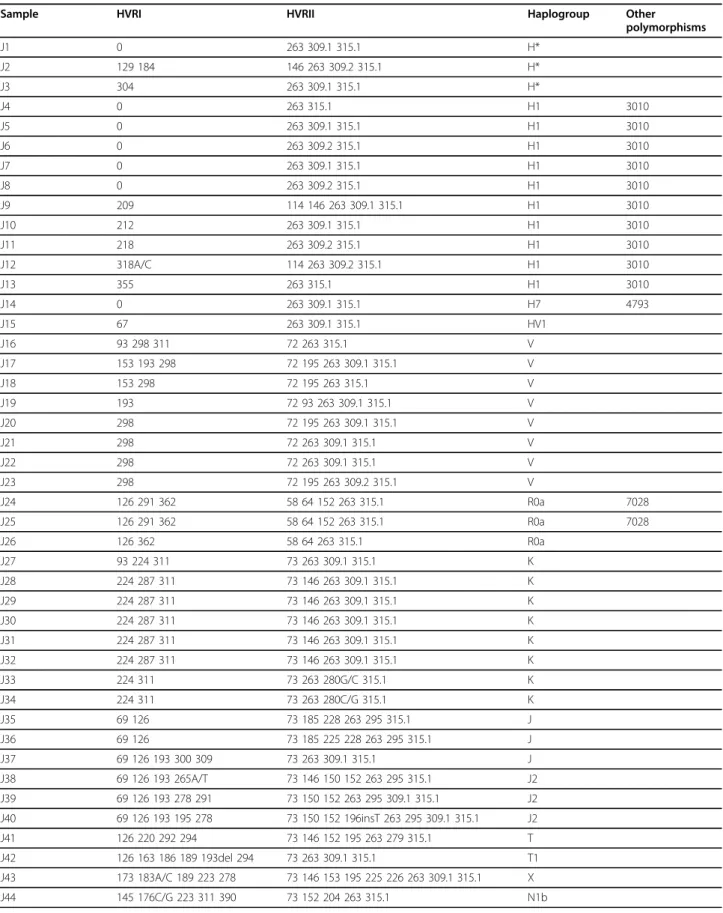
The characterization of HVRI and HVRII diversities in the 81 individuals from El Jadida led to the identifica-tion of the haplotypes reported in Table 1. The HVRI mtDNA diversity observed (Table 2) was, in general, as high as observed in other North African populations [4-6] and the Fu’s Fs values for the neutrality tests were significantly negative, in accordance with populations in expansion, except, notoriously for the Libyan Tuaregs reported by [38].
The analysis of molecular variance (AMOVA) was performed in order to evaluate genetic structure within North Africa, revealing a residual 3% variation between populations. Relatively to pairwise FSTgenetic distances (not shown), the only significant values after Bonferro-ni’s correction were between El Jadida-Algeria (0.061; p value = 0.000 ± 0.000), El Jadida-Tuaregs from Libya (0.022; p = 0.000 ± 0.000), El Jadida-Morocco-Berbers (0.027; p = 0.000 ± 0.000) and El Jadida-El Alia from Tunisia (0.024; p = 0.000 ± 0.000).
When analyzing the proportions of sub-Saharan and West Eurasian mtDNA haplogroups (Table 1) in El Jadida population, the characteristic mixed pool was observed, with frequencies of 30.86% and 69.14%, respec-tively. The sub-Saharan pool presented the branches L1, L2 and L3, in the following frequencies: 24%, 28% and 48% of the sub-Saharan pool. The basal haplogroup L0 was absent. In the West Eurasian pool, the haplogroups said to have been introduced into North and East Africa as result of a Back-to-Africa migration from the Near
East, U6 and M1, were observed with frequencies of 2.47% and 6.17% in El Jadida.
Clearly, the main component of the West Eurasian lineages was made of possible Iberian expanded lineages following the post-glacial climate improvement: H1 (12.35%), V (9.88%) and U5b (1.23%). There were low frequent lineages belonging to the HV branch of the maternal tree which could have come to El Jadida from the Near East, (H* - 3.70%; H7 - 1.23%; HV1 - 1.23%) as well as R0a (3.70%), X (1.23%), N1b (1.23%), J (7.41%), T (2.47%). There was also a considerable amount of U/K lineages, besides the already referred U6 and U5a: K (9.88%), U* (3.70%) and U4 (1.23%). Curiously, five out of eight K individuals in El Jadida presented a sub-stitution on position 16287 (besides the haplogroup defining 16224-16311 polymorphisms); this haplotype was so far observed in 1 Italian (belonging to sub-hap-logroup K1a4) and two Moroccan individuals (sub-hap-logroup K1a2) out of 789 K sequences in [2] and absent in other North African populations [6].
Sub-Saharan haplogroups across North Africa
Based on a database summing up 4908 African and 2178 Near Eastern/Arabian Peninsula individuals (Figure 2A shows sample locations, further indicated in Addi-tional File 1) we assayed interpolation analyses of L hap-logroup frequencies. As can be seen in Figure 2B, the north to south increase of frequency across North Africa and the Sahara is visible. In the East of the African con-tinent, the highest L frequencies are attained in more southern latitudes than in the rest of the continent, due to presence of M and some N (R0a and U6) lineages, especially high in Ethiopia.
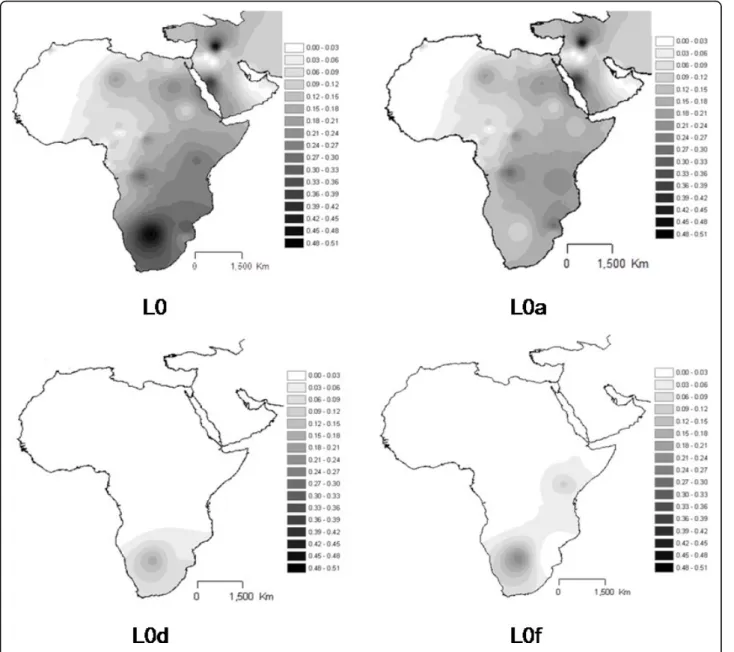
We then focused attention in the region across Sahara, for each of the main L haplogroups. When interpolation analyses are performed for the frequencies in total population, any sign of gradient across the Sahara is lost, as differences between L frequencies southern and northern of the desert are high. For this reason, interpo-lation analyses were performed for the frequencies of each haplogroup in the L pool, enhancing the possibility of detecting gradients across the Sahara.
L0 (Figure 3) attains the higher proportion inside L pool in East Africa, including the Near East and Arabian Peninsula, following a decreasing frequency from south towards north. This pattern is coincident with the one for haplogroup L0a, while L0d and L0f are almost restricted to the south.
Table 1 Haplotypes (for HVRI, HVRII and the four coding segments typed in possible H samples) and haplogroup classification in El Jadida
Sample HVRI HVRII Haplogroup Other
polymorphisms
J1 0 263 309.1 315.1 H*
J2 129 184 146 263 309.2 315.1 H*
J3 304 263 309.1 315.1 H*
J4 0 263 315.1 H1 3010
J5 0 263 309.1 315.1 H1 3010
J6 0 263 309.2 315.1 H1 3010
J7 0 263 309.1 315.1 H1 3010
J8 0 263 309.2 315.1 H1 3010
J9 209 114 146 263 309.1 315.1 H1 3010
J10 212 263 309.1 315.1 H1 3010
J11 218 263 309.2 315.1 H1 3010
J12 318A/C 114 263 309.2 315.1 H1 3010
J13 355 263 315.1 H1 3010
J14 0 263 309.1 315.1 H7 4793
J15 67 263 309.1 315.1 HV1
J16 93 298 311 72 263 315.1 V
J17 153 193 298 72 195 263 309.1 315.1 V
J18 153 298 72 195 263 315.1 V
J19 193 72 93 263 309.1 315.1 V
J20 298 72 195 263 309.1 315.1 V
J21 298 72 263 309.1 315.1 V
J22 298 72 263 309.1 315.1 V
J23 298 72 195 263 309.2 315.1 V
J24 126 291 362 58 64 152 263 315.1 R0a 7028
J25 126 291 362 58 64 152 263 315.1 R0a 7028
J26 126 362 58 64 263 315.1 R0a
J27 93 224 311 73 263 309.1 315.1 K
J28 224 287 311 73 146 263 309.1 315.1 K
J29 224 287 311 73 146 263 309.1 315.1 K
J30 224 287 311 73 146 263 309.1 315.1 K
J31 224 287 311 73 146 263 309.1 315.1 K
J32 224 287 311 73 146 263 309.1 315.1 K
J33 224 311 73 263 280G/C 315.1 K
J34 224 311 73 263 280C/G 315.1 K
J35 69 126 73 185 228 263 295 315.1 J
J36 69 126 73 185 225 228 263 295 315.1 J
J37 69 126 193 300 309 73 263 309.1 315.1 J
J38 69 126 193 265A/T 73 146 150 152 263 295 315.1 J2
J39 69 126 193 278 291 73 150 152 263 295 309.1 315.1 J2
J40 69 126 193 195 278 73 150 152 196insT 263 295 309.1 315.1 J2
J41 126 220 292 294 73 146 152 195 263 279 315.1 T
J42 126 163 186 189 193del 294 73 263 309.1 315.1 T1
J43 173 183A/C 189 223 278 73 146 153 195 225 226 263 309.1 315.1 X
J44 145 176C/G 223 311 390 73 152 204 263 315.1 N1b
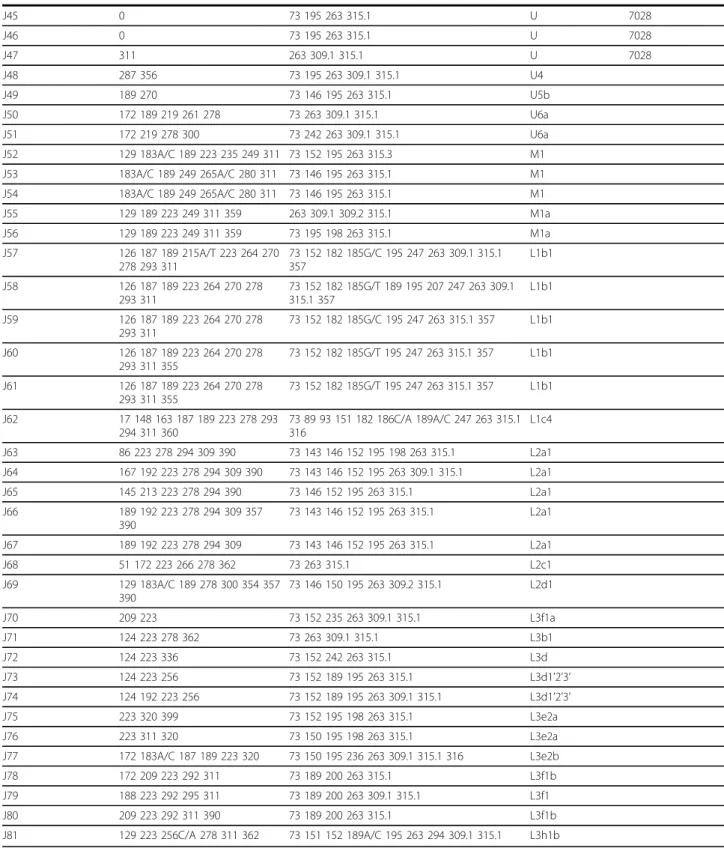
Table 1: Haplotypes (for HVRI, HVRII and the four coding segments typed in possible H samples) and haplogroup classification in El Jadida(Continued)
J45 0 73 195 263 315.1 U 7028
J46 0 73 195 263 315.1 U 7028
J47 311 263 309.1 315.1 U 7028
J48 287 356 73 195 263 309.1 315.1 U4
J49 189 270 73 146 195 263 315.1 U5b
J50 172 189 219 261 278 73 263 309.1 315.1 U6a
J51 172 219 278 300 73 242 263 309.1 315.1 U6a
J52 129 183A/C 189 223 235 249 311 73 152 195 263 315.3 M1
J53 183A/C 189 249 265A/C 280 311 73 146 195 263 315.1 M1
J54 183A/C 189 249 265A/C 280 311 73 146 195 263 315.1 M1
J55 129 189 223 249 311 359 263 309.1 309.2 315.1 M1a
J56 129 189 223 249 311 359 73 195 198 263 315.1 M1a
J57 126 187 189 215A/T 223 264 270
278 293 311
73 152 182 185G/C 195 247 263 309.1 315.1 357
L1b1
J58 126 187 189 223 264 270 278
293 311
73 152 182 185G/T 189 195 207 247 263 309.1 315.1 357
L1b1
J59 126 187 189 223 264 270 278
293 311
73 152 182 185G/C 195 247 263 315.1 357 L1b1
J60 126 187 189 223 264 270 278
293 311 355
73 152 182 185G/T 195 247 263 315.1 357 L1b1
J61 126 187 189 223 264 270 278
293 311 355
73 152 182 185G/T 195 247 263 315.1 357 L1b1
J62 17 148 163 187 189 223 278 293
294 311 360
73 89 93 151 182 186C/A 189A/C 247 263 315.1 316
L1c4
J63 86 223 278 294 309 390 73 143 146 152 195 198 263 315.1 L2a1
J64 167 192 223 278 294 309 390 73 143 146 152 195 263 309.1 315.1 L2a1
J65 145 213 223 278 294 390 73 146 152 195 263 315.1 L2a1
J66 189 192 223 278 294 309 357
390
73 143 146 152 195 263 315.1 L2a1
J67 189 192 223 278 294 309 73 143 146 152 195 263 315.1 L2a1
J68 51 172 223 266 278 362 73 263 315.1 L2c1
J69 129 183A/C 189 278 300 354 357
390
73 146 150 195 263 309.2 315.1 L2d1
J70 209 223 73 152 235 263 309.1 315.1 L3f1a
J71 124 223 278 362 73 263 309.1 315.1 L3b1
J72 124 223 336 73 152 242 263 315.1 L3d
J73 124 223 256 73 152 189 195 263 315.1 L3d1’2’3’
J74 124 192 223 256 73 152 189 195 263 309.1 315.1 L3d1’2’3’
J75 223 320 399 73 152 195 198 263 315.1 L3e2a
J76 223 311 320 73 150 195 198 263 315.1 L3e2a
J77 172 183A/C 187 189 223 320 73 150 195 236 263 309.1 315.1 316 L3e2b
J78 172 209 223 292 311 73 189 200 263 315.1 L3f1b
J79 188 223 292 295 311 73 189 200 263 309.1 315.1 L3f1
J80 209 223 292 311 390 73 189 200 263 315.1 L3f1b
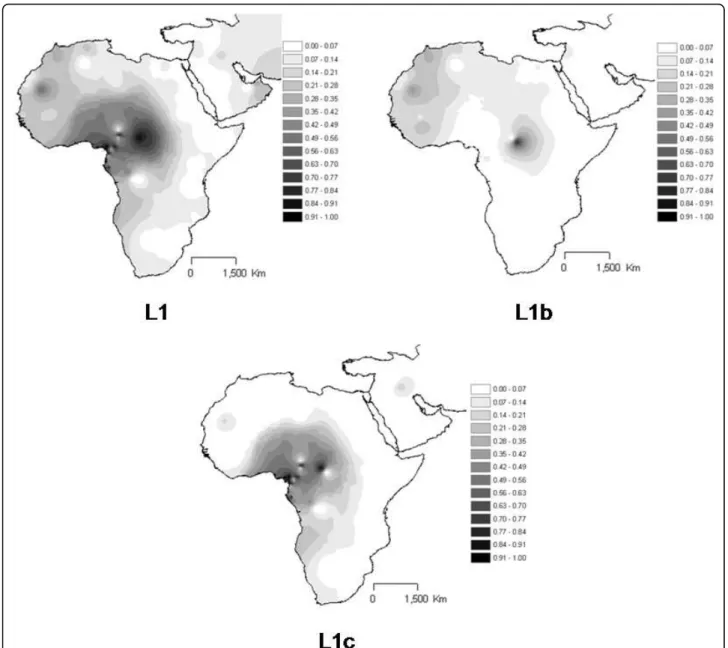
J81 129 223 256C/A 278 311 362 73 151 152 189A/C 195 263 294 309.1 315.1 L3h1b
Central Africa. The presence of this haplogroup in Near East and Arabian Peninsula is quite limited.
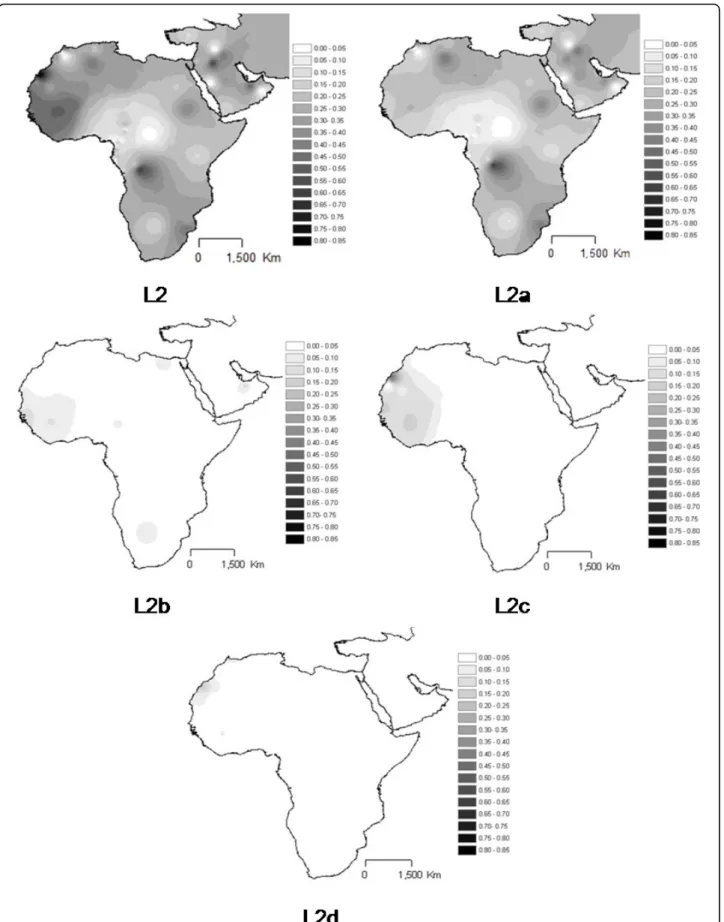
L2 total (Figure 5) is one of the two dominant hap-logroups in the L pool, in many regions across Africa, namely in central-west and south-east regions, most probably due to Bantu expansion [11,12] and towards north-west, potentially due to the trans-Saharan slave trade. The very central African populations, mostly Pygmy groups, present low proportions of L2 lineages in its pool. This pattern is caused mainly by sub-haplogroup
L2a, the most frequent lineage in L2, while L2b, L2c and L2d attain highest proportions in the west coast between Senegal and Mauritania.
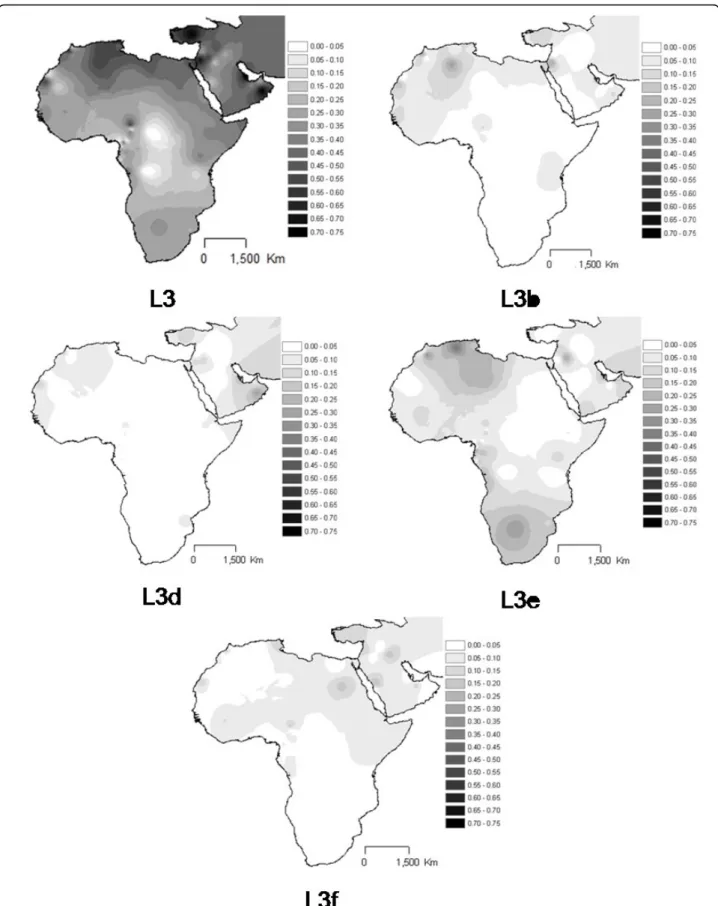
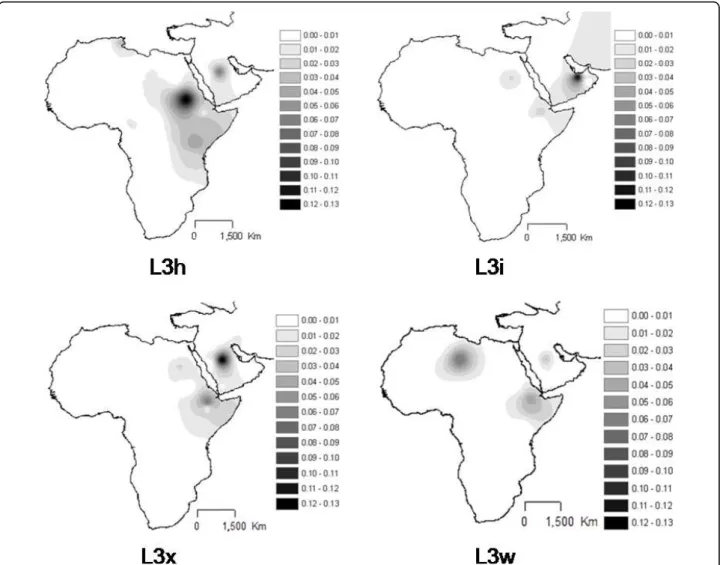
L3 total (Figure 6) reaches the highest proportions in North and then east Africa. The sub-haplogroups L3b and L3d clearly dominate in the west, as known before, as well as in North Africa. L3e has a more central dis-persion across Sahara, being also frequent in South Africa. L3f has an eastern localization across the Sahara, with some foci in Central Africa southern of Sahara,
Table 2 Diversity measures in El Jadida and neighbour populations, within HVRI
Sample n Different
sequences (%)
Haplotype Diversity (SE)
Nucleotide Diversity (SE)
Mean no. pairwise differences (SE)
Tajima’s D (p value)
Fu’s Fs (p value)
El Jadida 81 59 (73%) 0.982 (0.008) 0.017 (0.009) 5.945 (2.866) -1.777 (0.007) -25.241
(0.000)
Algeria 86 31 (36%) 0.945 (0.010) 0.013 (0.007) 4.822 (2.377) -1.090 (0.129) -13.198
(0.002)
Morocco Berber 60 38 (63%) 0.963 (0.015) 0.013 (0.007) 4.594 (2.287) -1.862 (0.012) -25.683
(0.000)
Morocco non-Berber 32 29 (91%) 0.988 (0.014) 0.017 (0.009) 6.026 (2.948) -1.735 (0.022) -24.805
(0.000)
Souss 50 34 (68%) 0.961 (0.018) 0.013 (0.007) 4.604 (2.298) -1.551 (0.034) -25.618
(0.000)
Testour 50 36 (72%) 0.958 (0.021) 0.016 (0.009) 5.783 (2.814) -1.867 (0.008) -25.269
(0.000)
Slouguia 28 20 (71) 0.971 (0.018) 0.015 (0.008) 5.254 (2.618) -1.472 (0.055) -10.159
(0.000)
El Alia 48 27 (56%) 0.960 (0.016) 0.015 (0.008) 5.507 (2.695) -1.385 (0.060) -12.910
(0.000)
Qalaat El Andalous 29 17 (59%) 0.946 (0.024) 0.012 (0.007) 4.493 (2.278) -0.946 (0.180) -6.559
(0.003)
Tunis 51 44 (86%) 0.992 (0.006) 0.018 (0.010) 6.512 (3.131) -1.717 (0.024) -25.154
(0.000)
Zriba 35 17 (49%) 0.926 (0.028) 0.015 (0.008) 5.398 (2.665) -1.156 (0.130) -3.863
(0.076)
Kesra 43 30 (70%) 0.960 (0.020) 0.018 (0.010) 6.405 (3.094) -1.611 (0.027) -17.708
(0.000)
Skira 20 14 (70%) 0.937 (0.043) 0.011 (0.007) 4.137 (2.148) -1.598 (0.045) -6.234
(0.003)
Egypt 68 59 (87%) 0.993 (0.005) 0.020 (0.010) 7.075 (3.362) -1.768 (0.016) -25.013
(0.000)
Ethiopia 89 69 (78%) 0.990 (0.005) 0.023 (0.012) 8.145 (3.815) -1.705 (0.018) -24.759
(0.000)
Mauritania 30 23 (77%) 0.975 (0.017) 0.017 (0.009) 6.025 (2.953) -0.738 (0.255) -12.983
(0.000)
Nubia 80 53 (66%) 0.977 (0.008) 0.023 (0.012) 8.203 (3.844) -1.420 (0.056) -24.779
(0.000)
Senegal 50 42 (84%) 0.989 (0.008) 0.017 (0.009) 6.283 (3.032) -1.127 (0.141) -25.208
(0.000)
Serer 23 21 (91%) 0.992 (0.015) 0.023 (0.012) 8.340 (4.009) -1.036 (0.152) -11.679
(0.000)
Libya 129 20 (16%) 0.677 (0.046) 0.011 (0.006) 3.983 (2.005) -1.254 (0.088) -2.726
(0.223)
due to high frequencies of L3f3 in Chadic-speaking groups [1]. L3h, L3i, L3w and L3x (Figure 7) are rare and clearly limited to East Africa.
When the spatial autocorrelation analysis was applied to the total L frequency in the populations, and to the L0, L1, L2 and L3 proportions of the sub-Saharan pools in the samples, signs of cline were evident for all them (Figure 8). The positive values at small distances indi-cate that individuals from the same population are more similar to each other; while the negative values at the largest distances (not so clear for L1 and L2) suggest a marked genetic differentiation across the African conti-nent and Arabian Peninsula.
Complete L3 sequences
We performed the complete sequencing of 8 L3 different haplotypes observed in El Jadida. This haplogroup was selected because it is the most diversified sub-Saharan haplogroup in El Jadida and some of its lineages could have been inputted in North Africa from East Africa. The complete sequencing allowed the fine characterization of these samples as follows (Figure 9): one L3b1, two L3d1’2’3, one L3e2b, one L3f1a, two L3f1b and one L3h1b. Joining these 8 complete L3 sequences to 236 pre-viously published ones (the ones summed up in [1,14,20-22]), a good resolution of L3(xM, N) tree is obtained (Additional File 2; information for samples
used is listed in Additional File 3). There are 39 sequences from North Africa, representing 16% of the complete L3 dataset, being 10 from Morocco, one from Algeria, four from Libya, 11 from Tunisia, and 13 from Egypt. So this work raised the homogeneity of complete L3 sequences across North Africa.
Most of these North African sequences share a recent ancestry with sequences observed in other parts of Africa, in the Holocene period (Table 3). This seems to point to a recent introduction of these lineages in North Africa from the original locations in sub-Saharan and East Africa. Namely, one Moroccan and one Libyan sequences belong to sub-haplogroup L3b1b, together with two West African sequences from Burkina, with a coalescence age of 9,926 ± 2,555 years. Three Egyptian,
four Tunisian, one Libyan and one Moroccan sequences share a most recent common ancestor of 13,537 ± 1,058 years old with seven West African, two South African, six Americans (most probably African-descents), two East Africans, two Central Africans, five Near Eastern and two South Asians, being affiliated in haplogroup L3b1a. A Moroccan sequence shares an ancestry with one sequence from Guinea-Bissau of around 13,370 ± 4,205 years old, inside haplogroup L3b2. One Tunisian L3d1c sequences share an ancestor with one American African-descent at 9,246 ± 3,444 years ago. One Tuni-sian shares an ancestor at around 6,549 ± 2,883 years ago with one Syrian inside L3d1’2’3 haplogroup. One Tunisian and one Egyptian together with four indivi-duals from Burkina, one from Guinea Bissau and two
Americans share an ancestor at 14,179 ± 2,352 years ago, belonging to the haplogroup L3e2a. In haplogroup L3e2b, two Egyptians and one Moroccan share a most recent common ancestor at 11,985 ± 1,529 years ago with one Ethiopian, one Zaire, three West Africans and five Americans (with an younger co-ancestry between the Egyptian and one American at around 1,287 ± 1,278 years ago inside L3e2b2). One Egyptian, one Libyan and one Tunisian L3e5 sequences share an ancestor of 11,516 ± 2,264 years with one Burkina, one Ethiopian, one Sudanese and one American (with a somewhat younger co-ancestry between the Tunisian and the Ethiopian at around 10,610 ± 3,704 years ago). A Moroccan L3f1a shares a common ancestor with one Chadic sample at 14,766 ± 4,448 years ago. L3f1b hap-logroup, having a most recent common ancestor of 14,710 ± 1,227 years old, bears some sequences from North Africa (two Egyptians and two Moroccan), and many other from other African locations and Near
Eastern, with one Egyptian sample having an younger co-ancestor, at 4,343 ± 2,388 years ago, with one Jorda-nian and one American.
A few L3 sequences observed in North Africa have older co-ancestry with other sub-Saharan regions, but as this occurs in the rarer haplogroups (almost restricted to East Africa), most probably the scenario will change as these become better characterized. This is the case for one L3 × 2 sequence observed in Algeria, which shares an older most recent common ancestor with two Ethiopian, one Israeli and one Kuwait, at 33,165 ± 4,499 years ago, but one Ethiopian and the Israeli and Kuwait sequences share a younger ancestor at 19,012 ± 4,200. Also, one Egyptian L3f2b sequence shares an ancestor with a Chadic one at around 24,809 ± 5,935 years ago. For L3 h1a2 haplogroup, one Egyptian and one Leba-nese sequences share a coalescence age of 26,281 ± 6,139 years old. And for L3 h1b, with an age of 36,827 ± 3,772 years, one of the North African
sequences (one Tunisian and one Moroccan) has a most recent common ancestor of 14,766 ± 4,448 years old with a sequence from Guinea Bissau.
So far, the two only complete published samples belonging to haplogroup L3k have a North African ori-gin, one from Libya and one from Tunisia. This hap-logroup has a coalescent age of around 29,251 ± 6,524 years old. As it is impossible to identify this haplogroup based only in control region information (only through HVRII polymorphism at position 235), it is impossible to add additional information about this haplogroup.
Conclusions
The genetic information testifies that recent migrations were the main events leading to the mtDNA pool observed nowadays in Maghreb populations. The
ancestral Near Eastern pool, remnant of the ancient Back-to-Africa migration through the Levant around 40,000 years ago [9] is very restricted. Values for these haplogroups are around 8.6% in El Jadida and 10% in Tunisia [6]. A bulk of the West Eurasian lineages pre-sent in Maghreb populations is constituted by the typi-cal Iberian sub-haplogroups H and V (12.3% and 9.9%, respectively, in El Jadida). It is highly probable that these lineages did expand towards North Africa when they expanded to the rest of the European continent, from Iberia, around 14,000 years ago, as they are present in all North African populations, even in those not known as directly historically related with Iberia [6].
Recent mtDNA data have shown that considerable local population expansions occurred in Sahel nomadic populations around 4,000 years ago, following important
movements of northern and eastern African people towards the recently formed Sahel region. These local expansions were revealed in one branch of the typical East African haplogroups L3f, the L3f3 almost restricted to the Chadic-speaking nomadic groups [1] and in one branch of the typical Iberian haplogroup V in southern Tuareg populations [8]. Thus, the emergence of the modern Sahara, beginning some 4,000 years ago, har-dened existing geographical divisions and separated peo-ples, forcing the black Saharans into the oases or southwards into the more attractive lands of the Sahel.
This barrier in gene flow is evident when attending to the global L haplogroup frequencies in African popula-tions. There is a clear horizontal gradient across the continent, attaining values of 95% and higher in the Sahel region in West and Central Africa, but not in the Eastern African coast where those values are only reached around the border between Tanzania and Mozambique. The lower values for L frequencies in the eastern African coast are due to the southern migration of the Eurasian haplogroup M1, which is typical of East Africa. North Africa reaches L frequencies of 20-40%, while the Arabian Peninsula and the Near East have around 20-30% (only higher in Yemen).
The coalescence ages for the L sequences observed nowadays in North Africa shows the young ancestry of these lineages, which were originated in sub-Saharan Africa in the Holocene. This proves that sub-Saharan people did not leave traces in the maternal gene pool for the time of settlement of North Africa, some 40,000 years ago. And for sure, the continuous publishing of complete L sequences across Africa will reveal still younger ancestors between L sequences observed in both sides of the Saharan desert, bringing its introduc-tion into North Africa to more recent/historical times.
It is also relevant that the interpolation analyses of haplogroups inside the L pool across the Sahara revealed horizontal gradients, matching in a high extent the known trans-Saharan routes. The West is dominated by L1b, L2b, L2c, L2d, L3b and L3d. The Center has L3e and some L3f and L3w. The East bears L0a, L3h, L3i, L3x and, in common with the Center, L3f and L3w. L2a is almost everywhere, strengthening its dominance in the slave package, not only towards the New World, but also in the trans-Saharan trade.
Both these genetic evidences agree with historical data that the introduction of the Asiatic horse into North Africa around 2,000 years ago lengthened the reach of desert nomads’raiding and trading. Before this period, the few black slaves taken from time to time across the Sahara would have been seen on the far side of the Mediterranean as mere exotic household ornaments. But, it may be argued that there was no regular trans-Saharan trade system before the rise of the camel-mounted Berber nomad, in the first Christian centuries, and perhaps not even until after the arrival of the first camel-riding Muslim Arabs in North Africa, in the seventh century [39].
Additional file 1: Information for samples used in the interpolation analyses. Information about size, ethnic group, location and
bibliographic reference for samples used in the interpolation analyses.
Additional file 2: Phylogeny of complete L3 sequences. Phylogenetic tree reconstruction for 244 complete L3 sequences. Integers represent transitions when the suffixes“A”,“G”,“C”or“T”are appended and transversions when the suffixes“a”,“g”,“c”or“t”are appended. Deletions are indicated by a“d”following the deleted nucleotide position. Underlined nucleotide positions appear more than once in the tree. TMRCAs are represented inside boxes.
Additional file 3: Information for samples used in the phylogeny of complete L3 sequences. Information about location, bibliographic reference and GenBank Accession Number for samples used in the phylogeny of complete L3 sequences.
Acknowledgements
The Portuguese Foundation for Science and Technology (FCT) granted the research project (PTDC/ANT/66275/2006). IPATIMUP is an Associate Laboratory of the Portuguese Ministry of Science, Technology and Higher Education and is partially supported by FCT. Researchers’mobility was
Table 3 Age estimates and standard deviations (in years) for the Most Recent Common Ancestor for the related lineages in North and sub-Saharan Africa
Clade Related lineages Age ± standard deviation (years)
L3b1b 4-7 9,926 ± 2,555
L3b1a 8-39, 229, 230, 233 13,537 ± 1,058
L3b2 42, 234 13,370 ± 4,205
L3d1c 61, 62 9,246 ± 3,444
L3d1’2’3 76, 231 6,549 ± 2,883
L3e2a 107-115 14,179 ± 2,352
L3e2b 116-129, 235, J77 11,985 ± 1,529
L3e2b2 128, 129 1,287 ± 1,278
L3e5 144-148, 232 11,516 ± 2,264
L3e5 147, 232 10,610 ± 3,704
L3f1a 165, J70 14,766 ± 4,448
L3f1b 167-189, 214, 236, J78, J80 14,710 ± 1,227
L3f1b2 178, 179, 236 4,343 ± 2,388
L3f2b 192, 193 24,809 ± 5,935
L3h1a2 199, 200 26,281 ± 6,139
L3h1b 204-210, J81 36,827 ± 3,772
L3h1b 204, J81 14,766 ± 4,448
L3 × 2 155-159 33,165 ± 4,499
supported by the Cultural, Technical and Scientific Agreement between Portugal and Morocco.
Author details
1
Laboratoire d’Anthropogénétique, Départment de Biologie, Faculté des Sciences, Université Chouaïb Doukkali, El Jadida, Morocco.2Instituto de Patologia e Imunologia Molecular da Universidade do Porto (IPATIMUP), Porto, Portugal.3Institute of Integrative and Comparative Biology, Faculty of Biological Sciences, University of Leeds, Leeds, UK.4Medical Faculty, University of Porto, Portugal.
Authors’contributions
NH, MDC and MK carried out the molecular genetic studies. NH, MDC, VF, MK and JBP conducted the sequence alignment and editing, assigned sequences to haplogroups, estimated ages for lineages and performed the general statistical analyses for evaluation of genetic diversity. NMS MDC and VF performed the interpolation analyses. LP designed the study, supervised the work and drafted the manuscript in collaboration with the other authors. All authors read and approved the final manuscript.
Received: 28 September 2009 Accepted: 10 May 2010 Published: 10 May 2010
References
1. Cerný V, Fernandes V, Costa MD, Hájek M, Mulligan CJ, Pereira L:Migration of Chadic speaking pastoralists within Africa based on population structure of Chad Basin and phylogeography of mitochondrial L3f haplogroup.BMC Evol Biol2009,9:63.
2. Behar DM, Metspalu E, Kivisild T, Achilli A, Hadid Y, Tzur S, Pereira L, Amorim A, Quintana-Murci L, Majamaa K, Herrnstadt C, Howell N, Balanovsky O, Kutuev I, Pshenichnov A, Gurwitz D, Bonne-Tamir B, Torroni A, Villems R, Skorecki K:The matrilineal ancestry of Ashkenazi Jewry: portrait of a recent founder event.Am J Hum Genet2006,
78:487-497.
3. Behar DM, Metspalu E, Kivisild T, Rosset S, Tzur S, Hadid Y, Yudkovsky G, Rosengarten D, Pereira L, Amorim A, Kutuev I, Gurwitz D, Bonne-Tamir B, Villems R, Skorecki K:Counting the founders: the matrilineal genetic ancestry of the Jewish Diaspora.PLoS One2008,3:e2062.
4. Plaza S, Calafell F, Helal A, Bouzerna N, Lefranc G, Bertranpetit J, Comas D:
Joining the pillars of Hercules: mtDNA sequences show multidirectional gene flow in the western Mediterranean.Ann Hum Genet2003,
67:312-328.
5. Pereira L, Cunha C, Alves C, Amorim A:African female heritage in Iberia: a reassessment of mtDNA lineage distribution in present times.Hum Biol 2005,77:213-229.
6. Cherni L, Fernandes V, Pereira JB, Costa MD, Goios A, Frigi S, Yacoubi-Loueslati B, Amor MB, Slama A, Amorim A, El Gaaied AB, Pereira L:Post-last glacial maximum expansion from Iberia to North Africa revealed by fine characterization of mtDNA H haplogroup in Tunisia.Am J Phys Anthropol 2009,139:253-260.
7. Ennafaa H, Cabrera VM, Abu-Amero KK, González AM, Amor MB, Bouhaha R, Dzimiri N, Elgaaïed AB, Larruga JM:Mitochondrial DNA haplogroup H structure in North Africa.BMC Genet2009,10:8.
8. Pereira L, Cerný V, Cerezo M, Silva NM, Hájek M, Vašíková A, Kujanová M, Brdièka R, Salas A:Linking the sub-Saharan and West Eurasian gene pools: the maternal and paternal heritage of the Tuareg nomads from African Sahel.Eur J Hum Genet2010.
9. Olivieri A, Achilli A, Pala M, Battaglia V, Fornarino S, Al-Zahery N, Scozzari R, Cruciani F, Behar DM, Dugoujon JM, Coudray C, Santachiara-Benerecetti AS, Semino O, Bandelt HJ, Torroni A:The mtDNA legacy of the Levantine early Upper Palaeolithic in Africa.Science2006,314:1767-1770.
10. Brooks N, Chiapello I, Di Lernia S, Drake N, Legrand M, Moulin C, Prospero J:
The climate-environment nexus in the Sahara from prehistoric times to present day.The Journal of North African Studies2005,10:253-292. 11. Pereira L, Macaulay V, Torroni A, Scozzari R, Prata MJ, Amorim A:Prehistoric
and historic traces in the mtDNA of Mozambique: insights into the Bantu expansions and the slave trade.Ann Hum Genet2001,65:439-458. 12. Salas A, Richards M, De la Fe T, Lareu MV, Sobrino B, Sánchez-Diz P,
Macaulay V, Carracedo A:The making of the African mtDNA landscape.
Am J Hum Genet2002,71:1082-1111.
13. Salas A, Richards M, Lareu MV, Scozzari R, Coppa A, Torroni A, Macaulay V, Carracedo A:The African diaspora: mitochondrial DNA and the Atlantic slave trade.Am J Hum Genet2004,74:454-465.
14. Behar DM, Villems R, Soodyall H, Blue-Smith J, Pereira L, Metspalu E, Scozzari R, Makkan H, Tzur S, Comas D, Bertranpetit J, Quintana-Murci L, Tyler-Smith C, Wells RS, Rosset S, Genographic Consortium:The dawn of human matrilineal diversity.Am J Hum Genet2008,82:1130-1140. 15. Segal R:Islam’s black slaves: a history of Africa’s other black diasporaLondon:
Atlantic Books 2002.
16. Lovejoy PE:Transformations in Slavery - A History of Slavery in Africa Cambridge: Cambridge University Press 1983.
17. Richards M, Rengo C, Cruciani F, Gratrix F, Wilson JF, Scozzari R, Macaulay V, Torroni A:Extensive female-mediated gene flow from sub-Saharan Africa into near eastern Arab populations.Am J Hum Genet2003,72:1058-1064. 18. Kivisild T, Reidla M, Metspalu E, Rosa A, Brehm A, Pennarun E, Parik J,
Geberhiwot T, Usanga E, Villems R:Ethiopian mitochondrial DNA heritage: tracking gene flow across and around the gate of tears.Am J Hum Genet 2004,75:752-770.
19. Cerný V, Mulligan CJ, Rídl J, Zaloudková M, Edens CM, Hájek M, Pereira L:
Regional differences in the distribution of the sub-Saharan, West Eurasian, and South Asian mtDNA lineages in Yemen.Am J Phys Anthropol2008,136:128-137.
20. Maca-Meyer N, González AM, Larruga JM, Flores C, Cabrera VM:Major genomic mitochondrial lineages delineate early human expansions.BMC Genet2001,2:13.
21. Kujanová M, Pereira L, Fernandes V, Pereira JB, Cerný V:Near Eastern Neolithic genetic input in a small oasis of the Egyptian Western Desert.
Am J Phys Anthropol2009,140:336-346.
22. Costa MD, Cherni L, Fernandes V, Freitas F, Ammar El, Gaaied AB, Pereira L:
Data from complete mtDNA sequencing of Tunisian centenarians: testing haplogroup association and the“golden mean”to longevity.
Mech Ageing Dev2009,130:222-226.
23. Pereira L, Freitas F, Fernandes V, Pereira JB, Costa MD, Costa S, Máximo V, Macaulay V, Rocha R, Samuels DC:The diversity present in 5140 human mitochondrial genomes.Am J Hum Genet2009,84:628-640.
24. Pereira L, Prata MJ, Amorim A:Diversity of mtDNA lineages in Portugal: not a genetic edge of European variation.Ann Hum Genet2000,
64:491-506.
25. Hall TA:BioEdit: a user-friendly biological sequence alignment editor and analysis program for Windows 95/98/NT.Nucl Acids Symp Ser1999,41:95-98. 26. Pereira L, Richards M, Goios A, Alonso A, Albarran C, Garcia O, Behar DM,
Golge M, Hatina J, Al-Gazali L, Bradley DG, Macaulay V, Amorim A: High-resolution mtDNA evidence for the late-glacial resettlement of Europe from an Iberian refugium.Genome Res2005,15:19-24.
27. Pereira L, Gonçalves J, Franco-Duarte R, Silva J, Rocha T, Arnold C, Richards M, Macaulay V:No evidence for an mtDNA role in sperm motility: data from complete sequencing of asthenozoospermic males.
Mol Biol Evol2007,24:868-874.
28. Andrews RM, Kubacka I, Chinnery PF, Lightowlers RN, Turnbull DM, Howell N:Reanalysis and revision of the Cambridge reference sequence for human mitochondrial DNA.Nat Genet1999,23:147.
29. Achilli A, Rengo C, Magri C, Battaglia V, Olivieri A, Scozzari R, Cruciani F, Zeviani M, Briem E, Carelli V, Moral P, Dugoujon JM, Roostalu U, Loogvali EL, Kivisild T, Bandelt HJ, Richards M, Villems R, Santachiara-Benerecetti AS, Semino O, Torroni A:The molecular dissection of mtDNA haplogroup H confirms that the Franco-Cantabrian glacial refuge was a major source for the European gene pool.Am J Hum Genet2004,75:910-918. 30. Palanichamy MG, Sun C, Agrawal S, Bandelt HJ, Kong QP, Khan F, Wang CY,
Chaudhuri TK, Palla V, Zhang YP:Phylogeny of mitochondrial DNA macrohaplogroup N in India, based on complete sequencing: implications for the peopling of South Asia.Am J Hum Genet2004,
75:966-978.
31. Achilli A, Rengo C, Battaglia V, Pala M, Olivieri A, Fornarino S, Magri C, Scozzari R, Babudri N, Santachiara-Benerecetti AS, Bandelt HJ, Semino O, Torroni A:Saami and Berbers - an unexpected mitochondrial DNA link.
Am J Hum Genet2005,76:883-886.
33. Reidla M, Kivisild T, Metspalu E, Kaldma K, Tambets K, Tolk HV, Parik J, Loogväli EL, Derenko M, Malyarchuk B, Bermisheva M, Zhadanov S, Pennarun E, Gubina M, Golubenko M, Damba L, Fedorova S, Gusar V, Grechanina E, Mikerezi I, Moisan JP, Chaventré A, Khusnutdinova E, Osipova L, Stepanov V, Voevoda M, Achilli A, Rengo C, Rickards O, De Stefano GF, Papiha S, Beckman L, Janicijevic B, Rudan P, Anagnou N, Michalodimitrakis E, Koziel S, Usanga E, Geberhiwot T, Herrnstadt C, Howell N, Torroni A, Villems R:Origin and diffusion of mtDNA haplogroup X.Am J Hum Genet2003,73:1178-1190.
34. Excoffier L, Laval G, Schneider S:Arlequin ver 3.0: An integrated software package for population genetics data analysis.Evolutionary Bioinformatics Online2005,1:47-50.
35. Bandelt HJ, Forster P, Sykes BC, Richards MB:Mitochondrial portraits of human populations using median networks.Genetics1995,141:743-753. 36. Soares P, Ermini L, Thomson N, Mormina M, Rito T, Röhl A, Salas A,
Oppenheimer S, Macaulay V, Richards MB:Correcting for purifying selection: an improved human mitochondrial molecular clock.Am J Hum Genet2009,84:740-759.
37. Rosenberg MS:PASSAGE. Pattern Analysis, spatial statistics, and geographic exegesis. Version 1.1.Tempe: Arizona State University 2001. 38. Ottoni C, Martínez-Labarga C, Loogväli EL, Pennarun E, Achilli A, De
Angelis F, Trucchi E, Contini I, Biondi G, Rickards O:First genetic insight into Libyan Tuaregs: a maternal perspective.Ann Hum Genet2009,
73:438-448.
39. Wright J:The trans-Saharan slave tradeLondon: Routledge 2007.
doi:10.1186/1471-2148-10-138
Cite this article as:Harichet al.:The trans-Saharan slave trade–clues from interpolation analyses and high-resolution characterization of mitochondrial DNA lineages.BMC Evolutionary Biology201010:138.
Submit your next manuscript to BioMed Central and take full advantage of:
• Convenient online submission
• Thorough peer review
• No space constraints or color figure charges
• Immediate publication on acceptance
• Inclusion in PubMed, CAS, Scopus and Google Scholar
• Research which is freely available for redistribution