Internationalization strategies in
Iberoamerica
The case of Portuguese trade
This document has been prepared by Joaquim Ramos Silva, Consultant of the International Trade Unit, Division of International Trade and Integration Division of the Economic Commission for Latin America and the Caribbean (ECLAC).
The views expressed in this document, which has been reproduced without formal editing, are those of the author and do not necessarily reflect the views of the Organization.
United Nations Publication
LC/W.181
Copyright © United Nations, April 2008. All rights reserved Printed in Santiago, Chile – United Nations
Contents
Abstract ... 5
I. Overview of Portuguese trade strategy ... 7
II. Main changes in Portuguese trade after 1996... 13
A. Exports, imports and balance of trade in goods and services ... 13
B. Balance of payments and FDI flows: some relevant aspects for the study of Portuguese trade ... 17
C. Geographical concentration and diversification ... 20
D. Analysis of Portuguese exports: shifting from traditional to new products ... 22
III. The institutional framework of Portuguese trade strategy (I): the public agencies... 29
A. The programs supervised by the Ministry of Economy and Innovation – PRIME and QREN... 29
1. PRIME Program and SIME (Public Initiative with EU support) ... 29
2. From PRIME to QREN Program (Public Initiative with EU support) ... 30
B. AICEP (Agencia para o Investimento e o Comércio Externo de Portugal) – Agency for Investment and Foreign Trade of Portugal, and ICEP experience ... 30
C. IAPMEI (Instituto de Apoio as Pequenas e Médias Empresas a ao Investimento) – Institute of Support to Small and Medium Sized Enterprises and Investment ... 33
D. The Ministry of Foreign Affairs and the economic diplomacy issue... 34
IV. The institutional framework of Portuguese trade strategy (II): employers’ federations and related associations ... 35
A. AIP (Associacão Industrial Portuguesa, Confederacão Empresarial) – Portuguese Industrial Association, Confederation of Employers ... 35
B. Fórum para a Competitividade (FpC) and the report led by M. Porter ... 36
C. COSEC and the organization of credit and finance for exports ... 39
V. Trade relations with Spain, Brazil and other Iberoamerican countries ... 41
VI. Export performance of firms: some cases ... 45
VII. Concluding remarks ... 53
Abstract
The Portuguese trade strategy is an interesting analytical issue. Indeed, as a small economy and contrary to most other similar European countries, Portugal, in the post-war, was late and slowly integrated into the world economy. This was mainly due to the maintenance of an economic logic of empire that has only waned in the late 1960s; and, after a transitory period (1974-1985) where deep macroeconomic imbalances did not allowed a reversal of the trend to neglect the construction of an effective and large trade strategy, the EC membership in 1986 began to influence the substance and institutional framework in this key area for a country with its characteristics. This paper basically focuses on the evolution of Portuguese trade and internationalization strategies between 1996 and 2006.
I. Overview of Portuguese trade strategy
In this report we focus on the Portuguese trade strategy after 1996.1 A brief historical perspective is usual in the study of national trade strategies, and it is particularly necessary in the Portuguese case. Indeed, the country during the last six decades had experience of very different strategies that left their traces, which, in some grounds, have not yet completely disappeared. Hence, we start with the presentation of the main stages of Portuguese trade strategy in the post-war.
In the late 1940s and 1950s, unlike most Western European countries, Portugal maintained the interwar policies including an imperial perspective of economic “isolationism” and autarky. By the end of the fifties, exports to African and Asian colonies were at their highest point since the beginning of the 19th century (29% of the total in 1959, but only 12% in 1938),2 being the most important region of destination for Portuguese exports. However, it was under this very specific context that in 1949 was created the Fundo de Fomento de Exportações (FFE) “for the defense of Portuguese products in the foreign markets”, but bearing in mind especially traditional products not the export promotion in the modern sense. The FFE is the ancestor of ICEP, the main Portuguese organization in charge of the promotion of exports during the last decades, incorporated into AICEP in 2007, which will be described further in this report.
About a decade later, in an important historical step, Portugal was in 1960 a founding member of EFTA (European Free Trade Association), although within a special treatment clause for its imports inside this bloc. The country also became member of the GATT in 1962. Nonetheless, the move of Portuguese trade towards Europe was relatively slow till the middle of the 1960s. In fact, the ruling political group was still divided on its dilemma “Europe or Africa”. Only in 1967, exports towards EFTA+EEC3 overtook 50% of the total, while, during the decade, EFTA gradually became the main region of destination. The weight of Europe as a trading partner, and the decline of Africa, has only been clearly accelerated by the last years of the
1
The research underlying this report was carried out in June-August 2007. Some data were updated in February 2008 when the text was revised. I am grateful to all the people that were interviewed in the beginning of July 2007 (task jointly conducted with Nanno Mulder from CEPAL who wrote a first draft of the meetings) and for the relevant information provided by several institutions. I also had the statistical research assistance of Cristiano Cechella.
2
In this point, the figures concerning the Portuguese economy before the early 1990s come mostly from Mateus, 2006, Neves, 1996, and Silva, 1990 and 2002.
3
regime (the replacement of Salazar in 1968, although not the end of the dictatorship, facilitating the process). In 1973, exports to “Ultramar” (the official denomination of the colonies) were still at 14.8% of the total, and imports at 10.2%; in the following years however this trade collapsed, and despite some surges for the time being, only thirty years later a recovery seems to be perceptible.
During all this period the ratio of exports of goods to GDP remained low (13% in 1973, 11% in 1960, and 9% in 1947). As far as their composition is concerned, figure 1 shows the evolution of three economically representative groups of exports from the pre-wartime to 1990. It should be noted that in 1947, foodstuffs summed to raw materials still were 58.2% of the total exports, textiles, clothing and footwear 19.3%, and machinery and transport equipment a mere 1.6%. However, by the end of the former regime, in 1973, exports of raw materials and foodstuffs still represented 25% of the total, textiles, clothing and footwear 29.9%, but machinery and transport equipment had jumped to 13.2% (from only 3.4% in 1965).
FIGURE 1
THREE SECTORS OF PORTUGUESE EXPORTS, 1938-1990 (% TOTAL)
Source: Neves, 1996, p. 348. Foodstuffs
9.6 15.4 21.6 31.9 30.4
5,0 51.8
0 10 20 30 40 50 60
Textiles, clothing and footwear
37.5 32.9 29.9 25.8 15.7 19.3 10.4 0 10 20 30 40
Machinery and transport equipment
13.2
17.1 19.7
1.6 0.7
3.7 3.4 0
5 10 15 20
Up to the early seventies, therefore, the Portuguese economy was not much exposed to international trade, basically explored its natural resources and the strong development of tourism from the sixties onwards completed this “model”. In addition, during the two first post-war decades, the country experienced a large process of industrialization, by far the most important of its history, essentially based on the rationale of import substitution policies. In spite of that, after 1968, Portugal took clearly an outward orientation, near to the strategy of the newly industrialized countries, and its exports of manufactured goods grew above the world rate. Also, with a new executive body in 1970, FFE became more involved in the exports’ process.
With the 25 of April 1974, after a short period of high political and social instability, Portugal began a new era in its foreign economic relations. Political impediments removed, in 1977, the Portuguese government presented its demand of membership to EEC. Until 1985, however, Portugal “dived in a sea” of great macroeconomic imbalances, particularly in the external payments and public accounts (both deficits reaching, in percent, two digits of GDP in the most critical years). Two agreements were then established with the International Monetary Fund in 1978 and 1983, with the usual conditionality of that time. During this period, policymakers were mainly concerned with the management of short term macroeconomic difficulties; under these circumstances it was not easy to define any consistent trade strategy. Moreover, after a sharp decline in the contribution to the world exports, in 1977, Portugal started a gradual increase in its world share that lasted till the early 1990s (see figure 2). Because of higher inflation relative to its main trading partners, Portugal fell into a period of systematic devaluation of its currency in order to sustain price competitiveness what led to deterioration in the terms of trade.4 As a consequence, the weight of standardized industrial goods in exports, the most sensitive to this kind of competitiveness, was maintained if not reinforced; at the same time, many exporting firms were working under subcontracting schemes. Structural measures for the external sector were postponed in the name of the search for short term equilibriums and economic stabilization schemes.
FIGURE 2
PORTUGAL'S SHARE IN THE WORLD EXPORTS OF GOODS 1948-2006 0,17 0,48 0 0.1 0.2 0.3 0.4 0.5 0.6 1 9 4 8 1 9 5 1 1 9 5 4 1 9 5 7 1 9 6 0 1 9 6 3 1 9 6 6 1 9 6 9 1 9 7 2 1 9 7 5 1 9 7 8 1 9 8 1 1 9 8 4 1 9 8 7 1 9 9 0 1 9 9 3 1 9 9 6 1 9 9 9 2 0 0 2 2 0 0 5 Source: WTO. 4
A more positive legacy of this transitional period was the creation of the Instituto do Investimento Estrangeiro (IIE) in 1977, what, among other reasons, led to a substantial increase of the FDI inflows (often with significant impact on exports) till the beginning of the 1990s, enlarging the experience of the Portuguese economy with this increasingly key factor of the world economy. Later, IIE was absorbed by ICEP, but reappeared in 2002 as Agência Portuguesa de Investimentos (API). In July 2007, AIP and ICEP merged, and gave birth to the above referred to as AICEP.
Portugal became EC member in 1986, and a new stage of its development started, not only concerning foreign economic relations but also the macroeconomic, financial and regulatory context. It is important to stress that, in the six initial years and in relation to previous trends, the macroeconomic imbalances were fairly improved, although the public deficit and inflation rate remained excessive when compared to those of other European partners. In this period, high quantitative growth occurred (GDP grew at 6.1% on annual average in 1986-1990), but mainly in the non-tradable goods sector and public spending in particular soared. All this took place without competitive restructuring of the economy, we need only to take into account to what was, at the same time, happening in Ireland and Spain (with the usual costs like high unemployment), countries submitted to a very similar EU framework. One of the best examples of this posture was the increasing weight of the mostly uncompetitive traditional sector of textiles, clothing and footwear reaching 38.7% of total exports in 1991 (35.1% in 1985, and 30.1% in 1980). By the threshold of the 1990s, however, under a number of circumstances (events and economic trends) like the end of the transitional period to full membership, the drop in the domestic growth rate, and the participation of the escudo in the European Monetary System (April 1992), the imperious need for a true trade and competitiveness strategy began to loom on the horizon. To compete inside and outside the European Union, Portuguese firms should have strong competitive foundations, economically as well as financially, that did not exist and needed to be constructed. Nevertheless, the definition and implementation of such a strategy where various actors, public and private, should participate have revealed to be a highly complex and long enterprise in the Portuguese context. This is one of the main themes of the present report.
Summarizing the Portuguese trade strategy in the post-war:
• From the immediate post-war to 1959. The Portuguese economy was maintained in an autarkic mode of functioning; except for the colonies, the trade and investment links remained weak and at a low historical level; exports were mainly based on natural resources and agriculture products, or industries with low labor costs of the traditional sector.
• 1960-1973. The Portuguese trade becomes increasingly orientated towards Europe (EFTA+EEC), first, in the middle of some contradictions, this path was however strongly strengthened after 1968. At the same time, manufactured goods, traditional and new, quickly gained ground in exports.
beginning of systemic industrial restructuring that followed its aftermath, the features of this model appeared more as a handicap than an advantage for the internationalization of the Portuguese economy. In a way, we may conclude that this strategy arrived too late to be successful, and taking a lesson for the future: reforms must be implemented on time if not they will be more and more costly.
• 1974-1985. Taking into account the major economic and financial imbalances that emerged with the political transition to democracy, short-term macroeconomic management dominated trade issues and no consistent external strategy whatsoever was defined unless the search for closer links with EC at various levels. Due to successive devaluations of the escudo, price competitiveness substantially drove exports after 1977.
• 1986-1991: Despite membership in EC, in these initial years, the weight of traditional products increased in exports; in one hand, the effect of devaluations was still felt, and on the other hand, they “benefited” from some protection through Multi-Fiber Agreement (for example, in relation to Maghreb countries); the share of textiles, clothing and footwear reached an historical peak in the beginning of the 1990s; also, high growth in the non-tradable sector, and substantial transfers from the EU hid the international competitive weaknesses of the Portuguese economic structure.
• 1992 Onwards. Escudo enters in EMS, and Portuguese economy starts its way to Economic and Monetary Union (single European currency); without traditional instruments like the manipulation of the currency, competitive vulnerabilities become more and more evident, and Portugal’s share in world exports begins to gradually shrink, particularly in goods. By the middle of the 1990s, a program to strengthen competitiveness inspired by Michael Porter’s ideas5 was neither implemented nor monitored; up to the middle of the new decade slow progress or stagnation characterized trade performance what was aggravated by institutional instability in the national framework of trade and investment. Slowly, but effectively, the profile of exported goods was however shifting from traditional products of low technology to medium (low and high) technology what was probably more induced by the European process rather than by national policies. Also, after 2005, and in relation to 1996, diversification in the exports of goods and services is quite apparent from the geographical and composition perspectives; moreover, the great majority of flows of goods became more balanced, in some cases of services the flows passed from deficit to surplus. Is this an inaugural step of a new stage or a simple short-term twist?
5
The main points raised by this program will be summarized later in the point on the Forum para a Competitividade
II. Main changes in Portuguese trade after 1996
In this chapter, we give basic statistical information relevant for the design of a trade strategy. Firstly, we analyze Portuguese trade of goods and services (exports, imports, and the balance), focusing on the evolution post 1996. Secondly, we put the Portuguese trade in the wider context of the balance of payments and present the major trends of FDI flows, a topic of obvious interest for a comprehensive study of trade. Thirdly and fourthly, the geographical distribution and the breakdown of products, particularly of exports,6 are examined in some detail. Due to very recent changes in several flows, whenever possible, we discriminate year by year in the 2000s, otherwise they would be less or even not so well perceived.
A. Exports, imports and balance of trade in goods and services
To begin with exports of goods and services, they have increased during the period (either in euros or in USD; see figure 3), but far from stopping the decline of their share in the world exports that began in the first half of the 1990s (figure 4 reproduces and enlarges to other flows the figure 2). There is however a different performance between goods and services; the former shows a clear decrease that, due to its greater weight, influences more the overall balance of trade, although the latter’s share is near stability since 1998. Nevertheless, after a period of slow growth, and in relation to the previous year, 2006 witnessed a strong rebound in the export of goods 12.7%, and services 15.3% (rates calculated on the basis of current euros);7 an important outcome in light of the relative high value of the euro, but not yet enough to significantly reverse the asymmetry with the world trend. In this first approach to Portuguese trade since the nineties it
6
It must be noted that for the Portuguese economy and its strategy of internationalization, the study of exports should be highly emphasized. In fact, this major variable, studied through different techniques and instruments, shows well whether this economy is responsive or not to world demands, the non-responsiveness being one its main weaknesses during the last decades.
7
60,6 43.3 34,7 48,8 0 10 20 30 40 50 60 70
1996 1998 2000 2002 2004 2006
Goods in dollars Goods and serv. dollars
Goods euros Goods and serv. euros
must be highlighted that the balance of goods is traditionally in deficit, and in 2006, its ratio was at 0.76 improving in relation to 2000 and 1996. The balance of trade in services traditionally behaves quite the contrary, but also showing an increasing surplus since the middle of the nineties (1.53 in 2006, and 1.22 in 1996).
FIGURE 3
PORTUGUESE EXPORTS OF GOODS AND GOODS AND SERVICES, 1996-2006
(Thousand millions)
Sources: WTO and Banco de Portugal.
FIGURE 4
PORTUGAL’S SHARES IN THE WORLD EXPORTS OF GOODS AND SERVICES
Services Goods & services Goods 0.3 0.35 0.4 0.45 0.5 0.55 0.6 0.65 0.7 0.75 19 9 0 1 9 9 1 1 9 9 2 1 9 9 3 1 9 9 4 1 9 95 1 9 9 6 1 9 97 1 99 8 19 9 9 20 0 0 20 0 1 20 0 2 20 0 3 2 0 0 4 2 0 0 5 2 0 0 6 Source: WTO.
important insofar, at the same time, the ratio of exports of goods and services to GDP has also declined (see table 1).8 Unlike what happened in 1990, the Portuguese ratio in 2005 is clearly well below EU averages. Although there is some stagnation in the ratio since 1997, the comparative evolution is quite the opposite of the other EU partners that have increased in a few cases very substantially, and it is a proof that the problems of Portuguese exports have not been seriously tackled in the period under analysis.
TABLE 1
EU: EXPORTS OF GOODS AND SERVICES IN PERCENT OF THE GDP
(US Current prices)
1990 1997 2003 2005
Austria 37.7 39.7 48.5 53.5
Belgium 69.5 74.0 81.0 86.7
Denmark 37.2 38.9 45.4 48.8
Finland 22.5 38.7 38.6 41.8
France 21.3 25.7 25.6 26.0
Germany 24.8 27.5 35.6 40.9
Greece 15.3 16.6 17.9 18.4
Ireland 56.6 79.2 83.7 81.3
Italy 19.2 25.2 24.6 26.0
Luxemburg 98.4 120.5 135.1 156.3
Netherlands 56.5 63.3 63.0 69.8
Portugal 31.1 28.6 28.0 28.5
Spain 16.1 26.3 26.3 25.7
Sweden 29.8 41.4 43.5 48.5
United Kingdom 24.2 28.9 25.8 26.6
EU-12 25.7 31.0 33.2 35.4
EU-15 26.1 31.6 33.9 36.3
EU-25 25.9 31.7 34.1 36.9
(Mexico 38.6 30.3 27.8 30.0)
Source: OECD and Eurostat.
If we accept the theoretical assumption of the international economics textbooks that small countries have more advantages in being open than the big countries, i.e., in channeling more of their production to the global marketplace in order to benefit from scale effects, Portugal should show a relatively higher ratio of exports to GDP. In this light, a comparison with the other EU member states is necessary and useful. In 2005, such a ratio was for Portugal near some big EU economies like France, Italy, and UK (Germany evidences a much higher ratio)9; among small countries, only Greece has a lower position than Portugal.10 Looking more closely at this indicator, the contrast with neighboring Spain is rather striking, although also decreasing in relation to 1997, the Spanish ratio strongly increased since 1990, and both economies (the big one represented here by Spain, and the small one by Portugal) show a not so distant percentage of exports of goods and services in GDP in 2005: 25.7% (from 16.1%) and 28.5% (from 29.3%),
8
More precisely, the ratio of exports of services to GDP registered a slight increase from 1990 to 2005, and the loss was particularly felt in the exports of goods; in the whole, however, exports have decreased.
9
Even Mexico has a higher ratio (see bottom of the table 1).
10
respectively. Therefore, in this period, Portugal has clearly lagged behind many other countries, particularly EU member states, in taking advantage of the globalization potential.
We look now briefly at the composition of the Portuguese trade in goods and services, and its balances by groups of products. Table 2 shows the items where Portugal has a positive external balance in goods: only two in ten: clothing and footwear, and wood, cork and paper. In 2006, however, the ratio exports/imports has clearly been improved for all cases except clothing and footwear not only in relation to 2000, but also to 1996. It is interesting to observe that even imports of clothing and footwear have not increased their percentage in the total relative to the previous years that are considered, although the basic figures are quite different. Table 3 allows some similar conclusions about the trade in services. Again, in 2006, comparing with 1996, two of the most important items of this balance, transports and other services to business, became positive. This means that, beyond traditional travel and tourism (basically receipts of tourism), other significant items are now contributing to the rising surplus of services.
TABLE 2
PORTUGAL: BREAKDOWN OF EXPORTS AND IMPORTS, AND RATIO EXPORTS/IMPORTS BY MAIN GROUPS OF PRODUCTS (1996, 2000, 2006)
(Percent)
Exports Imports Exports/Imports
Groups of products
1996 2000 2006 1996 2000 2006 1996 2000 2006
Agric. & foodstuffs 7.4 6.4 8.6 13.8 10.7 12.0 37.7 36.9 54.2
Energy 2.3 1.3 5.6 7.6 4.7 15.7 21.0 15.2 27.0
Chemicals & plastics 5.9 7.6 10.5 12.8 13.9 13.9 32.0 38.6 57.1
Wood, cork & paper 9.3 10.1 8.8 4.2 4.4 3.2 156.3 145.9 208.1
Leather & textiles 7.5 6.4 5.0 8.8 6.2 4.4 59.5 69.1 86.0
Clothing & footwear 23.4 19.7 10.7 3.3 3.6 3.3 500.4 345.1 245.4
Minerals & metals 8.9 9.3 10.3 8.3 9.7 10.3 74.7 63.3 75.7
Machinery 16.1 18.8 19.9 21.2 22.9 19.9 53.2 56.4 75.6
Transport equipment 15.6 16.9 13.4 14.3 17.8 11.7 76.2 55.9 86.7
Miscellaneous 3.6 3.4 7.2 5.7 5.9 5.6 43.9 37.6 97.3
Total 100.0 100.0 100.0 100.0 100.0 100.0 69.9 61.0 75.7
Source: INE.
TABLE 3
PORTUGAL: TRADE IN SERVICES – MAIN STATISTICAL GROUPS 1996, 2001, 2006
(Million euros)
1996 2001 2006
Exp. Imp. Balance Exp. Imp. Balance Exp. Imp. Balance
Transports 1104 1348 -244 1767 2329 -562 3180 2835 345
Travel & tourism 3686 1763 1923 6124 2363 3761 6649 2625 4024
Communications 216 132 84 224 198 26 541 375 166
Construction 208 180 28 214 87 127 439 106 333
Insurance 41 74 -33 67 107 -40 94 186 -92
Financial services 181 140 41 118 156 -38 197 206 -9
Computer & inf. 31 86 -55 67 171 -104 148 239 -91
Royalties & license fees 15 210 -195 28 279 -251 65 277 -212
Other business services 496 732 -236 1582 1447 135 2475 1782 693
Personal, cultural & rec. 71 121 -50 157 285 -128 202 374 -172
Others 57 237 -180 143 202 -59 147 237 -90
Total 6106 5023 1083 10496 7627 2869 14141 9247 4894
Although we must take into account that very slow growth in GDP (on average 0.87% in 2001-2006), is depressing for imports, and high growth in the world exports, has the opposite effect on national exports; anyway, from the equilibrium point of view it is clear that, especially in the 2000s, there are indicators that the fundamentals of the Portuguese balance of trade in goods and services are improving, i.e., are becoming less vulnerable structurally speaking. As far as goods are concerned, in all items except one, the ratio exports/imports has increased, and the same happened in the main services’ flows. This does not blur the negative evolution of Portuguese trade before world trends since the early nineties, but it is perhaps a sign in the way to a better performance. However, because many of these moves are recent and some of them short term determined, the problem here lies in knowing whether or not they are sustained, and only the medium term can satisfactorily answer to this question.
B. Balance of payments and FDI flows: some relevant aspects
for the study of Portuguese trade
In the pursuit of this study, and before deepening our central issue, it is now necessary to look at the balance of payments as a whole, its equilibrium and most significant trends. According to the pattern of the last decades, the surplus of services is not enough to countervail the deficit in goods, both already referred to above, and the equilibrium in the current account was often reduced, more rarely reached, mainly through private transfers due to emigration. In an updated view, the gap of current account is also partially covered by the transfers of capital, coming basically from EU, that produce a surplus in the capital account as shown in table 4 for 2002-2006. It is worth noting that remittances play a decreasing positive role in the current equilibrium, what, beyond obvious exchange reasons,11 is also due to the shrinking of emigration and to the increment of immigration and concomitant moves of transfers.
TABLE 4
CURRENT ACCOUNT AND CAPITAL ACCOUNT
(Balance in percent of GDP)
2002 2003 2004 2005 2006
Current Account -8.1 -6.1 -7.7 -9.7 -9.5
Goods and services -7.9 -6.5 -7.6 -8.7 -7.6
Goods -10.4 -9.1 -10.4 -11.3 -10.8
Services 2.5 2.6 2.8 2.6 3.2
Travel & tourism 2.8 2.7 2.8 2.5 2.6
Revenue -2.3 -1.7 -2.0 -2.6 -3.5
Current transfers 2.2 2.1 2.0 1.5 1.6
Remittances of emigrants/immigrants 1.8 1.4 1.4 1.2 1.2
Capital Account 1.5 1.9 1.5 1.2 0.8
For memory:
Balance of current transf. + balance of capital 3.7 4.0 3.5 2.7 2.4
Current account + capital account -6.6 -4.2 -6.2 -8.6 -8.7
Source: INE and Banco de Portugal.
11
0 0.2 0.4 0.6 0.8 1 1.2 1.4 1.6 1.8
1985 1987 1989 1991 1993 1995 1997 1999 2001 2003 2005
The deficit resulting from the sum of current account12 plus capital account13 is, in its turn, covered by the flows of financial account (not shown in table 4). Although the detailed analysis of such flows is out of the reach of this report, some considerations on the subject must be done afterwards, especially as far as concerns foreign direct investment which is relevant for trade in several respects. Indeed, the analysis of FDI is necessary for a better understanding of some major developments of Portuguese trade since the nineties stemming from the internationalization strategy.14
According to the figure 5, the world share of FDI net inflows to Portugal presents similarity with the correspondent evolution of exports of goods and services, i.e., it is decreasing since 1992, despite higher values in some isolated years, particularly in 2001 and 2003. This means that in relative terms (as a general trend, the world FDI inflows have strongly been increased between 1985 and 2000), Portugal was not able of accompanying the steady global pace of these flows, and its weight has FDI destination has been reduced (and also, very likely, in its world stock). More precisely, the credit of FDI inflows remains significant but also their debit; in every year, positive net inflows have been registered, sometimes at a very low level indeed; in consequence, the entry and the exit of these flows both reached high levels.15
FIGURE 5
PORTUGAL' SHARE IN WORLD FDI INFLOWS, 1985-2006
(In percent of the total)
Source: UNCTAD.
Since 1996, the Bank of Portugal presents a statistical series on FDI with methodological coherence; table 5 shows the credit, the debit, and the stock of FDI inflows in 1996-2006,16 also discriminating it according to the main countries and regions of origin. EU represents 73.8% of the stock, where Spain is the main net investor with more than one third of the total, followed by the Netherlands (12.9%), and the United Kingdom (8.9%). As far as concerns the sectors where
12
The traditionally high deficit of current account is a strong reason to give more policy emphasis to exports.
13
This deficit is relatively high, and rising since 2003, but Portugal, contrary to what happened in the period 1974-1985, needs not a short term adjustment shock because now, with the single European currency, is paying the great majority of its imports with its own currency.
14
The Resolution of the Board of Ministers nº61/97, published in April 15, 1997 (by Diário da República), is related to these issues, and it is a relevant document in the development of a strategy addressed to the internationalization of Portuguese firms.
15
Under this perspective, it must be pointed out that the denominated permanency rate (the ratio between the net FDI inflows and the gross FDI inflows) evidences, on annual average, a sharp fall from 1986-1995 to 1996-2005, 78.5% and 16.7% respectively; see Silva, 2006, p. 518. This leads to the conclusion that Portuguese FDI inflows are highly mobile.
16
FDI inflows are applied, the same data of the Bank of Portugal are much less transparent; in 1996-2005, for example, the item real estate and service to firms absorbed 61.9% of the total stock of inflows, financial activities 9.2%, transports and communications 7%, and manufacturing a scarce 1.7% (Silva, 2006a, p. 510). Indeed, much of the FDI flows is registered by the Bank of Portugal as undifferentiated services to firms (inflows or outflows), because they come through the holdings of economic groups, and only more detailed studies, not easily available or updated, or direct enquiries to sectors or groups of firms, may proximately determinate the final destination of FDI inflows in terms of sectors of economic activity.
TABLE 5
FDI INFLOWS IN PORTUGAL: COUNTRIES AND REGIONS OF ORIGIN (1996-2006)
(Thousand euros)
Credit % Debit % Net %
European Union 195 476 809 85.7 164 846 896 88.3 30 629 914 73.8
Euro Area 154 755 199 67.8 127 773 018 68.5 26 894 559 64.8
Germany 31 323 466 13.7 30 787 490 16.5 535 970 1.3
France 28 744 673 12.6 26 339 258 14.1 2 405 415 5.8
Netherlands 30 445 832 13.3 25 069 777 13.4 5 376 055 12.9
Spain 27 383 302 12.00 13 120 759 7.0 14 262 546 34.4
Other EU 40 712 500 17.9 37 084 275 19.8 3 735 355 9.0
United Kingdom 35 817 297 15.7 32 115 033 17.2 3 702 263 8.9
Rest of the World 32 665 674 14.3 21 785 127 11.7 10 880 551 26.2
USA 7 369 894 3.2 6 571 682 3.5 798 215 1.9
Brazil 1 803 634 0.8 1 839 289 1.0 -35 655 -0.1
Others 23 492 146 10.3 13 374 156 7.1 10 117 991 24.4
Total 228 142 483 100.0 186 632 023 100.0 41 510 465 100.0
Source: Banco de Portugal.
For a deeper study of Portuguese internationalization we also need to take into account the FDI outflows. This matters here because these flows only became significant since the middle of the nineties, just the period covered by our analysis. In 1996, for the first time, the debit of FDI outflows represented more than 1% of the GDP, but the same ratio quickly reached 13.5% in 2000; moreover, every year between 1998 and 2004, except 2003, net outflows exceeded net inflows. Anyway, after 2001, overlapping with the stagnation of Portuguese economy, some decrease is perceptible in the FDI outflows (Silva, 2006a). By reasons exposed later, in the Portuguese case there is no evidence of robust correlation between FDI outflows and trade, particularly exports (sometimes even a substitution effect to the detriment of exports can be observed).17 In all events, the trend to invest abroad became a major ingredient of the internationalization process of Portuguese firms, and it made possible a more sophisticated interplay between both flows.
The figure 6 shows the geographical distribution of the stock of Portuguese outflows that is more diversified than the stock of inflows. The three main countries of destination, Brazil, Netherlands, and Spain, absorb each of them a proximate share (this set represents 55.2% of the total); we have to acknowledge however that the two last countries are not often the final destination of the outflows. Regarding the distribution by sectors of economic activities according to the series of the Bank of Portugal, like for inflows, the same problem of lack of transparency
17
Euro Area others 6,20%
Poland 2,16% United Kingdom
4,75% PALOP
2,32%
EU others 8,97% Rest of the world
20,40%
Brazil 18,98% Netherlands
18,46% Spain
17,75%
exists; in 1996-2005, the item real estate and services to firms represented 81.7% of the total stock of outflows. An enquiry conducted in Brazil in 2005, directly addressed to Portuguese subsidiaries showed that the great majority of Portuguese firms belonged to the category of commerce and services (69.2%), the share of manufacturing and construction was 21.4%, and that of agriculture and fisheries 9.4% (ICEP, 2005). In the services, tourism had relevance, and 10.4% of the subsidiaries were in the category of hotels. These data lead us to the conclusion that likely FDI outflows correspond, at least to some extent, to the Portuguese specialization, where services like tourism have an advantage.
FIGURE 6
STOCK OF PORTUGUESE OUTFLOWS: COUNTRIES OF DESTINATION, 1996-2006
Source: Banco de Portugal.
Note: Net investment: 42.57 thousand millions euros; Gross investment: 100.88 thousand millions euros.
In spite of the fact that the Portuguese ability to attract FDI inflows did not follow the world pattern since the early nineties, it is necessary to bear in mind that before the eighties, the experience of the Portuguese economy with this flow was neither large nor intense. So, we have to consider that in the last decade, from the historical point of view, the importance of FDI inflows increased, and opened the way to the strengthening of the links with foreign firms. On the other hand, after the middle of the nineties Portuguese FDI outflows also reached levels of statistical significance, contributing to a greater diversification of external economic relations, and to the exploration of new routes abroad. Notwithstanding natural weaknesses in the process, these two trends became highly relevant within the context Portuguese internationalization, and they have incremented its potential.
C. Geographical concentration and diversification
In the first decade of membership 1986-1995, exports to the other partners of EU-15 substantially increased; Spain absorbed however the essential of these gains18 while some traditional partners only maintained their share or began to shrink. Until the initial years of the new decade, these
18
trends strongly persisted, and the Portuguese exports became highly concentrated in EU, if not in Spain.19
In the 2000s, according to the table 6, it is clear that the EU-15 destination started, at last, to lose some weight, in the beginning slowly, but accelerating in 2005-06 (despite a recovery in 2007, but still below 2005): in 2006, the last full year we have data, EU-15 absorbed 75.4% of total exports after being relatively stable, around 80% in 1995-2004. In the meanwhile, the share of Spain continued to grow, overtaking Germany since the early 2000s, consolidating its position as first client (and as first provider), showing only a very slight decrease in 2006. United Kingdom in the first post-war decades and Germany in the 1980s and 1990s were the main markets for Portuguese exports, but by the middle of the new decade their position in the ranking was much more modest, especially the former. In its turn, France, another traditional partner, only slightly declines, seeming in a more stable position, and ranking as third destination of Portuguese exports, being very close to Germany in 2003-2007. It may be concluded that, in the EU-15 context, the orientation of Portuguese exports reinforced the geographical proximity factor.
TABLE 6
PORTUGUESE EXPORTS OF GOODS BY GEOGRAPHICAL BREAKDOWN, 1995, 2000-2007
(Per cent)
1995 2000 2001 2002 2003 2004 2005 2006 2007*
EU (15) 80.6 80.2 79.9 79.8 79.3 79.2 78.1 75.4 76.8
Spain 14.8 18.9 19.3 20.8 23.8 25.8 26.8 26.4 28.1
Germany 21.7 17.8 19.0 17.5 14.6 13.4 12.1 12.8 13.2
France 14.1 12.7 12.7 13.5 13.2 13.8 13.7 11.9 12.6
United Kingdom 10.8 11.0 10.0 10.2 10.3 9.4 8.5 6.6 6.1
New EU members** 0.6 1.3 1.4 1.5 1.7 1.6 1.9 1.8 2.4
EFTA 2.9 2.3 2.2 1.5 1.9 1.3 1.1 1.1 1.0
Rest of Europe 3.5 2.8 2.8 1.7 2.6 2.2 2.3 1,4 1.2
North America 5.0 6.3 6.3 5.8 6.4 6.4 5.8 6.5 5.2
USA 4.5 5.8 5.7 5.7 5.7 5.8 5.4 6.1 4.8
Latin America 1.6 1.5 1.9 1.8 1.1 1.3 1.3 1.7 1.9
Brazil 0.8 0.7 0.8 0.6 0.4 0.5 0.6 0.7 0.6
Mexico 0.0 0.2 0.3 0.3 0.2 0.2 0.3 0.4 0.3
Africa 3.8 3.7 4.2 4.5 4.6 4.7 4.7 5.7 7.0
PALOP 2.2 2.0 2.8 3.0 3.1 3.0 3.3 4.4 5.4
Angola 1.7 1.4 1.9 2.1 2.3 2.2 2.6 3.5 4.4
Asia 3.2 2.4 2.7 2.7 3.2 3.4 3.5 4.2 5.6
Japan 0.8 0.5 0.4 0.4 0.3 0.3 0.3 0.3 0.8
China 0.1 0.2 0.2 0.3 0.5 0.3 0.6 0.6 0.5
India 0.1 0.1 0.1 0.1 0.1 0.1 0.1 0.1 0.1
Oceania 0.3 0.5 0.4 0.4 0.4 0.3 0.3 0.2 0.2
Others 1.3 1.3 0.7 0.8 0.6 1.3 2.0 1.9 1.1
100.0 100.0 100.0 100.0 100.0 100.0 100.0 100.0 100.0
Euros value*** 17.5 26.4 26.9 27.4 28.1 29.9 30.6 34.5 34.7
Source: INE.
* January-November. ** Enlargements of 2004 and 2007. *** Thousand millions euros.
Nevertheless, in the new decade, and especially since 2002, Portuguese exports also experienced other relevant geographical changes. Asia, year after year is becoming a more
19
important partner,20 with the China particularly increasing its share, and the same is valid for the new EU Member states (from 0.6% in 1995 to 2.4% in 2007). Africa, and especially PALOP (acronym of African Countries Officially Speaking Portuguese); above all oil booming Angola, is clearly recovering its place as destination of exports. The trend is not so evident for the Americas, but even so, gains are clear in some particular cases; for example in Mexico, although starting from a very low level, is becoming a more interesting market (Portuguese exports amounted by 139 millions euros in 2006, representing about a half of the more traditional Brazilian market).21 An explanation for the exports’ performance towards Mexico probably lies in the Free Trade Area agreement with EU, suggesting a possible way to more intense trade relations between EU member states and Latin America countries.
If we take into account these two trends of Portuguese exports (inside and outside EU), a move towards diversification is clear, obviously in part favored by short term conditions like the boom in commodities market (that led to an increase of the purchasing power of some traditional partners in the developing world). Portuguese exports and trade in general were described too many times as rigidly oriented, lacking flexibility, and having great difficulties in penetrating into new markets (particularly when they are distant and not ex-colonies), even in the short run;22 this seems to be slightly changing, at least in relation to the nineties. In any case, even if it is too early to take for granted all these developments, the idea of prolonged stagnation concerning geographical distribution is being somewhat broken, perhaps opening the way to reduce the dependency on close neighborhood from the cultural or gravitational points of view (with the possible exception of EU-15). This change will be very important for a small economy like Portugal, to be too dependent on very few markets, even if they are highly industrialized like EU member states, may seriously handicap the possibilities of exploring other alternatives, and taking full profit of its own competitive advantages; it also leaves the country more exposed to unwanted turns in a very scarce number of partners. All these dimensions are relevant in order to be taken into account in the design of the advanced trade strategy that Portugal needs.
D. Analysis of the Portuguese exports: shifting from traditional
to new products
As referred to above, in this point we will focus on the changes of the structure of Portuguese exports of goods and services. Table 4 presents major aspects of this process as far as exports of goods are concerned, through a set of selected years between 1986 and 2006. Firstly, between 1996 and 2006, the weight of traditional goods (including agriculture, forestry and manufactured products) has considerably decreased from 47.7% to 32.5% of the total, and is no longer the most significant part of exports has happened up to the early 1990s. Textiles, clothing and footwear are however the responsible for this drop; the shares of the other traditional products - like wine, and some fruits or forestry products - have remained basically stable in overall around 17% of the total what means that they are likely becoming more competitive, and have a new basis to be developed (differentiation through quality instead of price). Secondly, machinery and transport
20
In January-November 2007, Asia has supplanted the traditional North American market as destination for Portuguese exports (table 6).
21
In 2006, there was no product clearly dominating the Portuguese exports to Mexico, they were composed by 8473 –
parts of machines for data processing with 12.3%; 2901 – acid hydrocarbon with 12.1%; 2701 – oil with 7%; 6109 –
T shirts etc. with 5.4%, all the other smaller items representing 57% of the total; on the contrary, Portuguese imports from Mexico were highly concentrated in 2709 – brut oil with 83.7% of the total; exports to Brazil will be examined later in this report.
22
equipment was in 2006 the most important group by great categories of goods. Comparing this item in 1996 and 2006, there is no substantial change in the share. But, if we consider as starting point 1986, we may conclude otherwise. Indeed, as Auto-Europa (Volkswagen) started its functioning in 1996 (as full year), and represents directly or indirectly a large part of the sub-item motorvehicles and other transport equipment, the evolution of this group machinery and transport equipment (including optical & precision instruments) is impressive: from 15.8% in 1986 to 33.9% of the total exports in 2006. On the other hand, since 1996, the sub-item motor vehicles etc. is losing ground, and the figures already available for 2007 show that this decline continues, whilst the other sub-item machinery, equipment basically maintains its weight of the 2000s. Thirdly, mineral and metals also substantially increased their share in the 2000s, it must be acknowledged that again the booming price of raw materials in the period (in copper, for example, where Portugal is an exporter) has certainly contributed to this performance, and consequently may be temporary; anyway, it is another sign of exports’ diversification. Fourthly, the group chemicals, plastic and rubber almost doubled its share between 1996 and 2006. So, traditional goods, essentially textiles, clothing and footwear lost weight23 for new and likely more upgraded products, and this process also led to a greater diversification, under this specific taxonomy of goods.
TABLE 7
PORTUGUESE NOMINAL EXPORTS OF GOODS BY GROUPS OF PRODUCTS
Weights in total nominal exports (per cent)
1986 1996 1999 2003 2004 2005 2006
Traditional goods 62.1 47.7 44.3 38.8 36.5 35.0 32.5
Agriculture 3.1 2.8 3.2 3.6 3.8 3.7
Food products 4.3 4.2 4.3 4.1 4.2 4.2
Wood, cork 4.6 4.8 4.7 4.7 4.5 4.2
Pulp, paper 4.7 4.6 4.9 4.5 4.6 4.5
Textile products 7.1 7.4 5.8 5.3 5.1 4.7
Clothing 15.6 13.3 10.5 9.5 8.3 7.2
Footwear 7.8 6.9 5.1 4.5 4.2 3.7
Leather, leather products 0.4 0.3 0.3 0.3 0.3 0.3
Minerals and metals 12.5 11.2 11.1 12.3 14.6 16.7 19.2
Mineral fuels 2.3 1.8 2.4 2.9 4.3 5.5
Mineral, ores 5.0 4.4 4.2 4.8 5.0 5.4
Basic metals 3.8 4.8 5.7 6.9 7.4 8.4
Chemicals, plastic and rubber 6.8 5.9 6.8 8.7 9.4 10.5 10.3
Chemicals 3.4 3.6 4.4 4.6 5.3 5.1
Plastic, rubber products 2.5 3.2 4.4 4.8 5.2 5.3
Machinery and transport equip. 15.8 32.7 35.2 36.2 35.3 33.6 33.9 (Continued)
23
Such a fall may be linked to the losses in the Portugal’s share in some European traditional markets like UK, EFTA, and even, in part, Germany (see table 6). According to an interpretation heard at the Forum para a Competitividade
0% 10% 20% 30% 40% 50% 60% 70% 80% 90% 100%
1967 1986 1996 2005
Low technology Medium-low technology Medium-high technology High technology
Table 7 (Conclusion)
Machinery, equipment 16.1 19.0 19.7 19.0 18.7 19.8
Motor vehicles, other trans. equip. 15.6 15.3 15.3 15.3 14.0 13.2
Optical & precision instruments 1.0 0.8 1.1 1.0 0.9 0.9
Other products 2.7 2.6 2.6 4.0 4.2 4.2 4.1
Total 100.0 100.0 100.0 100.0 100.0 100.0 100.0
Sources: Ministério da Economia e Inovação – Gabinete de Estratégia e Estudos, INE and Banco de Portugal.
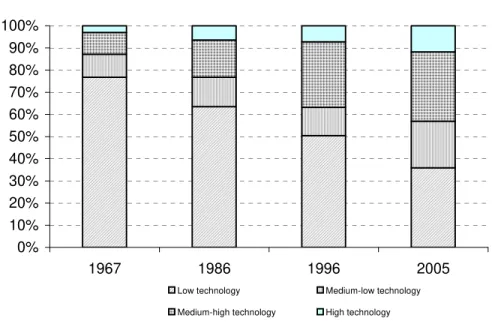
Figure 7 shows the transformation we have just referred to above in another fundamental respect, in so far it introduces the technological content of exports. Indeed, simple statistical characterization of industries according to the type of economic activity is no longer sufficient to understand what is going on international trade; for instance, in agriculture, or even textiles and footwear we may have quite different components from the technological point of view (more specifically among the firms of each industry). Therefore, looking at the figure 7, it is clear that products incorporating low technology, overwhelming in the 1967, and even in 1986, were near parity with the others in 1996 but, in the period under more detailed analysis; they clearly lose ground and no longer represent the majority of exports. The weight of high technology goods in exports, however, although increasing is still low (11.8% of the total in 2005, but 7.3% in 1996, and 6.5% in 1986), and the gains went mainly to the share of medium high and medium low technology products that together represent now more than half of the Portuguese exports. In general, they are exposed to tough international competition, especially coming from Asian countries and other competitive areas in this range of products. Hence, in spite of the improvement in the composition of exports towards higher technological content, the process seems to have been too slow in comparison with other historical experiences, especially those of more integrated countries into the world economy (Lall, 2001); so, the changes are relevant but the Portuguese exports remain vulnerable to the world dynamic competition.
FIGURE 7
COMPOSITION OF PORTUGUESE EXPORTS
Source: Chelem database.
Similar trends can be observed as far as concerns the exports of commercial services since 1996 (see tables 8 and 9), whose weight has somewhat been increased in total exports, from 27.1% in 2000 to 29.1% in 2006. Again, the traditional pillar of these flowstravel and tourism is losing ground, and in 2006, for the first time since long ago, is below 50% of the total of these exports. In turn, transport and other business services have strongly strengthened their position in the ranking as second and third contributors to the exports of services, and together are quickly approximating the amount of travel and tourism receipts.24 Although to a lesser extent in absolute terms, communications and construction also increased their share in relation to the beginning of the 2000s (not to 1996). The value of exports of the other items remain minor in the whole, although substantially increasing in some cases (in relation to 1996, the exports of computer and information have been multiplied by 4.8, royalties and license fees by 4.3, and the total only by 2.3). So, a trend towards diversification in the exports of commercial services, increasingly with new products, is also quite apparent; some more qualified flows remain nevertheless inexpressive. These moves, if they become consolidated, are of great significance insofar we take into account the contribution of services flows to the total balance of trade, and consider the Portuguese international specialization in this same field.
TABLE 8
PORTUGUESE EXPORTS OF SERVICES, 1996, 2000-2006
(Thousand million euros)
1996 2000 2001 2002 2003 2004 2005 2006
Travel & tourism 3686 5719 6124 6093 5848 6195 6198 6649
Transport 1204 1585 1767 1939 2114 2322 2584 3180
Other business services 497 1444 1582 1774 1738 1837 1995 2475
Merchanting & other trade rel. ser. 138 853 852 841 825 819 876 1022
Operational leasing services 22 27 34 43 30 39 54 74
Miscellaneous services 337 564 696 890 883 979 1064 1379
Communications 216 187 224 265 318 389 462 541
Construction 208 163 214 217 273 348 293 439
Personal, cultural & recreational 75 148 157 122 118 156 166 202
Financial services 181 261 119 159 141 188 171 197
Computer & inf. 31 82 67 82 96 116 122 148
Others 58 132 144 146 146 156 132 147
Insurance 41 64 67 79 83 110 80 94
Royalties and license fees 15 31 28 31 32 33 48 65
Total 6112 9819 10496 10910 10912 11853 12255 14141
Source: INE.
TABLE 9
PORTUGUESE EXPORTS OF SERVICES, 1996, 2000-2006 (Percent)
1996 2000 2001 2002 2003 2004 2005 2006
Travel & tourism 60.3 58.2 58.3 55.8 53.6 52.3 50.6 47.0
Transport 19.7 16.1 16.8 17.8 19.4 19.6 21.1 22.5
Other business services 8.1 14.7 15.1 16.3 15.9 15.5 16.3 17.5
Merchanting & other trade rel. ser. 2.2 8.7 8.1 7.6 7.6 7.0 7.2 7.2
Operational leasing services 0.3 0.3 0.3 0.4 0.3 0.3 0.4 0.5
(Continued)
24
Table 9 (Conclusion)
Miscellaneous services 5.6 5.7 6.7 8.2 8.0 8.2 8.7 9.8
Communications 3.5 1.9 2.1 2.4 2.9 3.3 3.8 3.8
Construction 3.4 1.7 2.0 2.0 2.5 2.9 2.4 3.1
Personal, cultural & recreational 1.2 1.5 1.5 1.1 1.1 1.3 1.4 1.4
Financial services 3.0 2.7 1.1 1.5 1.3 1.6 1.4 1.4
Computer & inf. 0.5 0.8 0.6 0.8 0.9 1.0 1.0 1.0
Others 0.9 1.3 1.4 1.3 1.3 1.3 1.1 1.0
Insurance 0.7 0.7 0.6 0.7 0.8 0.9 0.7 0.7
Royalties & license fees 0.2 0.3 0.3 0.3 0.3 0.3 0.4 0.5
Total 100.0 100.0 100.0 100.0 100.0 100.0 100.0 100.0
Source: Banco de Portugal.
So, Portuguese trade in goods and services, particularly exports, underwent major changes in 1996-2006 in their bases (for instance towards greater equilibrium), and greater diversification by geographical breakdown and the kind of products. Some of them are very recent; others correspond to trends that have been slowly gaining momentum during the previous decades. In a way, we may say that only very recently the composition of Portuguese trade is truly closer to the pattern of the other European partners, particularly at the level of EU-15, being more diversified, less dependent on natural resources and factors, and, eventually, on low labor costs and non qualified human resources. Yet the process still needs to be deepened and consolidated in the coming years. In any case, the context of qualitative transformation is becoming more evident in the evolution of Portuguese trade during the last decade, and this will have certainly impact on the implementation of trade strategies.
It is important to add some more information about the evolution of Portuguese trade since the middle of the nineties using other indicators like specialization coefficients, market shares, and import shares. In a study on the Portuguese trade within the context of EU-15 in 1995-2004, Amaral (2006) calculated some of these indicators on a time comparative basis. The selection of the EU-15 makes sense insofar it stably absorbed about 80% of the total exports in this period; in the following step, 45 products (at four digits) whose exports were above 100 million euros representing 47.8% of the total, were chosen for the analysis. The results as far as concerns specialization coefficients are in table 10: between 1995 and 2004, they show a positive evolution to the extent that according to the standard interpretation of the three indicators, intra-industry trade has raised its level between 1995 and 2004.25
TABLE 10
SPECIALIZATION COEFFICIENTS
Coefficients 1995 2004
Balassa 0.429 0.389
Grubel and Lloyd 0.611 0.682
Adjusted Grubel and Lloyd 0.707 0.864
Source: Amaral, 2006, p. 10.
However, regarding market shares and import shares of the 45 products, the results are clearly more disappointing. The author compared the periods 1995-2000 and 2000-2004. In the latter, 21 products, representing 41.4% of exports, had lost market and import shares a worse result than in 1995-2000, where only 15 products (26.2% of the total) had simultaneously lost
25
III. The institutional framework of Portuguese
trade strategy (I): The public agencies
A. The Programs supervised by the Ministry of Economy and
Innovation –
PRIME and QREN
1) PRIME and SIME (Public Initiative with EU support)
Due to the lack of consistent international trade strategies in the past, the EU support has been crucial in promoting the internationalization of SMEs in Portugal,26 providing roughly two thirds of the total public assistance. From 2000 to 2006, the main EU program supporting firms focused on modernization, and was called Incentive System for Enterprise Modernization (SIME –
Sistema de Incentivos à Modernização Empresarial), but it also had a component called SIME-Internacional. SIME was a key part under the Program for Modernization of the Economy (PRIME), and far as internationalization was concerned the projects in the following areas were eligible for funding:
• Market studies;
• Actions of research and presence in foreign markets; • International marketing;
• Acquisition and registration of brands, warranties, patents and licenses;
• Financial effort to capital sharing associated with new productive investments in European Union companies.
PRIME had a national scope and included all sectors of the economy (and in some cases all kinds of firms); between 2000 and 2006 where it was in force, more than 15700 projects were approved, representing a total investment of 18 thousand millions euros.27 Firms from all sectors
26
Although more internationalized, big firms represent a tiny proportion of the total in Portugal, and they need less support or operate through other routes like economic diplomacy.
27
were eligible for support, and there were almost 40.000 applications. In practical terms, in the name of modernization, many of the subsidies went to SMEs in the non tradable sectors. The SIME funds, in particular, were used in great part to modernize capital (buildings, equipment) and labor training, whereas relatively few funds were allocated to internationalization activities. The limited amount of funds used for export promotion was mostly spent on marketing products abroad. According to these views widely recognized, even by governmental bodies, in 2006, PRIME was reformed, and became the New PRIME more focused on innovation, training and internationalization.
2) From PRIME to QREN Program (Public Initiative with EU support)
Since PRIME is officially finished, the pursuit of the “new strategy”, started to be implemented in 2006, will be assured by QREN (Quadro de Referência Estratégico Nacional – National Strategic Framework of Reference) in the period 2007-2013.28 Institutionally, the QREN is to a large extent the continuation of what was previously known as QCA - Quadro Comunitário de Apoio (Community Framework of Support) I, II and III, in force between 1987 and 2006, under which the essential of EU structural funds transferred to Portugal was channeled and managed on the basis of specific projects. The QREN is announced as being much more selective, prioritizing projects which have internationalization, knowledge and innovation as their key parameters. As a consequence, priority will be given to tradable sectors and the focus on internationalization instead of modernization is now clear. In the present program, the strategic key item Factors of Competitiveness has 6.001 million euros available in funds to distribute. Nevertheless, public (EU) funds can only finance a minor share of internationalization efforts. The limits are 7.5% of “eligible” cost for medium sized enterprises and 15% for small firms, and, as just referred to above, another limitation of the EU funds is that they only contribute for internationalization efforts within the EU but not outside.
Until 2006, at least, taking into account that the distribution of funds inside EU is largely made in administrative and political bases, the economic evaluation of these policies by independent bodies would have been necessary, in particular as far as internationalization is concerned (comparing with funds destined to other areas). However, the results of such evaluations are not systematically conducted, are disperse, and not easily available. An effort to develop these schemes would be useful for the future rationalization and enhancement of such programs.
B. AICEP (
Agência para o Investimento e o Comércio Externo de
Portugal
) – Agency for Investment and Foreign Trade of
Portugal, and “ICEP” experience
Several public institutions, coordinated by the Ministry of Economy and Innovation, participate directly or indirectly in the export promotion. The main institution in charge of promoting exports and investment abroad is presently the Agência para o Investimento e Comércio Externo de Portugal (AICEP), which is the merge of ICEP (exports) and API – Agência Portuguesa de Investimento (investment). This merge has become effective as of July 2007, after both
28
institutions were separated in 2002 as well in 1977-1990 (to mention the major institutional changes that occurred in the last decades not only involving trade and investment organizations but also tourism). A comparison between past ICEP and present AICEP will be made a little further. Due to its relevance to the Portuguese exports, let us first make a presentation of ICEP.
As mentioned earlier, under different names,29 ICEP exists since the late forties. Obviously, here we will not give account of all these changes. Up to the nineties, ICEP had accumulated experience in export promotion; its efficiency was variable, sometimes influenced by the vision (or its lack) of executives and boards, but other determinants, like devaluations after 1977 till the second half of the eighties,30 rather than promotion activities seemed much more decisive for governments in order to increase exports. For a long time ICEP was a public agency, surely useful in the diffusion of information abroad, but limited by institutional and financial means and scope; for example, the promotion of exports through a strong and operative network of foreign representations is relatively recent. Indeed, the foreign network of ICEP has remained relatively small comparing to the personnel working inside Portugal (AICEP is now aiming at strengthening the former).
In 2005, ICEP entered a more dynamical path of its existence. By the middle of this year, its central objective was clearly defined, and translated into two main targets and four great lines of strategic orientation. There was not a specific link with the unsatisfactory performance of exports between the beginning of the nineties and the middle of the 2000, but of course this influenced the new program as background. Afterwards, we present its most important points.
Central Objective:
To act in the assistance to exports of Portuguese firms.
Two main targets:
• To increase the market share of Portugal through a growth rate of exports higher than that of international trade (the italic is ours);
• Trade internationalization of Portuguese firms in view of the support to exports. Great lines of strategic orientation:
• To improve the levels of efficiency in the support to exporting firms through the international network of ICEP.
• To implement a strategy of Marca Portugal, unified for goods and services of the Portuguese firms in all sectors and chains.
• To create mechanisms for actual support to firms in their actions of export and international trade.
• To carry out and to expand public-private partnerships with the associations’ employers, in order to increase the efficiency of the promotional effort.
In relation with this new strategy more precise and ambitious measures were also announced (partly referred to below). Moreover they were scheduled to be achieved, and the door was open to be subsequently submitted to independent evaluation. It was stressed that the foreign branches would play a central role in the invigorating of ICEP. Under this context, among other activities, regular meetings with delegates to the main markets (including sometimes ambassadors
29
Even in 2005, ICEP took the official name of ICEP Portugal – Instituto das Empresas para os Mercados Externos.
30