AGEING ALONE?
THE FUTURE OF THE PORTUGUESE POPULATION IN
DISCUSSION
Lídia Patrícia Tomé, Filipe Ribeiro, Maria Filomena Mendes
Summary
Population projections significance is recognized all around the world, being used by different governments with the intention to suppress the necessity of having more in-formation about the diverse demographic issues, and Portugal is not an exception. Ad-ditionally, the fact that Southern Europe is in economic crisis and that Portugal was the second country from the south, after Greece, in economic collapse, resulted in a strong impact not only in the family context, but also its sustainability itself.
Trying to answer questions like: Will be the country economically sustainable in the future? Is Portugal going to decline total population?, or, How these changes will in-fluence the households structures in the future?, we intend to elaborate a cohort com-ponent projection, for a medium term period (next 20 years), that will allow us to iden-tify the Portuguese population structure in the future and, at the same time, evaluate the possible changes that the country will have to face.
Keywords: Ageing, Household, Population Projections, Portugal. 1. Introduction
Across history profound changes in the different societies have been registered and these changes are hand in a glove with the changes occurred in demographic paradigms. Nevertheless, even that many demographic changes can be connected with individual choices, like the decision to migrate or to have a child, the truth is that there is always something behind that influences a decision. Nowadays, the economic crisis that is installed in Southern Europe has a major impact in several of these personal decisions and also in some others that cannot be really controlled, like unemployment or health demand.
The main motivation and goal for the elaboration of this study is to evaluate the impact of the crisis in the future of the Portuguese population and at the same time to analyze the structure of the ageing process itself. We will elaborate and project, based on different assumptions, diverse scenarios of evolution for the next 20 years, i.e., from 2012 to 2032. In this way, without taking into account any so-cioeconomic variable we intend to evaluate the possible changes in the Portuguese demography; if in the near future the country can still be demographically sustain-able due to ageing; if the crisis itself will accelerate and intensify the ageing
pro-cess, together with a shrinking population; and, at last, try to understand how the household dynamics are going to change. Thus, we will try to give an answer to questions like: Will the country be demographically sustainable in the future?, Is Portugal going to decline total population?, How all the demographic changes will influence the household structure in the future?, How massive out-migration will influence the overall population?, and, Can Portuguese people expect to age alone in the future?
Our guess is that Portugal is walking towards a very pronounced decline in the overall population, which consequently intensified by high emigration rates that will result in a deep change in the household composition, possibly isolating more and more individuals.
2. Data and methodological approach
Findings presented in the manuscript, were calculated based on data collected from the Human Mortality Database (HMD: www.mortality.org) and from Statis-tics Portugal (INE: www.ine.pt).
With the intention of giving an answer to the research questions and hypothe-ses advanced in the introductory section, we made use of the cohort component projection methodology. The construction of different and plausible scenarios came out from a combination of the cohort component projection model and the Lee-Carter methodology to forecast future mortality and life expectancy. The combina-tion of these two approaches results in the addiccombina-tion of a probabilistic component to the projection method, and at the same time, improves the outcome. Moreover, since it is also our aim to analyze the possible changes in the household composi-tion, the headship rate method proposed by the United Nations in 1973 and the model improvements suggested by Ediev in 2007 were additionally applied.
The household headship method calculates the number of households from an existing population projection by age and sex, typically the “medium variant”, to-gether with statistics on the proportion of household heads belonging to each age-sex group. Several authors (Mason, 1987; Linke 1988; McDonald & Kippen, 1998; Ediev, 2007; Zeng et al., 2013) developed different extensions or approaches trying to improve household projections allowing the identification of more detailed in-formation about the distribution of household sizes. In our study, the choice of the methodological approach fell on the extensions to the household headship method developed by Ediev in 2007 essentially due to data availability and by the robust-ness and consistence presented by the method itself when applied to empirical data.
3. Past, present and future: defining possible scenarios
Between 1960 and 2012 the structure of the Portuguese population presented a dramatic reduction at younger ages and the number of elderly increased tremen-dously, changing significantly population dynamics. Into the light of demography, this situation can be explained being the result of fertility decline, the increase of life expectancy and, as well, an increasing of emigration in the most recent years. Portugal, as the other Southern European countries, also experienced a drastic and
fast decline in live births. The Portuguese TFR declined from the value of 3 chil-dren per women in 1960 to 1.28 in 2012. And at the same time the evolution of life expectancy at birth reveals form 1960 to 2012 the increase of 16.7 years in the fe-male case and 16.1 years for fe-males. Besides the positive impact of this evolution of lifespan, its conjugation with low fertility rates can affect the country sustainability at the same time that the Portuguese population structure is ageing. For the first time in 17 years, and following the information given by the Statistics Portugal of-fice, Portugal presents negative net migration values in 2011 and 2012. In fact, since 2010 that the number of emigrants grew more than twofold, increasing from 23 760 in 2010, to 51 958 in 2012. The registration of in-migration flows presents an opposite evolution, as expected, decreasing from 27 575 immigrants in 2010, to 14 606 in 2012.
Nonetheless, above all and until nowadays, the decline of births and fertility rates are the major responsible for the fact that Portugal becomes currently, accord-ing to the information presented by the World Population Data Sheet 20101, the sixth country in the ranking of the most aged ones.
One of the most important steps in the elaboration of the different projection scenarios is a careful and in depth exploration of a country demographic compo-nents, i.e., fertility, mortality and migration. So, after a first phase where it was show a contextualization of the country itself, we are now in a good position to elaborate the possible and differentiated “what if” scenarios for the future of the Portuguese population.
Starting with the assumptions elaborated for the fertility component (Figure 1, panel 1), with the starting point of the last available year, i.e., the year of 2012, where the observed value for the TFR is 1.28, we believe that Portugal, following the tendency that took place in several other European countries, will keep register-ing a decrease in TFR. So, for all the scenarios it was defined that the TFR for 2016 can decrease to 1.15. Thus, is only from 2016 onwards that we can expect dif-ferent possible evolutions, and in a so-called “central” scenario we admit that the TFR will slightly increase achieving the value of 1.4 (in 2032). In a “high” scenar-io, it would be good that the value of 2.0 children per woman can be reached, and in opposition, in a “low” scenario, it can be assumed that Portugal will not recuper-ate its fertility rrecuper-ates and the decline can be even more pronounced, possibly attain-ing in average the value of a sattain-ingle (1) child per woman.
In the case of the assumptions taken for the mortality and presented in Figure 1 (panel 2 and 3), it was followed the obtained values from the Lee-Carter forecast-ing methodology. In this case, it can be expected that in a “central” scenario, the observed life expectancy at birth for females increase from around 83.5 years (2012), to 87.2 years (2032); and for males from 77.3 years to 81.4 years. This sit-uation corresponds to an increase of 3.7 and 4.1 years in the life expectancy of fe-males and fe-males, respectively, during the 20 years of the study. Nevertheless, in our calculations, it is also assumed that life expectancy at birth could present a faster or lower increase with time. In this situation, it is expected, if the “high sce-nario” becomes real, that life expectancy at birth for females reach the value of 90.1 and for males 84.5, in 2032. Nevertheless, the values associated with the “low
1
scenario”, are, as predictable, a bit lower, and in 2032 is expected that females achieve 83.3 years of life expectancy at birth and 77.7 years in male case.
Figure 1 - Total fertility rate (TFR) Life expectancy at birth (e0) and between 1981 and 2012 and possible scenarios until 2032 in Portugal
Panel 1: Total fertility rate (TFR) between
1981 and 2032
Panel 2: Male e0 between 1981 and 2032
Panel 3: Female e0 between 1981 and 2032
Source: own calculation, INE - Statistics Portugal, HMD.
Lastly, lets direct now our attention to the migration component that was in-troduced in the projection model using net migration values. Based on recent trends and taking into account emigration and immigration separately, we assume that the first one will follow the same pattern of increase registered between 2009 and 2012 (11 686 emigrants per year in average) until 2022, increasing from 51 958 to 168 821. The period taken into account for this assumption is due to 2009 being the year immediately after the beginning of the crisis (2008), and when people started to realize the situation of the country. After 2022, we believe that is possible that these values decline until the ones observed in 2009 (16 899). For the second case, i.e., immigration, we assume that the inflow tendency will decelerate and, without doubt decrease, because the country is not at the time economically stable and con-sequently, non-attractive. In this way, it is really possible that in 2022 the number of immigrants equals the minimum value registered since the 1990s, more specifi-cally in 1991, with an inflow that decreases from 14 606 individuals (2012) to 4 507 individuals (2022). Once again, and like it is considered in the emigrants case, we think that these values will start to increase after the economic recuperation and possibly the values of 2009 can be registered again in 2032 (32 307). For this last component, the migration structure taken into account corresponds to the one ob-served in the year of 2012, and because there is no information available by gender, it is assumed that men and women have the same migration probability across age and time.
Our study focus three main scenarios: (Central ageing scenario) the one that we consider most probable to occur, where is combined the “central options” of both, fertility and mortality; (Fastest ageing scenario) one scenario where low rates of fertility combined with high life expectancy result in aged population structure; and lastly, (Slowest ageing scenario) a scenario where the opposite results are ob-tained, once that “higher” rates of fertility are combined with lower life
expectan-cy, resulting in a young population structure. Besides that our analyses starts only with the natural growth of population, when the migration impact is introduced, the number of scenarios taken into account becomes six though. The choice of focus-ing in only six of the constructed scenarios is directly connected with the aim of our study and formulated hypotheses.
4. The future of the Portuguese population in discussion
4.1. Portugal in 2032
As it as seen in the previous section, the economic collapse occurred in Portu-gal is very likely to intensify the pace of ageing of the population structure itself, that was already very delicate per se. Together, the low number of registered births and the predictable fast increase of out-migration are expected to result in an even more aged population than supposed before, resulting from an economic instability that started in 2008 but that only in 2010 begun to be strongly experienced in Por-tugal.
Table 1 presents the total estimated number of individuals by the three main scenarios chosen previously for Portugal for the years of 2022 and 2032. As it can be observed, if in the estimates obtained without the impact of net migration, inde-pendently of the analyzed scenario, the total decrease in the population size for the next 20 years is expected to not be higher than 8% (-837,266 inhabitants), the im-pact of net migration can be around 3.5 times higher, resulting in a decrease be-tween 25% and 28% in the overall population (-2,625,922 to -2,927,859 inhabit-ants).
Table 1 - Total Population
2012 2022 2032
Without net
migration With net migra-tion Without net mi-gration
With net migra-tion
Lowest ageing scenario 10 487 289 10 045 013 8 896 721 9 650 023 7 559 430 Central ageing scenario 10 487 289 10 149 553 9 006 571 9 728 165 7 712 028 Fastest ageing scenario 10 487 289 10 245 164 9 105 668 9 827 602 7 861 367
Source: own calculation, INE - Statistics Portugal.
The results presented until now confirm that under the current conditions, the Portuguese population is going to decrease, however, it is difficult to quantify. Nevertheless, if a shrinking population may not be a problem by itself, the ageing of the population structure might result in the unsustainability of the country. The population pyramids presented in Figure 2 are a very good example of this situa-tion, and if in all the three-presented scenarios ageing is common to all of them, the introduction of net migration into the equation gives a better picture about the pos-sible and concerning economic unsustainability of the country that can driven by the demographic evolution of the country.
Figure 2 - Portuguese population structure in 2012 and 2032 for the selected scenarios Panel 1: Slowest ageing scenario
witouth net migration
Panel 2: Slowest ageing scenar-io with net migratscenar-ion
Panel 3: Central ageing sce-nario witouth net migration
Panel 4: Central ageing scenario with net migration
Panel 5: Fastest ageing scenario witouth net migration
Panel 6: Fastest ageing scenario with net migration
Source: own calculation, INE - Statistics Portugal.
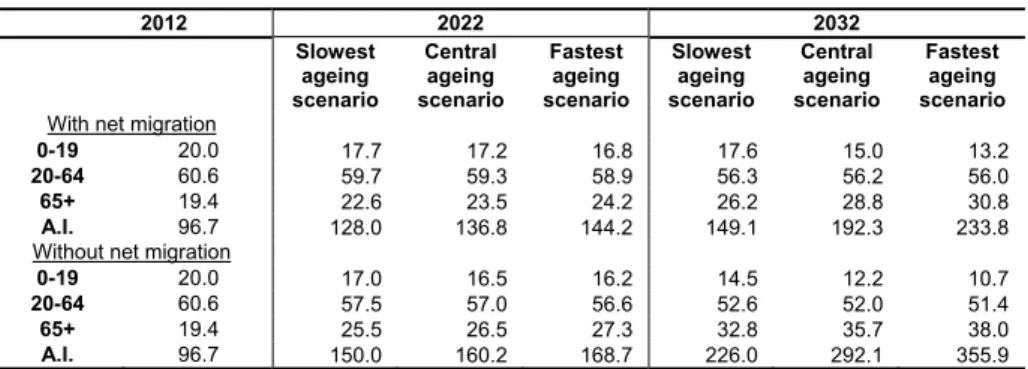
In a first glance the results presented in Table 2 show a concerning increase in the proportion of elderly population across time, and at the same time, a decrease in the proportion of both, young and active population. Once again, if the obtained results without the impact of net migration are already disturbing, with the impact of massive out-migration flows, the situation escalates. Another concerning situa-tion is given by the examinasitua-tion of the obtained results when the Ageing Index (A.I.) was calculated, mainly because if in 2012, we can define the Portuguese sit-uation as still “positive” (more younger than elderly inhabitants), when for every 100 young inhabitants where recorded around 97 elderly inhabitants, in 2032 is al-most sure that this value significantly increases. According with the chosen scenar-io, it is expected that the number of elderly inhabitants per each 100 young ones vary between 149 and 356, increasing even more the concerning about the country sustainability.
Table 2 - Proportions of young (0-19), active population (20-64), aged population (65+) and ageing index
2012 2022 2032 Slowest ageing scenario Central ageing scenario Fastest ageing scenario Slowest ageing scenario Central ageing scenario Fastest ageing scenario
With net migration
0-19 20.0 17.7 17.2 16.8 17.6 15.0 13.2
20-64 60.6 59.7 59.3 58.9 56.3 56.2 56.0
65+ 19.4 22.6 23.5 24.2 26.2 28.8 30.8
A.I. 96.7 128.0 136.8 144.2 149.1 192.3 233.8
Without net migration
0-19 20.0 17.0 16.5 16.2 14.5 12.2 10.7
20-64 60.6 57.5 57.0 56.6 52.6 52.0 51.4
65+ 19.4 25.5 26.5 27.3 32.8 35.7 38.0
A.I. 96.7 150.0 160.2 168.7 226.0 292.1 355.9
Source:Own calculation, INE - Statistics Portugal.
Resuming, we can see that the aged population increases at the same time that the total population decreases around one third and one fourth, depending on the different assumed scenarios.
Following the fastest ageing scenario with net migration, the aged 65+ popula-tion might achieve the number of 2,983,888 inhabitants (from which 1,708,098 are females), including 1,034,371 individuals aged 80+ (645,985 females and 388,386 males). In opposition, the labor force not only decreases in proportional terms, but also in absolute values, being only 4,340,992 inhabitants from the 6,904,482 that share the same age group, for the year of 2012. The ageing of the labor force and its reduction have a strong impact in the innovation and productivity that, per se, will negatively affect the economic development of the country, and all these changes will add more effort to the taxpayers themselves. Together, the increasing of aged population, the diminution of the labor force and young population, will change dramatically the consumption and saving habits, but always depending more on the wage itself than on the evolution of the population structure. Confirm-ing this hypothesis, the huge increase expected in the number and weight of elderly population, will have an adverse impact in the education, health and social insur-ance systems.
Projecting health care demand associated with ageing, should be always tak-ing into account variables like the marital status, the presence of adult decedents, elderly population salary and level of education and social prestige (Ziegler & Do-blhammer, 2010). In a situation like this, family could be very important, mainly in a country characterized by a welfare system highly designated according to famil-iarist principles or in elderly helping system highly centered in familiar connec-tions (familiarist welfare system).
4.2. Changes in the household structure
Across our study, it can be seen the overall concerning changes that Portugal will need to face in a near future. Nonetheless, if ageing is a major problem that can be even more pronounced due to the Portuguese economic situation, all these structural transformations will also affect families dynamics and not only the de-mographic situation per se. Population ageing will also cause an increasing demand
for different needs, becoming also urgent that this demand could be suppressed by competent and efficient solutions.
A consequence of the consolidation of a “heavier” top on the population pyramid is also the increasing proportion of the population that is living in institu-tional households, specifically after age 65. Table 3 presents the projected evolu-tion for the case of males and females separately, and it can be seen that among all the male population, it is expected that the proportion of 65 and more aged males will grow 2.4 times in the next 20 years, while that the proportion of female (65+) population institutionalized will grow around 2.3 times. However, and even that expected due to the higher female life expectancy, it is also important to refer that in any case the proportion of female population that is living in institutional house-holds after age 65 is, independently of the observed scenario, always higher than in the male case.
Table 3 - Proportions of institutionalized males and females aged 65+ in the years of 2012, 2022 and 2032
2012 2022 2032
Without net
migration With net mi-gration Without net migration With net mi-gration
Mal
es
Slowest ageing scenario
0.5
0.6 0.7 0.7 0.9
Central ageing scenario
0.6 0.7 0.8 1.1
Fastest ageing scenario
0.7 0.8 1.0 1.2
Femal
es
Slowest ageing scenario
1.2
1.4 1.6 1.6 2.1
Central ageing scenario
1.6 1.8 2.0 2.5
Fastest ageing scenario
1.7 1.9 2.3 2.8
Source:own calculation, INE - Statistics Portugal.
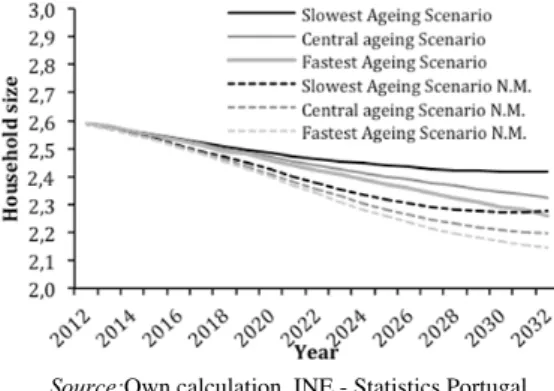
At the same time that the future of the Portuguese population is hand in a glove with decline and ageing, it is also expected to see major changes in the household dimensions and demand. In 1960, the average size of the Portuguese households was 3.6, but after 52 years, i.e., in 2012, the observed value decreased to 2.6. This means that in the last 52 years each household lost around one people in average, however, under the current situation of the country, we expect that in the next 20 years the decrease in the average size of the households varies between a minimum of 0.2 and a maximum of 0.4, i.e., with and without the impact of net migration, respectively. This situation means that the pace of decrease observed in the last 52 years in the household average size will be hardly registered again. The results presented in Figure 3 give a very clear example about this situation, and at the same time, allow a better understanding about the possible changes in the household composition that can succeed from the predicted high negative net mi-gration.
Figure 3 - Evolution of average household size, in the selected scenarios between 2012 and 2032, for Portugal with and without the net migration impact
Source:Own calculation, INE - Statistics Portugal.
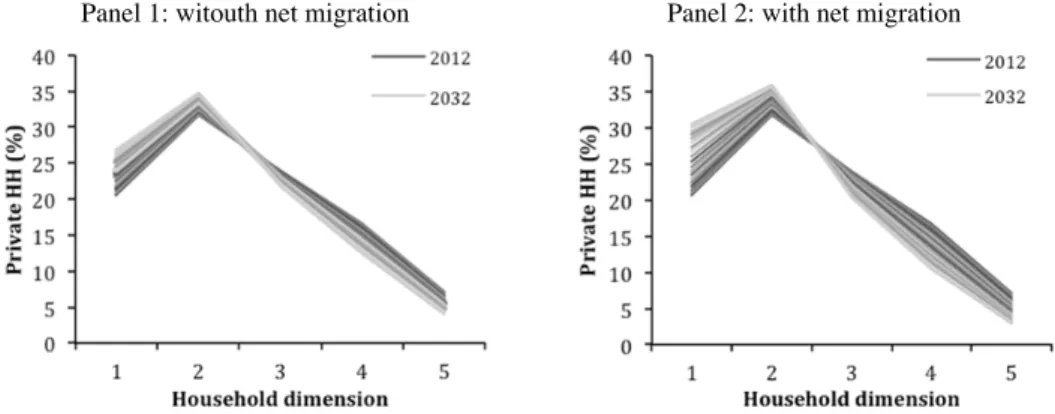
Another important information comes directly from the methodology im-provements proposed by Ediev in 2007 to the household headship method and that allows the identification of more detailed information about the distribution of household sizes. In order to avoid the addiction of more uncertainty to our results, it was our choice to apply these methodological extensions only to the central age-ing scenario, the one that we think to be more likely to occur. Both panels from Figure 4 present the obtained results for the evolution in the proportion of private households with a certain number of persons across the next 20 years, allowing at the same time to differentiate the impact of net migration. As the legend indicates, the darker (both cases) indicates the year of 2012 and the lighter grey corresponds to 2032. The analysis of these results indicates that the proportion of households with dimension 1 and 2 are predominant, and at the same time that this predomi-nance is increasing. This situation means that one or two persons compose the most part of the households, and it is very likely that this become a standard with time. The impact of net migration in the composition of private households can be clear-ly seen in panel 2, where it seems that the proportion of private households with only one person are becoming really close to the ones that accomplish two persons.
This situation refers instantaneously to one of the major hypothesis in this study, which also shares the title designation: “Can Portuguese people expect to age alone in the future?”, and it seems that together with the ageing population structure, the Portuguese population is also walking towards a lonely future that re-sults from different choices and uncontrollable occurrences.
Figure 4 - Proportion of private households with a certain number of persons (central ageing scenario)
Panel 1: witouth net migration Panel 2: with net migration
Source:own calculation, INE - Statistics Portugal.
Still, the previous situation presented by Figure 4 can be reinforced by the re-sults presented in Figure 5 where the proportion of persons living according with different private households size is presented. In both cases, with and without the impact of net migration (panels 1 and 2), it can be seen that at the same time that the proportion of persons living together with more than one person is decreasing, the proportion of individuals living alone or share the private household only with one person more is increasing. Once again, the impact of net migration is shown to imply major influence in the final results. The observed (possible) changes also justify and reinforce the obtained changes in the decrease of the average size of private households across time.
Figure 5 - Proportion of persons living according with different private households size (central ageing scenario)
Panel 1: witouth net migration Panel 2: with net migration
Source:own calculation, INE - Statistics Portugal.
One of the possibilities of using the household headship method is to allow breaking the estimates into different categories, depending always from the speci-ficity of the input information specispeci-ficity. In this case, and following what was
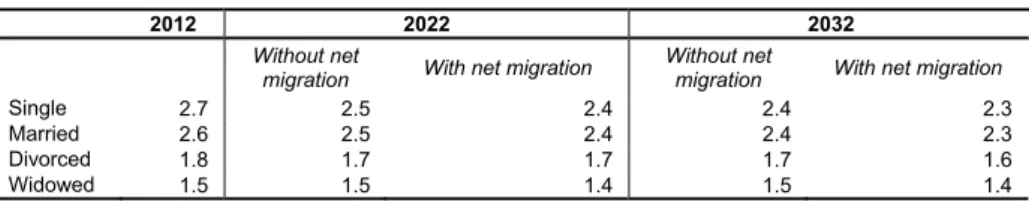
de-fined before as goals, we decided to estimate also the average size of the house-holds taking into account the civil status of the head: single, married, divorced or widowed. Once again, trying to avoid the introduction of more uncertainty into our estimates, the estimates presented in Table 4 are exclusively related to the central ageing scenario.
In a first perspective, it can be seen that the average sizes of the households when the heads are single or married is higher when compared with the divorced and widowed categories. Across time, the tendency in each category is, like it was seen before for the total population (independently of the presented scenarios), for a decrease in the average size of the households across all civil status, independent-ly of the migration impact.
Table 4 - Evolution of average household size, by civil status, 2012-2032, for Portugal with and without the net migration impact (central ageing scenario)
2012 2022 2032
Without net
migration With net migration Without net migration With net migration
Single 2.7 2.5 2.4 2.4 2.3
Married 2.6 2.5 2.4 2.4 2.3
Divorced 1.8 1.7 1.7 1.7 1.6
Widowed 1.5 1.5 1.4 1.5 1.4
Source: own calculation, INE - Statistics Portugal.
The obtained results show that only few of future Portuguese inhabitants pre-dict to get married, breaking with the actual family paradigm and bring up to dis-cussion the necessity for an important reevaluation of their needs. At the same time that individuals become more and more compromised with their own health and living conditions keep improving, mainly due to their own individual genetic pre-disposition and as well from the health improvements that come from technology and medicine (Ziegler & Doblhammer, 2007).
5. Conclusions
According with our results, it is probable that Portugal loses between 1.5 and 3.5 millions of inhabitants until 2032. At the same time, and following the fastest ageing scenario, the number of elderly can increase from 2032606 to 2983888 be-tween 2012 and 2032. This tremendous evolution in the Portuguese population has as consequence the urgent necessity of planning equipment and resources directed to the elderly. One consequence of this remarkable ageing is the expected increase in the number of institutionalized persons in what concerns especially the female case, which present higher life expectancy than males.
The importance of family relationships and family composition with regard to support and care for the elderly, led us to forecast not only the average household size, but also the proportion of private households in function of the number of per-sons resident, and also the proportion of perper-sons living according private house-holds with different size. The obtained results for those projections present a con-traction in the number of large families (3 or more persons) and its proportion in
the total number of families, along with a growing number of small families (1 or 2 persons) and their representation in the Portuguese society. In recent decades the proportion of large families has been declining. However, analyzing the proportion of residents according to private households size we found that, in 2012, the high-est proportion refers to households constituted by 3 individuals
The results also show the devastating effect of fertility decline in Portugal, in particular, concerning the reduction of the family size. At the same time, the ex-traordinary reduction in the proportion of individuals in private households com-posed by 4 to 5 persons, while the proportion of those living in households with 3 persons stays almost unchanged, might be connected with the option of Portuguese couples having one child only. For the elderly living especially in small families with the absence of children or spouse, this situation can create the need for greater support from the community and local health services. This need become more acute in periods of economic depression.
Under the observed circumstances, it can be concluded that planning elderly demands in what concerns to health care and health expenditure, should take into account not only the number of seniors that we projected for the near future, but also predict changes in their living conditions, particularly, their insertion in a small family, the marital status, or the (non)existence of adult children that can support them in the future.
REFERENCES
Ediev, D.M. (2007). On projecting the distribution of private households by size. Vien-na Institute of Demography Working Papers, 4/2007, VienVien-na, Austria.
Linke, W. (1988). The headship approach in modeling households: the case of the
Federal Republic of Germany. In: Modeling Household Formation and Dissolution.
N. Keilman, A. Kuijsten and A. Vossen. Oxford, Clarendon Press.
Mason, A. (1987). HOMES: A Household Model for Economic and Social Studies. East-West Center, Hawaii.
McDonald, P. & Kippen. R. (1998). Household trends and projections: Victoria
1986-2011. Victorian Department of Infrastructure, Melbourne.
Rowland, D.T. (2003). Demographic Methods and Concepts. Oxford University Press, New York.
Zeng, Y., Land, K.C., Wang, Z, Gu, D. (2013). Household and living arrangement
pro-jections at the subnational level: an extended cohort-component approach.
Demog-raphy, 50:827 - 852.
Ziegler, U. & Doblhammer, G. (2007). Cohort changes in the incidence of care need in
West Germany, between 1986 and 2005. Rostock Center-Discussion paper, Rostock
Center for the Study of Demographic Change.
Ziegler, U. & Doblhammer, G. (2010). Care need projections by marital status and