TECHNOLOGICAL CHARACTERIZATION OF TALC ORE FROM CAÇAPAVA DO SUL,
RS-‐BRAZIL FOR DEVELOPMENT OF A PROCESS ROUTE
Submitted 15/11/2017 – Acepted: 30/11/2017 DOI: 10.15628/holos.2017.6600
ABSTRACT
This paper provides technological characterization and preliminary studies for the concentration of talc ore from the municipality of Caçapava do Sul, RS -‐ Brazil, for the purpose of defining its process route. The characterization was made by in bench channel sampling, preparation of the material by comminution, followed by homogenization, fractionation, and analyses of particle size, mineralogy, chemical composition, brightness, density and humidity of the sampled material. Afterwards, magnetic separation studies were carried out using Davis tube and leaching, in order to reduce the impurities, which consisted mainly of iron oxide contamination. After preparation of the sample, it
was possible to obtain a fine material of approximately 65 % passing 37 μm, with similar brightness values between all samples despite a variable distribution of Fe, Ca, Mg and Al contents. The best results of the study occurred for the sample with a granulometric cut of 100# subjected to a magnetic separation of 4050 G and later leaching at 80 °C for a time of 60 min. A maximum brightness of 72.3 % was achieved, with an increase in brightness of 10.3 % in relation to the initial brightness. This product could be applied to the paint, insecticide, textile and paper industries, requiring complementary characterization to fit further specifications.
KEYWORDS: talc; technological characterization; iron impurities; processing. T. R. C. OLIVEIRA1, M. P. PAIVA2
Federal University of Rio Grande do Sul (UFRGS), Federal University of Pampa (UNIPAMPA) taistngminer@ufrgs.br1
148
1. INTRODUCTION
Talc, a noble mineral for cosmetics, paints, and paper, may also be used for ceramics, rubber, insecticides and fertilizers. It occurs in very fine granulometry, in rocks of powdery texture and often has associations with impurities such as titanium, serpentine, dolomite, magnesite, limestone, manganese and iron oxides, sometimes in the form of gangue minerals, sometimes within its crystalline lattice. These impurities influence the variability of ore properties including whiteness, granulometry, texture, chemical composition and hydrophobicity (Pontes & Almeida, 2005).
According to data released in the Mineral Summary of 2015, by the National Department of Mineral Production (DNPM), the production of talc beneficiated in the year 2014 had an increase of 36.9 %. Compared to the previous year, this increase was 28.3 %, while imports grew 8.6 %.
Technological characterization is defined as a fundamental step to optimize the utilization of a mineral resource and allows for precise identification of inefficiencies and losses in processes, enabling an increase of the global yield and correct dimensioning of the beneficiation route (Neumann et al., 2004).
In this context, this work provides technological characterization and preliminary studies for the concentration of a talc ore, of a deposit located in Caçapava do Sul-‐RS, for the purpose of defining its process route.
2. BIBLIOGRAFHIC REVIEW
2.1. Talc
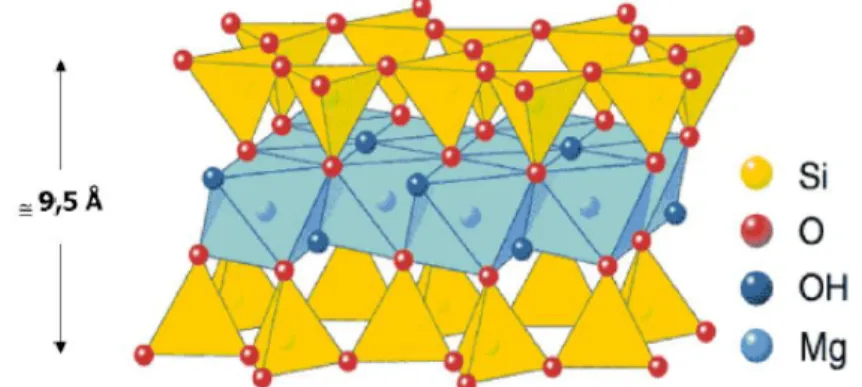
Pontes & Almeida (2005) describe talc as hydrated magnesium filosilicate of the chemical formula Mg3 (Si4O10)(OH)2, with "tot" spatial arrangement represented by two tetrahedral sheets -‐
t-‐ linked by Van Der Waals bonds and formed by atoms of silicon and oxygen (siloxane sheet) that surround an octahedral sheet -‐o formed by magnesium and hydroxyl (brucite leaf).
According to Camara (2003), talc can occur in two different symmetries, monoclinic (more common) and triclinic, wherein the crystalline structure (Figure 1) presents a triple layer, being a sheet of magnesium hydroxide and two leaves composed of tetrahedra of SiO4-‐4. The external
siliceous faces are apolar and oleophilic, hydrophobic, aerophilic and inert.
Figure 1: Crystal structure of talc ore (Camara, 2003).
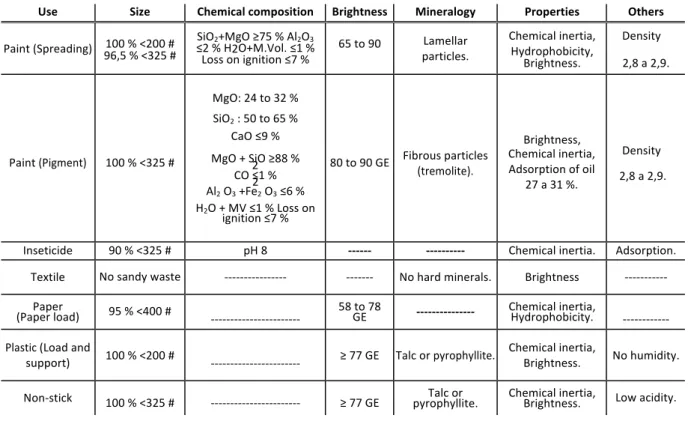
Monte et al. (2003) considers that the physicochemical properties of talc products should vary according to the destination of the product as explained in Table 1, emphasizing the importance of characteristics such as granulometry, degree of purity and color of the product. The Table 1 shows some parameters required by different industries depending on the application of the talc ore.
Table 1: Industrial specifications.
GE = General Eletric Parameter
With respect to the use of talc ore in the manufacture of paints, it is used as charge and pigment in external uses of surfaces exposed to abrasion and low visibility paints. On the other hand, in the production of valve rubbers, talc is used as a spray to lubricate molds and prevent the surfaces from binding during the manufacture of the product. In the textile industry, after reaching very fine granulometry, talc gives weight and blemishes cotton fabrics, twines and yarns (Fabris, 2006), being this same bleaching function exercised in the paper industry, besides acting as a load when incorporated into the mass and to avoid reactions with other materials used in papermaking (Campos, 2011).
2.2. Geological Characterization
The talc ore from this deposit originates from hydrothermal alteration processes of magnesium minerals, mainly olivine and orthopyroxenes, but may also occur from a process of regional metamorphism or contact with magnesian calcareous or ultrabasic rocks. This occurrence is associated with minerals of biotite, chlorite, serpentine and carbonates (Machado, 2016).
As for the local geology, it was observed that the talc mineral is deposited either intercalated or sometimes on the amphibolite, evidenced by the outcrop on the west side of the bench. The amphibolite in this deposit is a metamorphic rock of basic igneous origin (Winge, 2016), relatively hard with a presence of quartz that accompanies the shale of the deposit.
Use Size Chemical composition Brightness Mineralogy Properties Others
Paint (Spreading) 100 % <200 # 96,5 % <325 # ≤2 % H2O+M.Vol. ≤1 % SiO2+MgO ≥75 % Al2O3 Loss on ignition ≤7 %
65 to 90 particles. Lamellar Chemical inertia, Hydrophobicity, Brightness. Density 2,8 a 2,9. Paint (Pigment) 100 % <325 # MgO: 24 to 32 % SiO2 : 50 to 65 % CaO ≤9 % MgO + SiO ≥88 % 2 CO ≤1 % 2 Al2 O3 +Fe2 O3 ≤6 % H2O + MV ≤1 % Loss on
ignition ≤7 %
80 to 90 GE Fibrous particles (tremolite).
Brightness, Chemical inertia, Adsorption of oil
27 a 31 %.
Density 2,8 a 2,9.
Inseticide 90 % <325 # pH 8 -‐-‐-‐-‐-‐-‐ -‐-‐-‐-‐-‐-‐-‐-‐-‐-‐ Chemical inertia. Adsorption. Textile No sandy waste -‐-‐-‐-‐-‐-‐-‐-‐-‐-‐-‐-‐-‐-‐-‐-‐ -‐-‐-‐-‐-‐-‐-‐ No hard minerals. Brightness -‐-‐-‐-‐-‐-‐-‐-‐-‐-‐-‐
Paper
(Paper load) 95 % <400 # -‐-‐-‐-‐-‐-‐-‐-‐-‐-‐-‐-‐-‐-‐-‐-‐-‐-‐-‐-‐-‐-‐-‐ 58 to 78 GE -‐-‐-‐-‐-‐-‐-‐-‐-‐-‐-‐-‐-‐-‐-‐ Chemical inertia, Hydrophobicity. -‐-‐-‐-‐-‐-‐-‐-‐-‐-‐-‐-‐ Plastic (Load and
support) 100 % <200 # -‐-‐-‐-‐-‐-‐-‐-‐-‐-‐-‐-‐-‐-‐-‐-‐-‐-‐-‐-‐-‐-‐-‐ ≥ 77 GE Talc or pyrophyllite.
Chemical inertia,
Brightness. No humidity. Non-‐stick 100 % <325 # -‐-‐-‐-‐-‐-‐-‐-‐-‐-‐-‐-‐-‐-‐-‐-‐-‐-‐-‐-‐-‐-‐-‐ ≥ 77 GE pyrophyllite. Talc or Chemical inertia, Brightness. Low acidity.
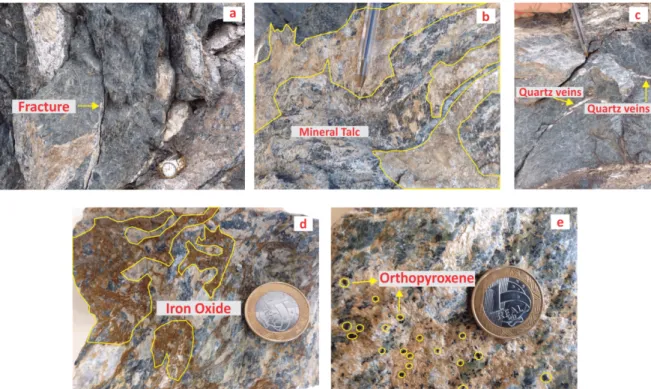
150 To the west of the sampled basin, there are talc-‐filled fractures (Figure 2(a) and 2(b)) and quartz veins of ~ 0.5 cm (Figure 2(c)). To the east of the sampled basin, talc ore predominates with varying degrees of weathering from medium to high. Mineral occurrences in medium weathering zones include: dolomite minerals (CaMg(CO3)2), orthopyroxenes of the chemical formula (Mg,
Fe)2Si2O6 (Figure 2(e)) and iron oxides (Fe2O3) with a content lower than that found in zones of
high weathering. In high weathering zones, the presence of high levels of iron oxide occurs (Figure 2(d)), giving reddish coloration to the deposit, as observed by Walker (1967) when affirming that the coating of a great majority of the grains of these rocks by iron oxide films gives rise to the reddish color present in regions of the deposit. It should be noted that all such identifications were possible through X-‐Ray Fluorescence spectrometry analysis in samples taken from the deposit.
Figure 2: (a) Fracture; (b) mineral talc filling in the fractures; (c) quartz veins observed in the amphibolite; (d) iron oxide
(Fe2O3) e (e) orthopyroxene ((Mg,Fe)2Si2O6) identified by X-‐Ray Fluorescence Spectroscopy.
2.3. Technological Characterization
Fontes (2013) defines the technological characterization of a specularite iron ore as the gathering of information such as density, magnetic properties and others, allowing knowledge of the chemical and physical properties of a given ore. Such characterization aims at stipulating a beneficiation process route based on ore and market needs, seeking greater efficiency in the possible changes of small properties during the process.
The successful separation of minerals of interest by concentration operations depends on 3 basic conditions (Fundação Cristiano Ottoni, 2016):
i. liberation: where there is individualization of the species in order to make them free; ii. differentiability: existence of a property (natural or induced) capable of differentiating the mineral species from each other (Table 2);
iii. dynamic separability: occurs when a compound force acts in the separation zone of the
equipment by promoting different trajectories to the particles in response to the different characteristics of the material.
Table 2: Treatment Method through differentiability of minerals.
Properties Methods
Density Liquid or dense medium
Texture and friability Comminution, classification or screening
Magnetic Susceptibility Magnetic Separation
Surface reactivity Flotation
According to Neumann et al. (2010), the technological characterization of an ore varies according to the mineralogy and its inherent properties, as well as the scope and objectives of the characterization. Thus, the characterization has four main stages, independent of each other, defined as follows:
i. fractionation of the sample: facilitates the identification of minerals, quantification of phases, and establishes some physical properties;
ii. phase identification: for example, clear and easy-‐to-‐interpret signal of concentrated minerals in fractionation;
iii. quantification of minerals;
iv. liberation of the mineral of interest: related to the minerals of the gangue, it is verified in several ranges of particle size.
2.4. Leaching study
Dissolution of the mineral by water or aqueous solution of a leaching agent is termed leaching. The basic characteristic of leaching is the ability to treat ores with low grades, based on the specificity of the leaching agent used, while keeping the mineral of value in a solid state. When this process occurs for the purposes of removing impurities, it is called reverse leaching (Heck, 2016).
When processing talc ore to reduce iron concentration, Fabris (2006), who used 4 M hydrochloric acid (HCl), with an initial sample mass of 5 g for 30 min and at a temperature of 80 °C, obtained positive results for iron extraction, in the order of 78.7 %. In this same study, by exceeding the time (30 min) of exposure of the sample to the acid, the brightness of the product was maintained. In addition, it was observed that temperature and time are determining factors in the iron dissociation process, proving efficacy of the tests by subjecting samples up to 80 °C and 30 min, respectively.
Also, in order to reduce iron content within samples, Rodrigues (2010) carried out chemical attacks on flotation concentrate residues from soapstone handicrafts using HCl, starting with the flotation concentrate with a brightness of 70.8 % and obtaining a final product with maximum brightness of 86.5 % using the following reactions:
𝐹𝑒𝑂 + 𝐻𝐶𝑙 → 𝐹𝑒𝐶𝑙!+ 𝐻!𝑂 (1) 𝐹𝑒!𝑂!+ 𝐹𝑒 + 6𝐻𝐶𝑙 → 3𝐹𝑒𝐶𝑙!+ 3𝐻!𝑂 (2)
152 In the same work, Rodrigues (2010) when performing acid leaching in a crude sample of the fine (<74 μm) soapstone, with initial brightness of 51.8 %, obtained a brightness of 77.4 % in the product. To obtain these results, a solution of 4 M HCl, of temperature around 80 °C, was used for a time of 60 min.
The best brightness occurred in the higher reaction time (60 min), with temperature above 75 °C and HCl concentrations above 3.5 M.
2.5. Magnetic separation study
Magnetic separation is an important method of processing for concentration and purification of ores, which occurs due to different individual responses associated between mineralogical species and a magnetic field. This magnetic field is determined in function of the response of a property called magnetic susceptibility (Silva, 2012).
Rodrigues (2010) carried out magnetic separation studies with samples of soapstone, using 20 % solids and granulometry larger and smaller than 74 μm, in which magnetic fields (3000, 4300 and 4900 G) and currents (3, 5 and 7 A) were used.
The best results were obtained in the particle size fraction smaller than 74 μm, because with the fraction greater than 74 μm there were inclusions of oxidized iron particles in the talc beads due to the attraction generated by the magnetic field. The application of 4900 G promoted a 6 % increase in brightness.
Fontes (2013) applied low and high density magnetic fields to a specularite iron ore of 0.21 to 0.30 mm granulometry, in order to attract the particles and concentrate them. This concentration generated ferromagnetic material as a concentrated product in the order of 67 %, according to the distribution of the mass fractions of the material after magnetic separation.
Fontes (2013) states that low magnetic fields are applied to materials with high magnetic susceptibility, while high magnetic fields must be applied to paramagnetic materials, and considers the control of the feed rate to be important, that is, the speed and the flow with which the particles pass through the magnetic field, preferring a low velocity of the flow to prevent magnetic particles from being entrained with the non-‐magnetic particles.
3. METHODOLOGY
3.1. Channel sampling
The talc ore sample was collect by channel sampling along 47 m of the face of the bench, as seen in Figure 3, maintaining a constant average height between the base and the top of the channel with the following dimensions: width of 10 cm and depth of 4 cm, previously demarcated, totaling 440 kg of sampled material. This step was preceded by the cleaning of the face of the bench to remove the chemical alteration (surface oxidation) of the rock.
The channel was sampled using a geological hammer, tip, slit and mallet, and all material collected, meter by meter, was collected directly in a plastic tray, positioned just below the lower level of the sampled channel, and stored in clean, identified plastic bags.
Figure 3: Channel sampling after collecting material.
3.2. Sample preparation
Sample preparation was performed by primary jaw crusher (Figure 4 (a)). Afterwards, the material was placed in a longitudinal pile mounted on a canvas for homogenization and fractionation (Góes et al., 2004), and stored in closed plastic containers to preserve the characteristics of the sample. An aliquot of ~100 kg was subjected to secondary crushing by roller crushers, and the material was screened and sieved in a 3.35 mm mesh. The material retained in the mesh returned to the roller crusher to obtain a 100 % <3.35 mm product (Figure 4 (b)).
Afterwards, all material was homogenized and fractionated by the longitudinal pile method and the aliquots obtained (~6 kg) were stored in plastic bags. Grinding tests were performed in ball mills and a ceramic jug with ~3 L volume. Aliquots of 336.7 g of the crushed sample were milled at various times for a determination of the feed size F80 (80 % passing) of 74 μm.
154
3.3. Particle size analysis
The granulometric distribution was tested by wet sieving, with aliquots of ~100 g of milled material in laboratory sieves of 20 cm diameter with the following meshes: 100 # (149 μm), 150 # (105 μm), 200 # (74 μm), 325 # (44 μm) and 400 # (37 μm). The fractions retained in the sieves were vacuum filtered, oven dried at 50 °C for 24 h, and weighed.
3.4. Density and humidity analyses
The determination of the density of the talc ore was performed in duplicate by the method of picnometry (Sampaio et al., 2007). For such, a sample weight of approximately 1 g of heavy ground talc ore was used, along with an analytical balance, a pycnometer and distilled / deionized water.
Moisture analysis was performed in duplicate with aliquots of 5 g of ground talc ore sample, weighed on analytical balance, and oven dried at 105 °C for 5 h. Then the whole was taken to the desiccator for cooling and subsequent weighing. The procedure was repeated until reaching constant weight or difference of at least 0.001 g.
3.5. Mineralogical analysis
The mineralogy of the talc ore was obtained by XRD analysis using a 20 g aliquot of material from the mill. This analysis was conducted by the Department of Physics/UFRGS using an X-‐ray diffractometer of the brand Siemens, model D-‐500, with curved graphite monochromator in the secondary beam and fixed anode tube of Cu, operating at 40 kV and 17.5 mA.
3.6. Chemical analysis
The sample and the granulometric fractions were analyzed for the following elements: Mg, Ca, Al and Fe, by the Atomic Flame Absorption Spectrometry method, at the Institute of Chemistry/UFRGS.
3.7. Brightness analysis
The whiteness analysis was performed according to ISO 2470 (ABNT, 2001), which assigns weight to reflectance in the range of 400 to 510 nm (Gonçalves, 2009). For this purpose, the aliquots were pulverized in an orbital disc mill, pressed for pellet formation and the reflectances obtained using a spectrophotometer previously calibrated with a white standard. The analyzes were carried out for the ground sample with and without a cut in the material passing 100 #, with the granulometric fractions, and with the products of the magnetic separation and the leaching.
3.8. Magnetic separation study
Magnetic separation studies were performed with a Davis Tube separator (Inbras brand, EDT model), following the procedure described in the manufacturer's manual. The separation tests were fed with two types of samples previously milled: one sample with no granulometric
cut and the other with a cut at 100 # (150 μm). For these samples two magnetic fields of 3050 G (1.4 A) and 4050 G (2.0 A) were applied.
3.9. Leaching study
The leaching studies were performed with aliquots of 5 g of talc ore. To these samples 4 M HCl was added and the pulp (15 % w/w solids) from this mixture was stirred using a magnetic stirrer with rotation control and stirring (~1000 rpm). Tests were performed at room temperature (~22 °C) and heating (~80 ±5 °C). The contact times were from 10 to 60 min.
Leaching tests were performed with the non -‐ magnetic product from the magnetic separation test of the sample (100 #) and a field of 4050 G (2.0 A), and for the sample with a granulometric cut (100 #). For these leaching tests, heating at 80 ±5 °C for 60 min was used.
4. RESULTS AND DISCUSSIONS
4.1. Characterization of the talc sample
Table 3 summarizes the characterization results of the ground talc ore sample. The relative density of 2.7 coincides with the value of silicate minerals. In addition, it presented natural humidity <1 % and brightness of ~60 %. The sample had high contents of the elements (Mg, Al, Fe and Ca).
Table 3: Summary of the ground talc sample characterization.
Relative Density Humidity (%) Brightness (%) Fe (mg/g) Ca (mg/g) Mg (mg/g) Al (mg/g)
2,7 0,9 59 34 17 200 147
Five crystalline phases were identified in the mineralogical analysis: antigorite (A), clinochlor (C) and magnesite (M), constituents of the ore minerals, along with dolomite (D) and talc (E). The peak of the talc phase presents high intensity, which shows the excellent crystallization of this phase, however, causing the non-‐observation of phases near the baseline, such as ferromagnetic phases (Figure 5). Also, some phases overlap characterizing low symmetry, common in polycrystalline samples.
156
Figure 5: X – Ray Diffractogram of the ground talc sample.
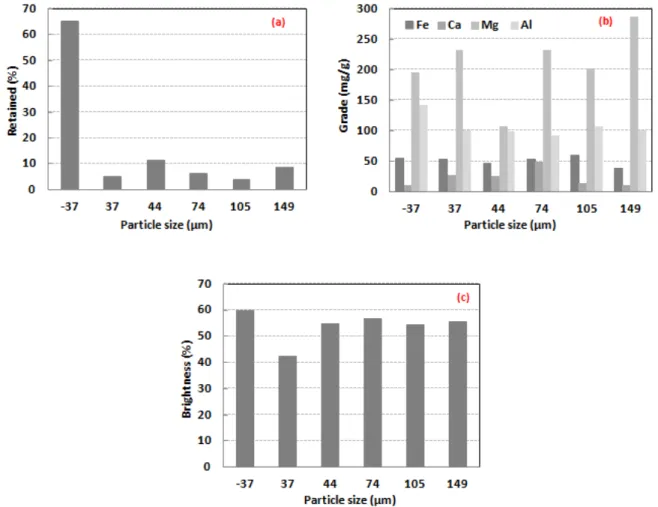
The particle size distribution in the fraction <37 μm presented the highest value, and a maximum of approximately 10 % for all other fractions (Figure 6 (a)). The contents of Fe, Ca, Mg and Al, as a function of the granulometric bands, presented different behaviors and are shown in Figure 6 (b). The Fe content (~50 mg/g) is nearly evenly distributed in all particle size fractions. The maximum content of Ca (~50 mg/g) was observed in the fraction of 74 μm and of Al in the finer fraction (<37 μm). However, the Mg presented higher content in the fractions <44 μm and in the fractions >74 μm, whereas the brightness presented similar behavior for all fractions with values greater than 50 %, except for the fraction retaining 37 μm (Figure 6 (c)).
Figure 6: (a) Granulometric distribution of the ground talc sample, (b) grades and (c) brightness of each product
retained.
4.2. Magnetic separation study
Considering the overall mass recovery, in which the losses of the granulometric cut and magnetic separation steps were evaluated, the results obtained for the cut samples (85 % and 86 %) were lower than those obtained for the samples without cutting (91 % and 94 %). The largest overall mass recovery was obtained after magnetic separation, without cutting, of the same sample (Table 4). The magnetic separation process resulted in an increase in brightness of about 5.7 % in the uncut sample when subjected to a 4050 G field and after separation the final brightness analysis showed very close results (~64 %).
Table 4: Magnetic separation test result.
Feed Magnetic field (G) Current (A) -‐ Recovery (%) Global Recovery (%) Mass Brightness (%)
Start End Cut (100 #) 1,4 -‐ 3050 94 85 61 64 Cut (100 #) 2,0 -‐ 4050 94 86 61 63 No cut 1,4 -‐ 3050 94 94 59 64 No cut 2,0 -‐ 4050 91 91 59 65
158
4.3. Leaching study
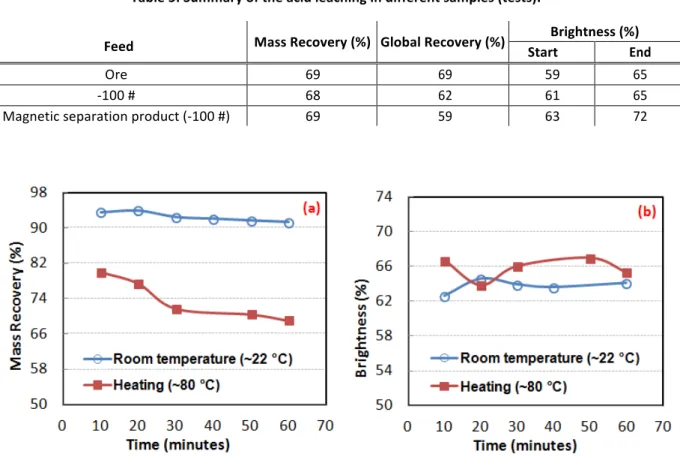
Figure 7 (a) shows the mass recovery of the products from the leaching tests at ~22 °C (room temperature) and at ~80 ±5 °C. When performing the studies at 80 ±5 °C, the recovery decreased by approximately 10 % for the time interval between 10 and 60 min, stabilizing after 30 min. However, at room temperature this difference was only approximately 2 %, being practically constant over time, and showing that the use of temperature increases leaching kinetics. However, the difference in brightness between the products of the different temperatures was about 4 % (Figure 7 (b)). The maximum brightness (72 %) was obtained after the leaching test using the magnetic separation sample with 100 # cut, which also presented the largest increase (10 %) in relation to the initial brightness (Table 5) and the lowest overall mass recovery.
Table 5: Summary of the acid leaching in different samples (tests).
Feed Mass Recovery (%) Global Recovery (%) Start Brightness (%) End
Ore 69 69 59 65
-‐100 # 68 62 61 65
Magnetic separation product (-‐100 #) 69 59 63 72
Figure 7: (a) Mass Recovery and (b) brightness of the leaching products in the ground talc sample.
5. CONCLUSIONS
A fine talc material (~65 %) was obtained below 37 μm after crushing and milling the sample. This granulometry must be adequate to market requirements. The distributions of Fe, Ca, Mg and Al contents of the analyzed elements presented different behaviors. The relative density of talc ore is characteristic of a silicate ore. However, the brightness showed a similarity between the values obtained for the talc ore sample, which meets the load requirements of the paper industry, although it has a high content of very reactive elements (Fe, Ca and Mg). Also, according to the data obtained by grain size, the cut of the material retained in 100 # did not influence the
final brightness of the feed. As for the mineralogical characterization, it was possible to identify the 5 main phases present in the talc ore (antigorite, clinochlor, magnesite, dolomite and talc), including ore and gangue minerals.
In all magnetic separation tests, a final brightness of the non-‐magnetic product of approximately 64 % was attained. This product could be applied in the paper industry pending a further examination of its constituent components.
The leaching studies, which involved heating, resulted in the greatest decrease of the mass recovery, which stabilized after 30 min of testing. When raising the temperature, a greater speed in the reaction of leaching was obtained, reducing the contact time between the ore and the leaching agent. These factors should be considered for future design of the leaching equipment and the need to apply heating in an industrial plant.
The best result of the study was obtained using the sample with a granulometric cut of 100 # that was submitted to the magnetic separation (4050 G) and later leached at 80 °C during the time of 60 min. For this test, a maximum brightness of 72 % was obtained, with an increase of 10 % over the initial brightness. This product could be applied, for example, to the paint, insecticide, textile and paper industry, requiring complementary characterization to fit each specification. The costs of implementation, operation and maintenance of the application of temperature to the process should be considered. Finally, future flotation studies are suggested to verify the applicability of the process.
6. REFERENCES
ARIOLI, E. E., ANDRIOTTI, J. L. Silva. (2016). Representatividade da amostragem na prospecção geoquímica -‐ CPRM. Recovered in: <http://rigeo.cprm.gov.br/xmlui/handle/doc/487>. Acess: 20/06/2016.
BITENCOURT, M. F. (1983). Geologia, petrologia e estrutura dos metamorfitos da região de Caçapava do Sul, RS. Dissertação de Mestrado. Curso de Pós-‐Graduação em Geociências, UFRGS. pp. 161.
CAMARA, A. L. (2003). Uso de talco nacional como aditivo adsorvente de piches e materiais pegajosos no processo de fabricação do papel. Dissertação de Mestrado. Curso de Pós-‐ Graduação em Engenharia Metalúrgica e de Minas, UFMG. pp. 48-‐51.
CAMPOS, L. E. G. (2001). Balanço Mineral Brasileiro. Departamento Nacional de Produção Mineral – DNPM. pp.10.
FABRIS, I. L. (2006). Processamento químico do minério Talco-‐Silicato de Magnésio visando redução dos compostos de ferro. Dissertação de Mestrado. Programa de Pós-‐Graduação em Engenharia Química da Universidade Federal de Santa Catarina, UFSC. pp. 35-‐38; 58-‐85.
FONTES, A. V. (2013). Caracterização tecnológica de minério de ferro especularítico. Trabalho de conclusão do curso de Geologia. UFRJ. pp. 7-‐43.
160
FUNDAÇÃO CRISTIANO OTTONI. (2016). Apostila do curso de Beneficiamento de Minério. Recovered in: <http://sistemas.eel.usp.br/docentes/arquivos/1922320/LOM3071/P1.6.
CaracterizacaodeMinerios.pdf>. Acess: 17/06/2016.
GÓES, M. A. C de., LUZ, A. B da., POSSA, M. V. (2004). Amostragem. Tratamento de Minérios. CENTRO DE TECNOLOGIA MINERAL (CETEM). (4). pp. 44.
GONÇALVES, Í. G. (2009). Determinação da concentração de contaminantes no caolim através da teoria de Kubelka – Munk. Dissertação de Mestrado. Curso de Pós-‐Graduação em Engenharia de Minas, UFRGS. pp. 5.
GOÑI, J.C., GOSO, H., ISSLER, R. S. (1962). Estratigrafia e Geologia Econômica do Pré-‐Cambriano e Eopaleozóico Uruguaio e Sul-‐Riograndense. Universidade Federal do Rio Grande do Sul. (3).
HALDAR, S. K. (2012). Sampling Methods. Mineral Exploration – Principles and Applications. (7). pp. 128-‐129.
HECK, N. C. (2016). Notas de Aula. UFRGS – Universidade Federal do Rio Grande do Sul. Recovered in: < http://www.ct.ufrgs.br/ntcm/graduacao/ENG06631/Lixiviacao.pdf>. Acess: 18/06/2016.
KAHN, H., SANT’AGOSTINO, L.M., TASSINARI, M.M.M.L., ULSEN, C., BRAZ, A.B. (2010). Apatite from alkaline complexes-‐behavior in mineral processing and characterization techiniques. Beneficiation of Phosphates – Technology Advance and Adoption. 6, pp.60.
LUZ, A.B., SAMPAIO, J.A., ALMEIDA, S.L.M. (2004). Tratamento de Minérios. CETEM.4, pp. 858.
LOPES, C.G. (2012). Proveniência das rochas metassedimentares detríticas do complexo Passo Feio – Terreno São Gabriel, Caçapava do Sul – RS. Trabalho de conclusão do curso de Geologia. UFRGS. pp. 22.
MACHADO, F. B. (2016). UNESP -‐ Universidade Estadual Paulista. Recovered in:
<http://www.rc.unesp.br/museudpm/banco/silicatos/filossilicatos/talco.html>. Acess:
17/07/2016.
MONTE, M.B.L., TRIGUEIRO, F.E., PAIVA, P.R.P. (2003). Técnicas e alternativas para a modificação do caulim. Rochas e Minerais Industriais. pp. 32.
NEUMANN, R., SCHENEIDER, C. L., NETO, A. A. (2004). Caracterização Tecnológica de Minérios. CENTRO DE TECNOLOGIA MINERAL (CETEM). (4). pp.55.
NEUMANN, R., SCHENEIDER, C. L., NETO, A. A. (2010). Caracterização Tecnológica de Minérios -‐ CENTRO DE TECNOLOGIA MINERAL (CETEM). (5). pp.85-‐87.
DEPARTAMENTO NACIONAL DE PRODUÇÃO MINERAL. (2010). Anuário Mineral Brasileiro. 35, pp.798.
PONTES, I. F., ALMEIDA, S.L.M. (2005). Talco. Rochas & Minerais Industriais – Usos e especificações. CETEM, pp. 607-‐628.
RIBEIRO, M., BOCCHI, P.R., FIGUEIREDO FILHO, P.M., TESSARI, R.I. (1966). Geologia da Quadrícula de Caçapava do Sul. 127, pp.232.
RIBEIRO, M. (1970). Geologia da folha de Bom Jardim: Rio Grande do Sul-‐ Brasil. In: Boletim: Divisão de Geologia e Mineralogia. 247, pp.1-‐142.
RODRIGUES, M.L.M., LIMA, R.M.F. (2011). Purificação de resíduos de oficina de artesanato em pedra-‐sabão por flotação e alvejamento químico. REM: Revista Escola de Minas, 64 (3), pp.353-‐ 357.
SAMPAIO, J. A., SILVA, F. A. N. G da. (2007). Determinação das densidades de sólidos e de polpa. Tratamento de minérios – Práticas Laboratoriais. CENTRO DE TECNOLOGIA MINERAL (CETEM). pp.40-‐45.
SILVA, A. C. (2012). Universidade Federal de Goiás (UFG). Concentração física de minerais.
Recovered in: <https://cetm_engminas.catalao.ufg.br/up/596/o/cfm_05.pdf>. Acess:
20/06/2016.
SILVA, R. F. (2009). Operações Unitárias I. Recovered in:
<http://www.ebah.com.br/content/ABAAAAtPkAD/flotacao-‐pdf>. Acess: 20/06/2016.
UFRGS -‐ Universidade Federal do Rio Grande do Sul. (1998). Projeto Caçapava do Sul: Mapeamento Geológico 1:25.000.
WALKER, T. R. (1967). Formation of red beds in modern and ancient deserts. Geological Society of America Bulletin. 78, pp. 353-‐368.
WINGE, M. (2016). CPRM -‐ Companhia de Pesquisa de Recursos Minerais. Recovered in: <http://sigep.cprm.gov.br/glossario/verbete/anfibolito.htm>. Acess: 15/07/2016.