A Work Project, presented as part of the requirements for the Award of a Master Degree in Finance from the NOVA – School of Business and Economics.
A Project carried out on the Master in Finance Program,
under the supervision of:
Professor Doutor Duarte Pitta Ferraz and Professor Doutor
Ilídio Tomás Lopes
6 January 2017
Executive Compensation: Does
Firm Performance Impact
Executive Salaries? The Cases
of UK, Portugal, Spain and
Sweden and Denmark
Carolina Filipa Sales Dantas Simões Rodrigues 2332Table of Contents
Abstract ... 2 1. Introduction ... 3 2. Literature Review ... 3 2.1. Compensation ... 3 2.2. Agency Theory ... 72.3. ROA and Returns ... 8
2.4. Market Trends ... 9 3. Methodology ... 10 3.1. Data... 10 3.2. Method ... 11 3.3. Dependent variables ... 11 3.4. Independent variables ... 12 3.5. Regressions... 12 4. Results ... 12 4.1. UK ... 12 4.1.1 Executive Compensation ... 12
4.1.2. Total and Bonus CEO Compensation ... 13
4.1.3. Total Board of Directors Compensation ... 15
4.2. Sweden and Denmark ... 16
4.2.1 Executive Compensation ... 16
4.2.2. Total and Bonus CEO Compensation ... 17
4.2.3. Total Board of Directors Compensation ... 18
4.3. Portugal and Spain ... 19
4.3.1 Executive Compensation ... 19
4.3.2. Total and Bonus CEO Compensation ... 20
4.3.3. Total Board of Directors Compensation ... 22
5. Conclusion ... 23
Abstract
The dissertation researches the impact that key performance measures, notably, ROA and ROE, Turnover, Net Dividend Yield, have on executives’ compensation, focusing on three specific regions, the United Kingdom, Sweden and Denmark, and Portugal and Spain.
The method used was to apply an econometric regression model –OLS–, with selected corrections, due to heteroscedasticity by means of a robust regression. The sample consisted of 98 FTSE100 Companies, 62 OMX Nordic companies, and 40 companies from IBEX and PSI20 combined.
The results obtained showed there is little evidence of the relation of firm performance with compensation, but that there is a strong relationship between these variables and company size, which is most significant in the UK. Also, there are marked differences amongst the regions, namely the significance that Net Dividend Yield has in the region of Iberia, and the non-significance of most variables for the Nordic region.
1. Introduction
The correlation between executive compensation and firm performance has been vastly studied over the years, with a large increase in popularity since the Enron, Worldcom and Parmalat’s scandals, where the compensation scheme incentivized executives to sacrifice long-term benefits for short-term ones to maximise bonuses, as well as, the 2008 financial crisis, resulting in banks’ bankruptcies, while CEOs maintained or increased salaries and bonuses. Investors became aware of the magnitude of CEOs’ compensation packages, since 72% of the 50 biggest layoff leaders ended 2009 with a profit (Anderson, S. et al., 2010), as well as situations where CEOs that laid-off hundreds of employees received millionaire bonuses. Due to these situations, interest has been sparked in reviewing executives’ compensation packages to understand if, in fact, their compensation helped to align their interests with those of the firm.
In this empirical work, different types of compensation are regressed for three different regions (UK, two Nordic countries, and Iberia), to find insights on how this relationship differs from country to country, as well as to identify selected similarities in terms of the most relevant independent variables; the objective is also to research if there are differences among regions, which were not clear before this research.
2. Literature Review
2.1. Compensation
Compensation has been vastly studied in different contexts, whether executives are receiving enough, too much or the exact amount, to align their interests with those of the firm and maximise shareholder gains.
Compensation as an incentive
According to (Zajac, E.J., 1990), compensation is seen as a “control mechanism for increasing individual motivation and achievement”, which is in agreement with what (Ryan, H.E. & Wiggins, R.A., 2004)‘s results that state, “compensation is a reinforcing mechanism”. This study further says that “independent boards, which are generally associated with good corporate governance, receive compensation packages that are more closely aligned with shareholder wealth maximization”. There is a consensus that compensation is used as an incentive to align executives’ interest with those of shareholders as to maximize wealth.
Managerial entrenchment
The concept of managerial entrenchment is discussed in various studies, namely (Ryan, H.E. & Wiggins, R.A., 2004) that states that “firms with entrenched managers receive significantly smaller compensation packages” and that they receive “a smaller proportion of compensation in the form of equity-based awards”. They also argue that “directors on boards with more insiders and larger boards also receive less equity-based pay as a percentage of their total compensation”. This suggests that as executives become entrenched, their compensation is less composed of components that align their interests with those of shareholders, and more cash based, they receive more without having to make sure the shareholder wealth is maximized, guaranteeing their pay even if the company performs poorly.
Executives can influence their own pay
Several studies argue that executives can influence their own pay, for instance, (Ryan, H.E. & Wiggins, R.A., 2004) claims that “directors or CEO influence the size and the structure of the compensation package in their own interest”. Furthermore, (Boyle, G. & Roberts, H., 2012) argues initially that they expect executives in the compensation committees to have the highest salaries, but later discover that, comparing firms with the CEO on the board, on the committee and excluded from
both, that in contrast with popular belief that a CEO being present on the compensation committee would influence their salary positively, the “CEOs who sit on the compensation committee receive the lowest annual growth in compensation but the firms they lead also perform significantly less well”. Suggesting that at least in New Zealand, where the study is conducted, CEOs present on the board act rather conservatively compared to when they are not, presenting a “challenge to the ‘managerial power’ view of CEO compensation, since this would imply that CEOs use compensation committee presence to extract excess compensation”. Furthermore, they find that “CEOs who are not on the board lead the best-performing firms, but receive relatively little reward for doing so”, agreeing with the theory that the most independent boards are the ones that are able to monitor CEOs the best, and that have best corporate governance and therefore results.
In (Ryan, H.E. & Wiggins, R.A., 2004) there are results that suggest a “direct relation between board independence and the change in director compensation”, which stems from the discovery that “firms with CEOs who also chair the board are less likely to increase the percentage of equity awards or replace cash pay with equity”, signifying that firms with boards dependent on the CEO tend to lose incentive to control the CEO and let them change their compensation package so that it is less and less influenced by firm performance, making sure they keep their compensation high in the short term and possibly sacrifice long-term gains for the firm.
Different types of compensation
There are varying types of compensation, “usually composed of multiple types of pay, including salary, cash bonus, stock bonuses and stock options, among others” according to (Zajac, E.J., 1990). The components that are most popular tend to vary with the region that is being analysed, for instance, (Basu, S. et al., 2007), states that “in Japan, top executive compensation typically consists of cash salary and cash bonus. Stock-based compensation, such as stock options and stock grants, was not used until recently due to legal restrictions on share buybacks and unfavourable tax treatments”. This
shows that one must be wary of the type of compensation popular in a specific country or region before analysing the effect that firms’ performances have on them. (Ely, K.M., 1991) explains that “the shift toward long-term plans at this time is consistent with the need for new types of incentive schemes brought about by deregulation and changes in bank strategies”, which is in accordance with the studies discussed before.
Another study, (Boyle, G. & Roberts, H., 2012) uses only the salary, bonus and allowances components because in New Zealand, where the study is focused, stock and option grants are not a popular form of compensation, and therefore not relevant to the study. They do claim that the important part of compensation to use is the “firm awarded compensation, i.e. remuneration that is under the direct control of the firm”, which is in line with several other studies. In contrast to these examples, (Sun, J., Cahan, S.F. & Emanuel, D., 2009) find that “CEO stock option grants for firm with high comprehensive compensation committee quality generate higher future operating income”, but that “small firms, low growth firms, and firms with losses have problems that cannot be easily addressed through incentive compensation”, and therefore there may be some firms in the sample for which there is no correlation between compensation and firm performance, due to these characteristics.
Different studies analyse varying components of compensation, with (Ely, K.M., 1991) stating that “the use of all components may not be appropriate” because there is “bias arising from errors in measuring the long-term components (which) could out-weigh the benefit of using a total compensation measure”. They also reason that “firm performance variables are all short-term measures”, therefore only short-term compensation measures should be considered. The study confirms that the results obtained, were not substantially different.
CEO and director compensation are positively correlated
A study shows that “CEO and director compensation are positively correlated even after correcting for many other factors”, (Brick, I.E., Palmon, O. & Wald, J.K., 2006), suggesting that a reason for this is the fact that these compensations are “positively related to firm complexity and the talent and effort needed to manage such companies”. On the other hand, they suggest that this correlation reflects “cronyism, whereby the board and CEO are more concerned with selfish objectives than with protecting shareholders’ interests”. This theory is in line with agency theory, a topic that shall be discussed in detail in the next section.
2.2. Agency Theory
Per (Zajac, E.J., 1990), “agency theory examines the problems – and partial solutions – that exist when a principal delegates decision-making responsibility to an agent who is paid a fee, but whose own objectives may conflict with those of the principal”. One study, (Tosi, H.L. et al., 2000) gives a description of the problems shareholders have, one of which is that “information asymmetries favour the CEO”, as well as “executives are able to use organizational resources to pursue objectives that may not be compatible with the best interests of the firm”, such as “large salaries and perks”.
Studies seem to agree that this is a common issue amongst larger firms because shareholders “cannot easily structure and closely supervise the activities of top executives” (Tosi, H.L. et al., 2000). In this same study, it was found that in firms with less amount of external control, it is easier for “managers to entrench themselves and behave opportunistically, and as a result, extract excessive compensation”. A study conducted in 2004, (Ryan, H.E. & Wiggins, R.A., 2004), explains that “as a CEO’s tenure increases, he becomes entrenched, influences the selection of new directors and gains greater managerial power over the board of directors”, which aids him/her in influencing their own compensation package to benefit their purposes. They go on to say that “director compensation in firms with entrenched managers provide weaker incentives to monitor management”. This agrees with
various other studies that claim that being entrenched gives executives an incentive to change their own compensation package as they wish and possibly increase their pay with no concern for the firm performance. The same study finds that “independent boards are more willing to monitor the CEO, whose ability to impose costs on them declines with their independence”.
Another point of agreement is that excess pay is either an incentive for agency problems or a result of them. For instance, (Brick, I.E., Palmon, O. & Wald, J.K., 2006) suggest that “well-compensated directors may be less likely to rock the boat”, and that “excess compensation is associated with firm underperformance”. (Basu, S. et al., 2007) further adds that “excess pay related to ownership and monitoring variables is negatively associated with subsequent accounting performance, consistent with the presence of an agency problem”. This study has also found that “top executive compensation decreases as the corporate governance structures become stronger”, emphasizing the point that excess compensation is a contributor to weak corporate governance and therefore firm performance. (Sun, J., Cahan, S.F. & Emanuel, D., 2009) advocate that “better corporate governance is reflected in higher quality compensation committees which are capable of designing and implementing remuneration arrangements that will lead to stronger incentives”, which is in line with what other studies claim. 2.3. ROA and Returns
There are differing opinions across the literature on whether to use accounting performance using the ROA (Return-On-Assets) as a proxy or the stock returns. (Ely, K.M., 1991) postulates that “the return on assets is considered because it is a traditional financial accounting measure of performance”, but that the returns are also important to consider since they “reflect all public information relevant to share values” due to market efficiency. The authors conclude that “the stock return and the accounting variables are not substitutes and that accounting variables are useful in explaining variation in changes in compensation”. However, not all studies agree with these results, (Basu, S. et al., 2007) finds that in their sample of Japanese firms, the lagged ROA coefficient was significant at the 1% level, whereas “coefficient estimates for return and lagged return are not statistically significant”, but explains that
this “likely reflects the general decline in the Japanese stock market during the period studied” and that “Japanese top executive pay is primarily based on accounting profitability rather than sales or stock returns”. Another study (Boyle, G. & Roberts, H., 2012) agrees with this for companies based in New Zealand, stating that “very little of the variation in pay growth of New Zealand CEOs is attributable to variation in firm performance measured by stock returns”; however, we can only conclude that countries have different compensation practices and that these must be studied before deciding the relevant indicators.
2.4. Market Trends
According to a study published by Mercer in 2015, the most relevant factor in determining the base salary of an executive is the individual performance, followed by the market benchmark and then the organization performance. This study has also shown that from 2014 to 2015 there has been a decrease in full cash pay-outs from short term incentive programs, increasing the use of clawback conditions and mandatory deferral in which the award will be subject to the achievement of future performance goals. In terms of long-term programs, the most notable change from 2014 to 2015 was the increase in multi-year performance goals fixed for the duration of the performance cycle instead of using one or two-year performance goals. These measures show that the trend currently is to increase the focus on long-term performance and try to make sure executives have the right incentives for this.
Research results from Towers Watson emphasize that across Europe the regulatory framework has been changing constantly, placing caps on executive compensation, such as the requirement that at least 40% of the variable remuneration should be deferred, among other measures. The study also states that the highest pay levels are found in Switzerland, the UK and Spain, with the Nordic countries in 8th place and Portugal not even in the ranking. A BCG study criticizes most annual bonus plans for their narrow focus on single-year performance, sacrificing long-term performance for short-term results. The study emphasizes that “[CEO] are rewarded handsomely for the up years but are not punished equivalently for the down years”, further stating that even if executives don’t receive their
bonus/options are worthless, “in neither case is their own wealth genuinely at risk as it is for the typical investor”. This asymmetry leads to risk-taking to obtain short-term benefits for the executives.
Taking these considerations into account, the next section will explain the methodology employed in this dissertation.
3. Methodology
3.1. Data
In this dissertation, the analysis conducted will be focused the comparison of companies in three distinct geographical locations to assess if there are differences in executive compensations’ relation to firm performance. The regions analysed are Portugal and Spain, two Nordic countries, namely Sweden and Denmark, and the UK. All the countries analysed are capitalist countries, however, the Nordic countries chosen have a very comprehensive welfare state, differentiating them from the other three. Portugal and Spain were chosen and will be analysed as a whole due to recent economic troubles that were experienced by both countries, which made them interesting targets for this analysis. The other three countries were chosen due to the difference between their law systems. Both Nordic countries follow the Civil Law, whereas the UK abides by the principles of Common Law. These characteristics may contribute to the level and alignment of executive compensation, therefore the samples chosen for this investigation.
The datasets were extracted from Bloomberg, for the years 2013 to 2015, to assemble a suitable panel. For the sample representing the UK, companies from the FTSE100 were chosen. From a sample of 100, a sample of 98 was viable to use, and some reductions had to be made in further regressions due to the unavailability of the data for some companies. For the Nordic countries, the OMX Stockholm and OMX Copenhagen were used, a total of 62 companies selected due to data availability. Finally, for the Iberian Peninsula sample, companies from the PSI20 and IBEX35 were selected, and after
removing the companies that did not have compensation data, a sample of 40 companies was left, the smallest of the group.
3.2. Method
A simple OLS regression method for panel data in Eviews was used; the results required to test for heteroscedasticity and normality of the errors to validate these results. The test for heteroscedasticity used was White’s test, and the normality test was Jarque-Bera. As expected, there was a lot of heteroscedasticity present, and to correct for this, a Robust Least Squares regression was used, to make the regression less sensitive to this matter. There was also non-normality present in some of the regressions, however, the number of points in each regression is large enough that according to the Central Limit Theorem we can say that the distribution is approximately normal and therefore consider the p-values calculated as correct. Furthermore, the test conducted to test for normality was the Jarque-Bera, which is a test for the skewness/kurtosis of the error distribution, therefore it can have a significant error when determining whether an error distribution is normal or not. In the case of this dissertation, all regressions that exhibited non-normal errors per the Jarque-Bera test had more than 75 observations, which is considered large enough to dismiss the non-normality issue.
3.3. Dependent variables
In this dissertation, various dependent variables were chosen to analyse the difference between executive positions in the companies, as well as different components of compensation. The focus of the analysis was the CEO, given that the total compensation as well as bonuses were considered. The total compensation of executives as a whole and of the Board of Directors was also explored. The log of the dependent variable was used instead of the linear value because of its monetary nature, therefore the results can be easier to interpret.
3.4. Independent variables
The independent variables considered were the accounting performance ratios, Return-on-Assets (ROA) and Return-on-Equity (ROE), leverage (LEV), the proxy for company size Turnover (Turn), the company annual volatility (𝜎𝑎) and the net dividend yield (DivYield).
3.5. Regressions
Eight regressions were run, two for each dependent variable, one with contemporary independent variables and the other with lagged variables, because per the literature it is possible that performance from the year before may have influence in the executive compensation of the present year. The equations representing the regressions were the following:
𝐿𝑜𝑔(𝑋𝑖) = 𝐶 + 𝛽1𝑅𝑂𝐴 + 𝛽2𝑅𝑂𝐸 + 𝛽3𝐿𝐸𝑉 + 𝛽4𝑇𝑢𝑟𝑛 + 𝛽5𝜎𝑎+ 𝛽6𝐷𝑖𝑣𝑌𝑖𝑒𝑙𝑑 and
𝐿𝑜𝑔(𝑋𝑖) = 𝐶 + 𝛽1𝑅𝑂𝐴𝑡−1+ 𝛽2𝑅𝑂𝐸𝑡−1+ 𝛽3𝐿𝐸𝑉𝑡−1+ 𝛽4𝑇𝑢𝑟𝑛𝑡−1+ 𝛽5𝜎𝑎(𝑡−1) + 𝛽6𝐷𝑖𝑣𝑌𝑖𝑒𝑙𝑑𝑡−1
Where 𝑋𝑖 is the dependent variable.
In the next section, the results of these regressions will be discussed, as well as possible reasons for the results obtained.
4. Results
4.1. UK
4.1.1 Executive Compensation
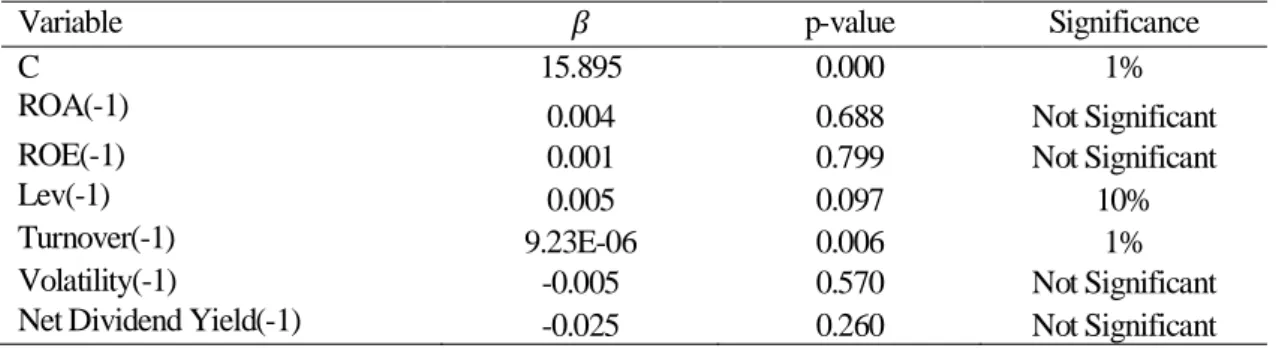
The first variable analysed was the Total Executive Compensation, both with and without lagged independent variables. In Tables 1.1 and 1.2 we can see that the contemporary and lagged values of the Turnover are significant at the 5% and 1% levels respectively. It is also possible to see that the lagged value of Leverage is significant at the 10% level, suggesting that this might also have an
influence in determining executive compensation, although it is a weak significance. These results suggest that only firm size is a real factor in determining the compensation of executives, and a large significance in unobserved variables is also relevant to notice.
Table 1.1 – Regression results of Executive Compensation with contemporary variables
Variable 𝛽 p-value Significance
C 15.758 0.000 1%
ROA 0.016 0.158 Not Significant
ROE -0.001 0.661 Not Significant
Lev 0.002 0.522 Not Significant
Turnover 8.48E-06 0.019 5%
Volatility 5.73E-03 0.517 Not Significant
Net Dividend Yield -0.020 0.328 Not Significant
Table 1.2 – Regression results of Executive Compensation with lagged variables
Variable 𝛽 p-value Significance
C 15.895 0.000 1%
ROA(-1) 0.004 0.688 Not Significant
ROE(-1) 0.001 0.799 Not Significant
Lev(-1) 0.005 0.097 10%
Turnover(-1) 9.23E-06 0.006 1%
Volatility(-1) -0.005 0.570 Not Significant
Net Dividend Yield(-1) -0.025 0.260 Not Significant
4.1.2. Total and Bonus CEO Compensation
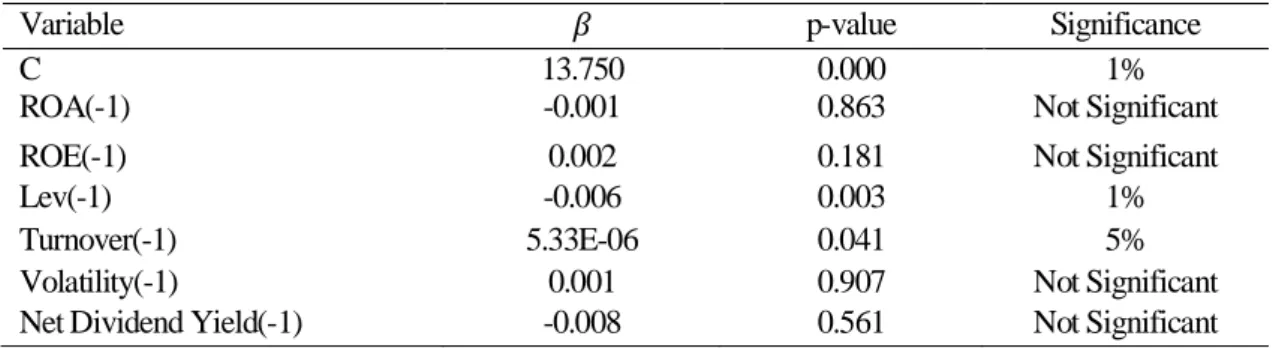
Analysing the Total and Bonus components of the CEO compensation in a similar fashion, it is possible to see in tables 1.3 to 1.6 that the Turnover tends to be a very significant explanatory variable, both its contemporary and lagged values. This suggests that the size of the company is a large determinant in CEO compensation, and that a classic performance indicators such as ROE has no statistical significance, which is an interesting result, and in line with some of the literature. Furthermore, the lagged value of Leverage has some significance in both the total compensation and the bonus component. This shows that if the company in the last year of business had large debt, CEO pay would be negatively affected, which is in line with what is expected from analysis of the literature.
Table 1.3 – Regression results of CEO Total Compensation with contemporary variables
Variable 𝛽 p-value Significance
C 14.685 0.000 1%
ROA 0.041 0.000 1%
ROE -0.002 0.263 Not Significant
Lev 0.003 0.203 Not Significant
Turnover 1.32E-05 0.000 1%
Volatility 0.014 0.126 Not Significant
Net Dividend Yield -0.008 0.700 Not Significant
Table 1.4 – Regression results of CEO Total Compensation with lagged variables
Variable 𝛽 p-value Significance
C 15.411 0.000 1%
ROA(-1) -0.007 0.498 Not Significant
ROE(-1) 0.001 0.455 Not Significant
Lev(-1) -0.006 0.052 10%
Turnover(-1) 7.57E-06 0.023 5%
Volatility(-1) -0.005 0.530 Not Significant
Net Dividend Yield(-1) -0.032 0.134 Not Significant
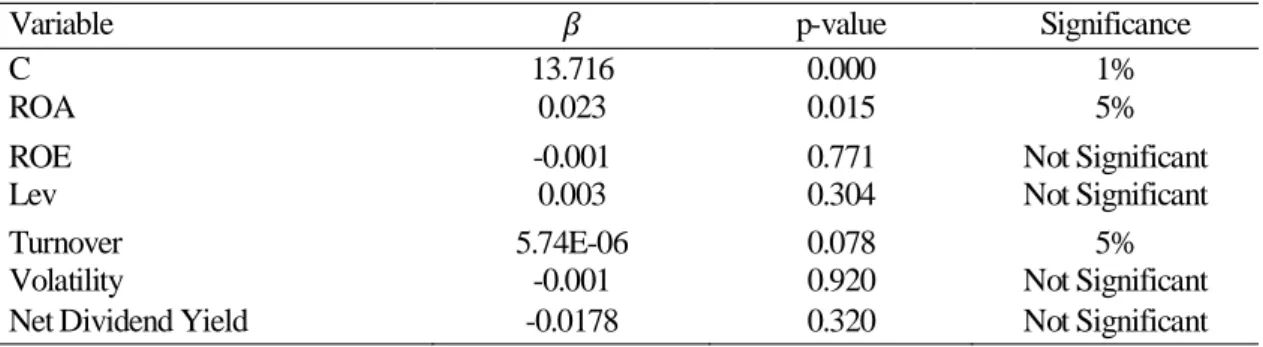
Interestingly, as it is possible to see in table 1.5, the ROA is significant at the 5% level in explaining the
CEO Bonus Compensation, as well as at the 1% level in Total Compensation as seen in table 1.3. This
suggests that CEOs’ salaries are much more reliant on the performance aspect than other executives, which is in line with what is expected since most CEOs are in responsible for the day-to-day running of the firm and therefore should be incentivized to maximize firm productivity.
Table 1.5– Regression results of CEO Bonus Compensation with contemporary variables
Variable 𝛽 p-value Significance
C 13.716 0.000 1%
ROA 0.023 0.015 5%
ROE -0.001 0.771 Not Significant
Lev 0.003 0.304 Not Significant
Turnover 5.74E-06 0.078 5%
Volatility -0.001 0.920 Not Significant
Table 1.6 - Regression results of CEO Bonus Compensation with lagged variables
Variable 𝛽 p-value Significance
C 13.750 0.000 1%
ROA(-1) -0.001 0.863 Not Significant
ROE(-1) 0.002 0.181 Not Significant
Lev(-1) -0.006 0.003 1%
Turnover(-1) 5.33E-06 0.041 5%
Volatility(-1) 0.001 0.907 Not Significant
Net Dividend Yield(-1) -0.008 0.561 Not Significant
4.1.3. Total Board of Directors Compensation
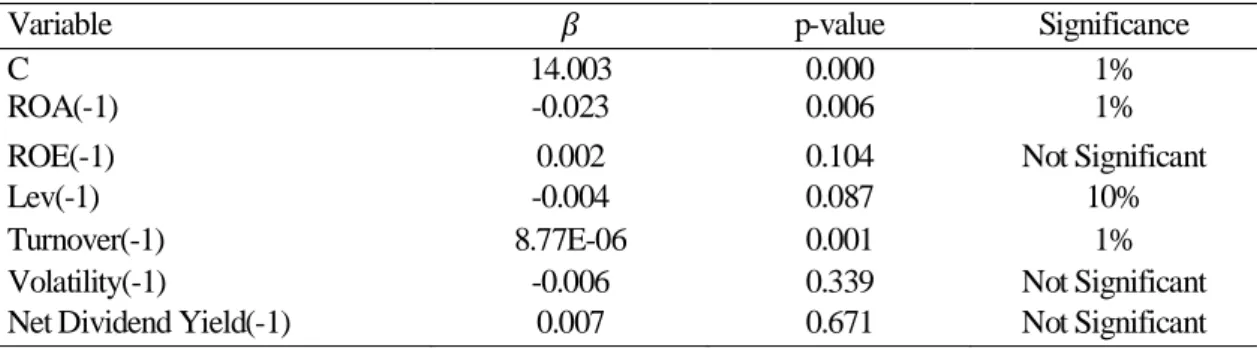
Next, the total BoD compensation is regressed, and the results are similar, however, now the lagged values of ROA are significant at the 1% level, suggesting that like CEOs, the members of the board have their compensation rely on this accounting measure, however, only the lagged value, whereas the CEOs’ salaries are based on the contemporary value. Furthermore, the company’s annualized
Volatility is significant also at the 1% level, with a negative coefficient, meaning that the board’s
compensation also relies on whether the company is perceived as risky or not by the market, by having higher price fluctuations. The more volatile the prices of a company’s stock are, the lower the compensation of its board.
Table 1.7 – Regression results of Board of Directors Compensation with contemporary variables
Variable 𝛽 p-value Significance
C 14.013 0.000 1%
ROA -0.007 0.392 Not Significant
ROE 0.002 0.236 Not Significant
Lev -0.004 0.054 10%
Turnover 2.72E-05 0.000 1%
Volatility -0.020 0.001 1%
Table 1.8 - Regression results of Board of Directors Total Compensation with lagged variables
Variable 𝛽 p-value Significance
C 14.003 0.000 1%
ROA(-1) -0.023 0.006 1%
ROE(-1) 0.002 0.104 Not Significant
Lev(-1) -0.004 0.087 10%
Turnover(-1) 8.77E-06 0.001 1%
Volatility(-1) -0.006 0.339 Not Significant
Net Dividend Yield(-1) 0.007 0.671 Not Significant
4.2. Sweden and Denmark 4.2.1 Executive Compensation
Similar to what was done with the UK region, the Nordic countries were analysed, following the same pattern and with the same dependent variables. However, the results were different when it concerned the Total Executive Compensation, in the sense that the only explanatory variable to have any significance was the lagged value of the Leverage. This can be seen in table 2.2. Again, the coefficient is negative, and therefore has the same interpretation as before, that the higher the leverage of a Nordic company, the lower its’ executives’ total compensation. This might because interest payments for highly leveraged companies are too high for the company to be comfortable paying its executives higher salaries. Nordic countries might be more sensitive to risk due to high leverage and may possible penalize CEOs that lead companies with high debt.
Table 2.1 – Regression results of Executive Compensation with contemporary variables
Variable 𝛽 p-value Significance
C 17.402 0.000 1%
ROA 0.002 0.799 Not Significant
ROE -8.78E-05 0.928 Not Significant
Lev -0.009 0.153 Not Significant
Turnover -2.92E-06 0.623 Not Significant
Volatility -0.011 0.166 Not Significant
Table 2.2 – Regression results of Executive Compensation with lagged variables
Variable 𝛽 p-value Significance
C 17.147 0.000 1%
ROA(-1) -0.002 0.936 Not Significant
ROE(-1) -0.006 0.593 Not Significant
Lev(-1) -0.028 0.0002 1%
Turnover(-1) 9.97E-06 0.233 Not Significant
Volatility(-1) -0.004 0.701 Not Significant
Net Dividend Yield(-1) 0.005 0.786 Not Significant
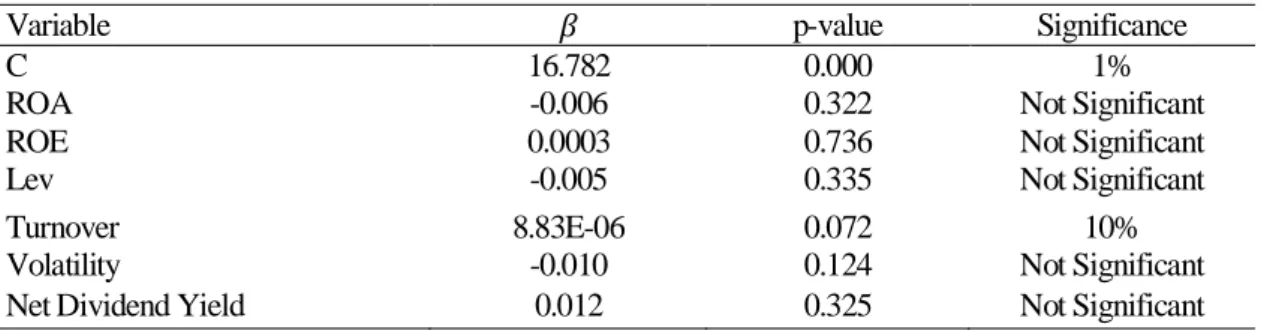
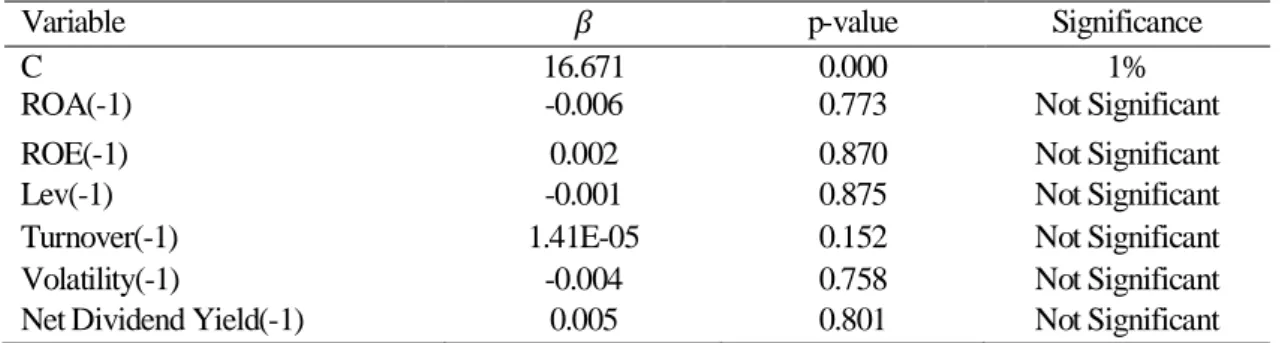
4.2.2. Total and Bonus CEO Compensation
The Total and Bonus CEO compensation is also highly unaffected by the explanatory variables. The
Total CEO Compensation is only explained by the Turnover, at the 10% level, as can be seen in Table
2.3. The Bonus compensation is only explained by the lagged values of Volatility and Leverage, at the 10% and 1% levels, respectively. Unlike the results for the UK companies, the relationships between CEO compensation variables and the independent variables chosen are quite weak, which together with the permanent significance of the regression constant C, can signify that there are other unknown variables that are considered when the CEO compensation is attributed. The Bonus Compensation is mostly affected by the lagged values of the variables, whereas the Total Compensation is explained by the contemporary. This suggests that the bonuses are attributed per information from the previous year, and the salary is based on contemporary variables, or the performance of the company in the present year.
Table 2.3 – Regression results of CEO Total Compensation with contemporary variables
Variable 𝛽 p-value Significance
C 16.782 0.000 1%
ROA -0.006 0.322 Not Significant
ROE 0.0003 0.736 Not Significant
Lev -0.005 0.335 Not Significant
Turnover 8.83E-06 0.072 10%
Volatility -0.010 0.124 Not Significant
Table 2.4 – Regression results of CEO Total Compensation with lagged variables
Variable 𝛽 p-value Significance
C 16.671 0.000 1%
ROA(-1) -0.006 0.773 Not Significant
ROE(-1) 0.002 0.870 Not Significant
Lev(-1) -0.001 0.875 Not Significant
Turnover(-1) 1.41E-05 0.152 Not Significant
Volatility(-1) -0.004 0.758 Not Significant
Net Dividend Yield(-1) 0.005 0.801 Not Significant
Table 2.5– Regression results of CEO Bonus Compensation with contemporary variables
Variable 𝛽 p-value Significance
C 15.293 0.000 1%
ROA -0.022 0.362 Not Significant
ROE 0.004 0.762 Not Significant
Lev -0.033 0.198 Not Significant
Turnover 0.0000096 0.368 Not Significant
Volatility -0.003 0.821 Not Significant
Net Dividend Yield 0.022 0.240 Not Significant
Table 2.6 - Regression results of CEO Bonus Compensation with lagged variables
Variable 𝛽 p-value Significance
C 16.492 0.000 1%
ROA(-1) -0.006 0.812 Not Significant
ROE(-1) -0.009 0.492 Not Significant
Lev(-1) -0.083 0.006 1%
Turnover(-1) -5.61E-07 0.967 Not Significant
Volatility(-1) -0.026 0.080 10%
Net Dividend Yield(-1) 0.007 0.712 Not Significant
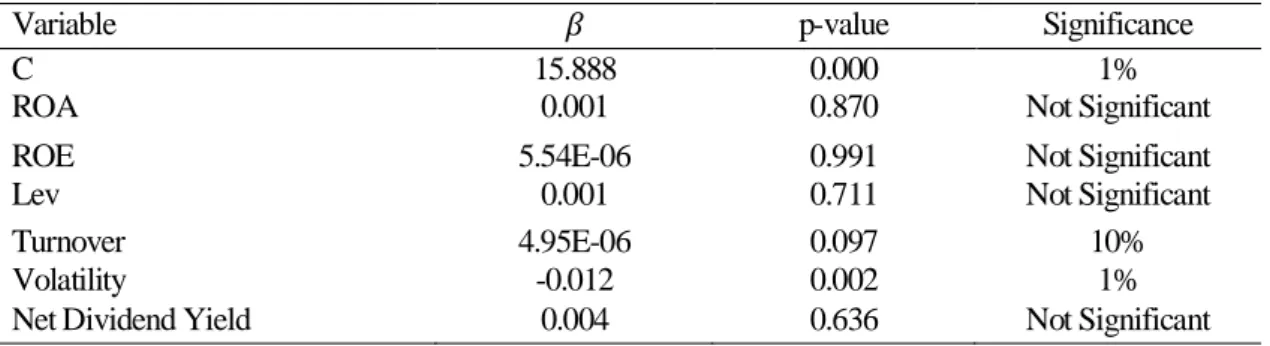
4.2.3. Total Board of Directors Compensation
In the case of the Total BoD Compensation for Nordic countries, the most significant explanatory variable is, like the UK, the contemporary value of the Volatility, followed by both the Turnover and its lagged value, as can be seen in tables 2.7 and 2.8. Like before, this shows that the Board of Directors compensation is quite reliant on the company’s perceived risk, as well as its size in terms of sales. Unlike the UK, the Nordic companies’ Board of Directors’ compensation does not seem to depend on its Leverage directly, therefore there are no penalties for the high usage of leverage.
Table 2.7 – Regression results of Board of Directors Compensation with contemporary variables
Variable 𝛽 p-value Significance
C 15.888 0.000 1%
ROA 0.001 0.870 Not Significant
ROE 5.54E-06 0.991 Not Significant
Lev 0.001 0.711 Not Significant
Turnover 4.95E-06 0.097 10%
Volatility -0.012 0.002 1%
Net Dividend Yield 0.004 0.636 Not Significant
Table 2.8 - Regression results of Board of Directors Total Compensation with lagged variables
Variable 𝛽 p-value Significance
C 15.344 0.000 1%
ROA(-1) 0.006 0.604 Not Significant
ROE(-1) -0.001 0.890 Not Significant
Lev(-1) 0.001 0.762 Not Significant
Turnover(-1) 1.04E-05 0.027 5%
Volatility(-1) 0.009 0.141 Not Significant
Net Dividend Yield(-1) -0.004 0.658 Not Significant
4.3. Portugal and Spain
Finally, Portugal and Spain were studied. The results were expected to be interesting due to this region being perceived as the most corrupt of the three, with the Nordic countries ranked first as the World’s least corrupt, followed by the UK and then Portugal with Spain as last of the studied countries in this dissertation.
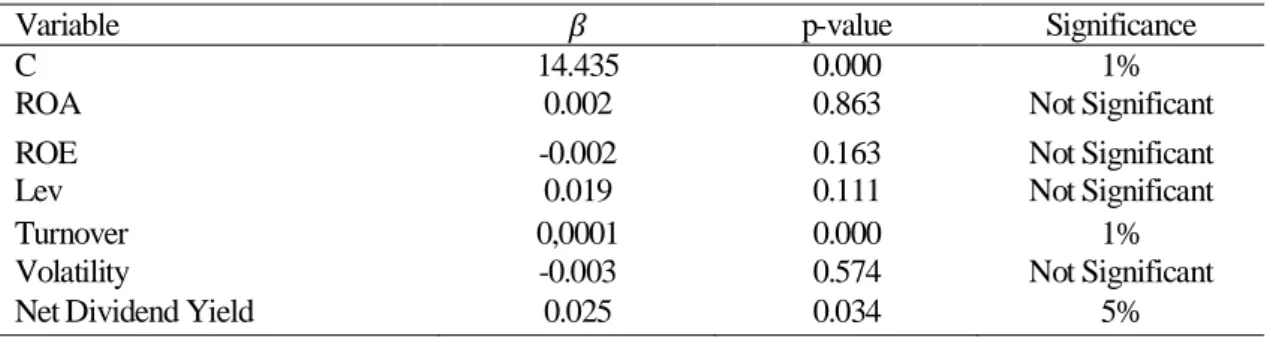
4.3.1 Executive Compensation
Like before, the Total Executive Compensation was tested first. The regression showed that the compensation had a very strong relationship with the company Turnover, meaning that size was a large factor in executive compensation. Furthermore, as can be seen in table 3.1, the Net Dividend
Yield has significance at the 5% level. This shows that companies that distribute dividends have higher
executive compensations according to the positive coefficient, meaning that this factor may be an indicator of company health in this region. Finally, as can be seen in table 3.2, the ROE’s lagged value is significant at the 10% level, signifying that this measure of compensation is also somewhat
contingent on this accounting measure of performance. However, the coefficient is negative, indicating that companies that have the most Return-on-Equity may have slightly lower executive compensations. This may indicate a slightly better alignment of interests when executives aren’t paid excessively.
Table 3.1 – Regression results of Executive Compensation with contemporary variables
Variable 𝛽 p-value Significance
C 14.435 0.000 1%
ROA 0.002 0.863 Not Significant
ROE -0.002 0.163 Not Significant
Lev 0.019 0.111 Not Significant
Turnover 0,0001 0.000 1%
Volatility -0.003 0.574 Not Significant
Net Dividend Yield 0.025 0.034 5%
Table 3.2 – Regression results of Executive Compensation with lagged variables
Variable 𝛽 p-value Significance
C 14.850 0.000 1%
ROA(-1) -0.028 0.546 Not Significant
ROE(-1) -0.003 0.091 10%
Lev(-1) 0.004 0.777 Not Significant
Turnover(-1) 0.0001 0.000 1%
Volatility(-1) -0.006 0.250 Not Significant
Net Dividend Yield(-1) 0.005 0.627 Not Significant
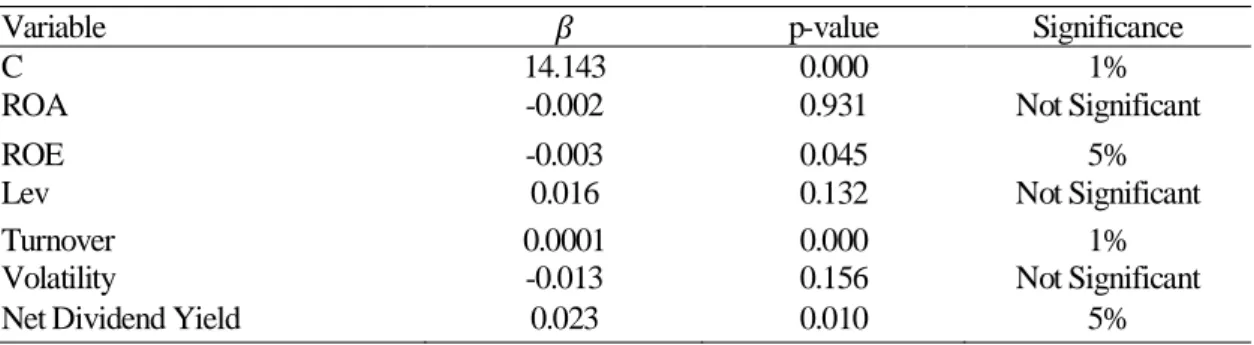
4.3.2. Total and Bonus CEO Compensation
The CEO Total Compensation follows the same course as the total executive compensation, as can be seen in tables 3.3 and 3.4, with significances in the contemporary ROE, the Net Dividend Yield and both values of Turnover. The Bonus CEO Compensation has similar results as for the other regions, with the Turnover and the Volatility being significant at the 1% level. However, the lagged values of the ROE, Leverage, Turnover and Net Dividend Yield prove to be significant (at the 10%,10%, 1% and 1% levels, respectively) in this case. The high significance of the Net Dividend Yield may again suggest this is a large indicator for company profitability and therefore a higher ability to pay executives for their work.
Table 3.3 – Regression results of CEO Total Compensation with contemporary variables
Variable 𝛽 p-value Significance
C 14.143 0.000 1%
ROA -0.002 0.931 Not Significant
ROE -0.003 0.045 5%
Lev 0.016 0.132 Not Significant
Turnover 0.0001 0.000 1%
Volatility -0.013 0.156 Not Significant
Net Dividend Yield 0.023 0.010 5%
Table 3.4 – Regression results of CEO Total Compensation with lagged variables
Variable 𝛽 p-value Significance
C 14.357 0.000 1%
ROA(-1) -0.036 0.643 Not Significant
ROE(-1) -0.004 0.121 Not Significant
Lev(-1) -0.005 0.809 Not Significant
Turnover(-1) 0.0002 0.000 1%
Volatility(-1) -0.011 0.196 Not Significant
Net Dividend Yield(-1) -0.009 0.579 Not Significant
Table 3.5– Regression results of CEO Bonus Compensation with contemporary variables
Variable 𝛽 p-value Significance
C 11.551 0.000 1%
ROA 0.013 0.722 Not Significant
ROE 0.001 0.644 Not Significant
Lev -0.022 0.215 Not Significant
Turnover 0.0001 0.000 1%
Volatility 0.042 0.007 1%
Net Dividend Yield -0.018 0.154 Not Significant
Table 3.6 -Regression results of CEO Bonus Compensation with lagged variables
Variable 𝛽 p-value Significance
C 13.276 0.000 1%
ROA(-1) -0.010 0.852 Not Significant
ROE(-1) -0.003 0.079 10%
Lev(-1) -0.027 0.069 10%
Turnover(-1) 0.0001 0.000 1%
Volatility(-1) 0.001 0.937 Not Significant
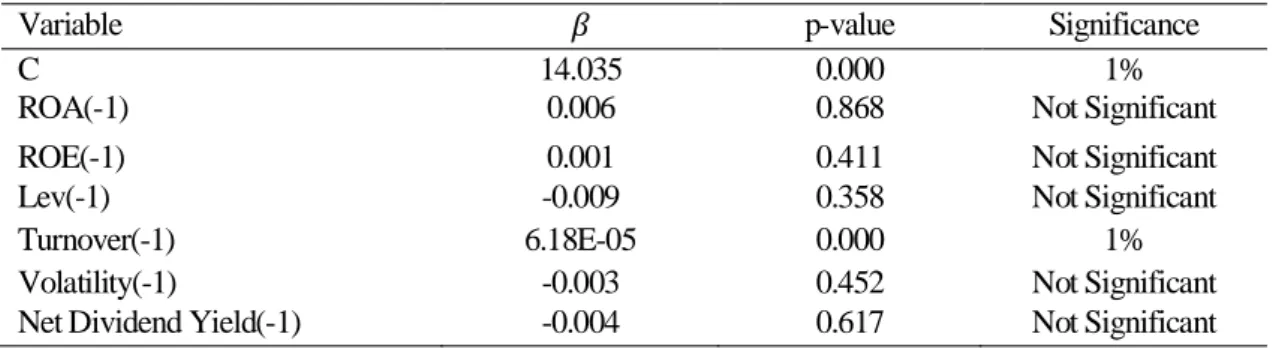
4.3.3. Total Board of Directors Compensation
The Total BoD compensation variable for Portugal and Spain behaves slightly differently from the other regions, with only the Net Dividend Yield proving to be significant at the 1% level and the lagged value of Turnover as well, as can be seen in tables 3.7 and 3.8. This may reinforce the proposition that was made before, insomuch as that in these countries, the Net Dividend Yield is a signifier of company health, therefore signals the possibility that the company can afford higher salaries. As in the other regions, the lagged value of the Turnover is also very significant in explaining the Total BoD
Compensation, however, the contemporary value seems not to have any impact in this region, unlike
in the other regions.
Table 3.7 – Regression results of Board of Directors Compensation with contemporary variables
Variable 𝛽 p-value Significance
C 14.167 0.000 1%
ROA -0.020 0.702 Not Significant
ROE 0.002 0.413 Not Significant
Lev -0.013 0.537 Not Significant
Turnover 4.09E-05 0.195 Not Significant
Volatility -0.003 0.770 Not Significant
Net Dividend Yield 0.041 0.028 1%
Table 3.8 - Regression results of Board of Directors Total Compensation with lagged variables
Variable 𝛽 p-value Significance
C 14.035 0.000 1%
ROA(-1) 0.006 0.868 Not Significant
ROE(-1) 0.001 0.411 Not Significant
Lev(-1) -0.009 0.358 Not Significant
Turnover(-1) 6.18E-05 0.000 1%
Volatility(-1) -0.003 0.452 Not Significant
Net Dividend Yield(-1) -0.004 0.617 Not Significant
In this region, we can see a strong emphasis on the Net Dividend Yield, unlike the other regions studied. This shows there is a significant difference between regions and their compensation schemes, as was somewhat expected due to different country regulations and law schemes. Unlike the Nordic countries studied and the UK, Leverage is not very significant, suggesting that these two countries’
compensation schemes do not have such a high sensitivity to indebtedness. The conclusions of this study will be analysed in the next section.
5. Conclusion
Emerged from the research that there are several similarities in the regions researched, namely the importance of Turnover and company size, in explaining most of the compensation components analysed. The results show that executive compensation is sensitive to the company size, i.e., larger the company, higher the executives’ compensation. This result is in line with the content of the literature review. Also, all the regressions that were run had a very significant constant C, always significant at the 1% level. This suggests that there are various unobserved variables that can explain the compensation of executives that are not being analysed by this model.
The UK was the region whose compensation most depends on Turnover, being this and leverage the most relevant variables. Compensation’s relationship with leverage emerged as negative, which shows that the higher the company’s leverage, the lower the compensation; this might suggest that the high interest payments lead towards lower profits, and therefore, lower compensation packages.
In Portugal and Spain region, the Net Dividend Yield turned out to be significant, unlike in the other regions. This shows that in Iberia, the dividend yield signifies company health and therefore, raises the ability to pay higher salaries to executives. However, this variable is only significant in Iberia possibly suggesting that, either healthy companies are not distributing the same proportion of dividends as they should, or alternatively, management is somehow preventing dividends from being distributed to maximise their own compensation. In Iberia, emerged more diversity in terms of significant explanatory variables when compared to the other regions, namely a higher importance of ROE, albeit having a negative impact on compensation. This higher performance may indicate, as suggested beforehand, that some companies might overpay executives and therefore, have lower performance, emphasizing the agency theory in favour of executives.
The Nordic countries (Norway and Denmark) analysed are those where compensation is the least affected by the explanatory variables chosen; this may possibly due to specific country regulations or even to the political system or cultural background. Unlike the UK and Iberia, Turnover does not seem to be the most significant explanatory variable, as several regressions where there are no significant variables.
This dissertation contributed to the body of knowledge by providing a relevant comparison between three distinct regions including five countries and their compensation schemes, as well as providing an insight into the corporate culture of these countries, by defining which parameters impact or not the compensation of executives.
References
Anderson, R.C. & Bizjak, J.M., 2003. An empirical examination of the role of the CEO and the compensation committee in structuring executive pay. Journal of Banking and Finance, 27(7), pp.1323–1348.
Anderson, S. et al., 2010. CEO Pay and the Great Recession. Institute for Policy Studies, p.7.
Basu, S. et al., 2007. Corporate governance, top executive compensation and firm performance in Japan. Pacific Basin Finance Journal, 15(1), pp.56–79.
Boachie-Mensah, F. & Delali Dogbe, O., 2011. Performance-Based Pay as a Motivational Tool for Achieving Organisational Performance: An Exploratory Case Study. International Journal of
Business and Management, 6(12), pp.270–285
Bolton, P., Scheinkman, J. & Xiong, W., 2005. Pay for Short-Term Performance: Executive Compensation in Speculative Markets. Journal of Corporation Law, 30(4), pp.721–747.
Boyle, G. & Roberts, H., 2012. CEO presence on the compensation committee: a puzzle. Journal of
Economics and Business, 70, pp.16–26.
Brick, I.E., Palmon, O. & Wald, J.K., 2006. CEO compensation, director compensation, and firm performance: Evidence of cronyism? Journal of Corporate Finance, 12(3), pp.403–423.
Buigut, K.K., Soi, N.C. & Koskei, I.J., 2014. Determinants of CEO Compensation Evidence from UK Public Limited Companies. International Journal of Business and Management, 10(1), pp.223–231. Collett Miles, P. & Miles, G., 2013. Corporate social responsibility and executive compensation: exploring the link. Social Responsibility Journal, 9(1), pp.76–90.
Core, J.E., Holthausen, R.W. & Larcker, D.F., 1999. Corporate governance, chief executive officer compensation, and firm performance. Journal of Financial Economics, 51(3), pp.371–406.
Ely, K.M., 1991. Interindustry Differences in the Relation between Compensation and Firm Performance. Journal of Accounting Research, 29(1), pp.37–58.
Gélinas, P. & Baillargeon, L., 2013. CEO Compensation in Canada, 1971-2008. International Journal
of Business & Management, 8(12), pp.1–7.
Kato, T. & Kubo, K., 2006. CEO compensation and firm performance in Japan: Evidence from new panel data on individual CEO pay. Journal of the Japanese and International Economies, 20(1), pp.1– 19.
Kato, T., Lee, J.-H. & Kim, W., 2004. Executive Compensation and firm performance in Korea. KDI
Kato, T. & Long, C., 2006. Executive Compensation, Firm Performance, and Corporate Governance in China: Evidence from Firms Listed in the Shanghai and Shenzhen Stock Exchanges. Economic
Development and Cultural Change, 54(4), pp.945–983.
Lopes, I. T. (2010). Towards a complementary intangibles reporting approach, Measuring Business
Excellence, 14(4), 24-34.
Lopes, I.T. and Pitta Ferraz, D. (2016) The value of intangibles and diversity on boards looking towards economic future returns: evidence from non-financial Iberian business organisations, Int. J. Business Excellence. 392 Int. J. Business Excellence, Vol. 10, No. 3, 2016
Lopes, I.T., Pitta Ferraz, D., and M. M. Martins (2016a). The Influence of Boards’ Diversity on Profitability: an overview across Iberian Non-financial listed companies, Corporate Ownership & Control, Vol. 13, Issue 2-C2, pp.455-461.
Maztoul, S.B.M., 2014. Does Corporate Governance Matter in Meeting and Beating Analysts’ Forecasts. International Journal of Business and Management, 9(2), pp.276–290.
Murphy, K.J., 1999. Chapter 38 Executive compensation. Handbook of Labor Economics, 3 PART(2), pp.2485–2563.
Puni, A., Addiyiah Osei, B. & Bachison Ofei, S., 2014. The Effect of Board Composition on Corporate Financial Performance: Evidence from Listed Firms in Ghana. International Journal of
Business and Management, 9(8), pp.170–179.
Ryan, H.E. & Wiggins, R.A., 2004. Who is in whose pocket? Director compensation, board independence, and barriers to effective monitoring. Journal of Financial Economics, 73(3), pp.497– 524.
Stiffler, M. a, 2006. Incentive compensation management: Making pay-for-performance a reality.
Performance Improvement, 45(1), pp.25–30.
Summers, L., 2005. Integrated Pay for Performance: The High-Tech Marriage of Compensation Management and Performance Management. Compensation & Benefits Review, 37(1), pp.18–25. Sun, J., Cahan, S.F. & Emanuel, D., 2009. Compensation committee governance quality, chief executive officer stock option grants, and future firm performance. Journal of Banking and Finance, 33(8), pp.1507–1519.
Tosi, H.L. et al., 2000. How Much Does Performance Matter? A Meta-Analysis of CEO Pay Studies.
Journal of Management, 26(2), pp.301–339.
Tosi, H.L. et al., 2004. CEO charisma, compensation, and firm performance. Leadership Quarterly, 15(3), pp.405–420.
Zajac, E.J., 1990. CEO selection succession, compensation and firm performance: A theoretical integration and empirical analysis. Strategic Management Journal, 11(August 1988), pp.217–230.
Mercer. (2016). European Executive Remuneration Trends. (online) Available at:
http://www.mercer.com/content/dam/mercer/attachments/global/webcasts/european-executive-remuneration-trends-2015.pdf (Accessed 1 Nov. 2016).
Willis Towers Watson. (2016). 2014 CEO pay in the Eurotop 100 - Insights similarities and
differences across Europe. (online) Available at:
https://www.towerswatson.com/en/Insights/IC- Types/Survey-Research-Results/2014/07/2014-CEO-pay-in-the-Eurotop-100-insights-similarities-and-differences-across-Europe (Accessed 1 Nov. 2016).
BCG. (2016). Fixing What’s Wrong with Executive Compensation. (online) Available at: https://www.bcgperspectives.com/content/articles/people_management_human_resources_corporate_ development_fixing_whats_wrong_executive_compensation/?chapter=2#chapter2 (Accessed 1 Nov. 2016).