1
Work autonomy, work pressure, and job satisfaction: An analysis of
European Union countries
Lopes, Helena; Lagoa, Sérgio; Calapez, Teresa (2014). Work autonomy, work pressure, and job satisfaction: An analysis of European Union countries. The Economic and Labour Relations Review June 2014 vol. 25 no. 2 306-326
Last version prior to publication:
Abstract
Based on European Working Conditions Survey (EWCS) micro-data, we show that, on average, work autonomy has declined and work pressure has increased in most
European Union countries since 1995. Since such evolution is substantially detrimental for workers, we examine whether workers of varied skill levels in different countries have been equally impacted. Descriptive analysis shows that low-skill clerical workers are the most affected and that Scandinavian countries fare better. Econometric results show that the decline in job satisfaction is due mainly to the increase in work
pressure—which might be reaching a limit for high-skill workers—and that job satisfaction is most affected by an increase in work pressure when this is not accompanied by greater work autonomy.
2
1. Introduction
Autonomy at work is shown to have a favorable impact on the workers’ well-being (Knudsen et al., 2011; Bauer, 2004; Ryan and Deci, 2000) as well as on their performance and creativity (Gagné and Deci, 2005). Raising work autonomy would hence provide a “win-win” situation with benefits for both employers and employees. In contrast, enhanced work intensity, which is also known to improve performance and productivity, is associated to negative health outcomes (Danna and Griffin, 1999; Dejours, 2009) and declining job satisfaction (Green, 2006).
However, the impact of work autonomy and work intensity on workers’ well-being can only be plainly assessed after taking into account the combined levels of both factors. Indeed, Karasek (1979) showed that specific combinations of work autonomy and work intensity may have effects on well-being that go beyond the isolated effect of each factor. His Demand-Control model, further developed in Karasek and Theorell (1990) and tested by hundreds of studies, is based on two hypotheses. The strain hypothesis posits that jobs defined by heavy demands – high work load and time constraints - and low control – low decision latitude on how to meet these demands – result in mental strain, stress and health problems. The activation hypothesis posits that jobs with high demands and high control provide workers with learning and development opportunities, which results in good health indicators and job satisfaction. This is explained by the fact that high decision latitude “buffers” the strain-inducing effect of high work demands (De Jonge and Kompier, 1997:239; Van der Doef and Maes, 2010:88-89; De Lange et al, 2003:284).
Empirical evidence reveals that while satisfaction with extrinsic aspects of jobs – pay, hours of work, health and safety – has improved or stabilized in recent decades (Clark, 2005; Eurofound, 2010b), satisfaction with job content and other intrinsic aspects of work, such as work autonomy and work intensity, seems to have decreased in several EU countries (Eurofound, 2007; Clark, 2005). In fact, the trends towards work intensification and declining discretion at work are shown to be at the root of the
3
decline in job satisfaction in the UK (Green, 2004, 2006; Green and Tsitsianis, 2005), a result consistent with Karasek and Theorell’s model.
The present paper aims to test the strain hypothesis by assessing the extent to which the combined evolution of work intensity and work autonomy affects job satisfaction. The empirical study is based on the European Working Conditions Survey (EWCS) micro-data for fifteen EU countries since 1995. In a first step, we use several items of the questionnaire to construct reliable synthesis indicators of work autonomy and work intensity. We then assess how both constructs and job satisfaction have evolved in EU-15 countries. In a second step, we use econometric analysis to study how the joint evolution of work intensity and work autonomy affects and explains the evolution of job satisfaction.
Our analysis allows us to see whether the trends observed in the UK and their impact on job satisfaction hold in other countries and for workers of different skill levels. Countries pertaining to the Scandinavian welfare regime are known to benefit from higher job quality (Davoine et al., 2008; Gallie, 2007, 2003). It will be interesting to study how job satisfaction, work autonomy and work intensity have evolved in these countries when compared to the UK, the Continental and South European countries. Are we facing a deepening or a smoothing of the differences between the European welfare regimes in the intrinsic aspects of work? Are low-skill and high-skill workers equally affected by the decline in work autonomy and increase in work intensity?
Following Karasek and Theorell, our main hypothesis is that an increase in work intensity is less harmful to the worker’s satisfaction if he/she enjoys high autonomy. But there may well be an upper limit to work intensity, regardless of autonomy levels. We then also test whether growing levels of work intensity are increasingly detrimental for workers. The growth of the psychosocial work-related problems in Scandinavian countries (Knudsen et al., 2011), in which both work autonomy and work intensity are high, may well be a symptom of such a situation. Contrary to what is suggested by the Job Demand-Control model, the “buffer” effect seems to have limits.
4
The paper is structured as follows. We begin by questioning the use of job satisfaction as an indicator of well-being at work and explain the perspective in which it is used here. Section Three presents the data and empirical strategy, followed by a description of the trends in job satisfaction since 1995 in the fifteen countries studied. In section Four we build indicators of work autonomy and work pressure and analyze their evolution by skill level and country. Section Five conducts econometric analyses of the relation between job satisfaction, work autonomy and work pressure. Section Six discusses the results and concludes.
2. Job satisfaction as an indicator of well-being at work
Conventional economists take self-reported data on job satisfaction as a proxy variable for the workers’ utility without further questioning. However, the interpretation of self-reported job satisfaction is a particularly perilous endeavor: it is never possible to know exactly what the respondents are saying. Job satisfaction is often defined as the way people feel about their job and whether they like it; it would hence have a primarily affective character. But it is also recognized that job satisfaction has a cognitive dimension and is therefore also an evaluative judgment about one or several aspects of the job. This makes job satisfaction a multi-dimensional construct difficult to interpret. Moreover, job satisfaction is shown to depend on personality traits (Judge et al., 2001) and its perception is culturally biased (Sousa-Poza, 2000).
Empirically, this intricacy results in the existence of substantive divergences between objective working conditions and self-reported job satisfaction. Bustillo et al. (2011) clearly show that there is hardly any congruence between actual working conditions and job satisfaction across countries. The range of variation of the latter is extremely small even when comparing very different countries in terms of their economic development. In fact, the range of variation in job satisfaction is higher within than across countries, but it is still not clear whether it captures real differences in job quality.
5
Social scientists generally explain these discrepancies by the fact that workers adapt to their actual work experience. Job satisfaction is assessed by workers in part in relation to what they expect from the job. While some workers might be led to expect a lot, others might be resigned to expecting little. So everything depends on the norms against which preferences and judgments are formed. It is difficult for both the analyst and the respondent to distinguish between “true” satisfaction and resignation - adaptation of preferences and aspirations to the opportunities actually available. For instance, low-wage workers sometimes express higher satisfaction than high-wage workers: low earners may report being “satisfied” in their jobs simply because they have a low benchmark level of norms and aspirations (Brown et al., 2007).
Despite these important limitations, information on job satisfaction remains valuable. On one hand, it is robustly proven to relate to actual behaviors such as absenteeism and turnover (Spector, 1986; Utman, 1997). On another, job satisfaction transmits useful information about how workers perceive their work life, about how they feel about and evaluate their job, even though it is not an accurate indicator of the “value” of a job - the extent in which a job objectively provides the conditions for human flourishing. In this paper, like Green (2006) and Green and Tsitsianis (2005), we consider that even if the levels of job satisfaction do not convey adequate measures of workers’ “true” well-being, changes in job satisfaction over time constitute reliable indications of changes in well-being at work. The analysis below therefore focuses on trends in job satisfaction and on its relationship with other variables rather than on the comparison of job satisfaction between individuals and across countries. Also, the use of successive cross-sectional samples helps moderating the influence of individual traits and expectations and the period of time covered – 1995 to 2010 – has not witnessed societal changes able to provoke major shifts in collective expectations towards work.
In the UK (but not in Germany), the decline in job satisfaction is found to be associated with the decrease in work autonomy [1] and with the increase in work intensity (Green, 2004, 2006; Green and Tsitsianis, 2005). Indeed, job satisfaction is shown to increase in line with the degree of autonomy enjoyed in the job (Nguyen et al., 2003), a result which holds in different countries and for a wide array of job
6
autonomy indicators (Eurofound, 2007). Conversely, work pressure is found to be associated to negative health outcomes (Danna and Griffin, 1999; Dejours, 2009), which predicts a strong negative association with job satisfaction. Karasek and Theorell (1990) made a decisive contribution to the understanding of both phenomena by showing that the positive effect of work autonomy on job satisfaction may be partially or totally outweighed by the negative effect of work intensity.
3. Data, empirical strategy and the evolution of job satisfaction
The levels and trends in work autonomy, work intensity and job satisfaction are studied using the 1995, 2000, 2005 and 2010 waves of the European Working Conditions Survey – EWCS (Eurofound, 1995, 2000, 2005, 2010a), a cross-sectional dataset that provides unique and detailed information on work in Europe. The EWCS is questionnaire-based, administered using face to face interviews with approximately 1000 individuals in their homes in each EU country. Every wave sample is representative of those aged 15 years and over who are in employment. In 2010, a multi-stage, stratified random sampling design was used in each country [2]. Previous waves used a multi-stage, “random walk” procedure (see EWCS 1995 and 2000 Final Reports).
The data analysis follows various steps. We first analyze the evolution of job satisfaction from 1995 to 2010 in the 15 EU countries for which data is available for the four waves (see Table 1A in the Appendix for a description of the variables). In a second step, we build indicators of work autonomy and work intensity and examine their evolution by skill level and country (section Four). The association between work autonomy, work intensity and job satisfaction is studied in a third step by using regression models (section Five).
As the sole observation of the aggregate trends at the national level might conceal significant divergences between workers of different skill levels, we distinguish between groups of workers by using the Eurofound classification of the occupational
7
classes of the workers’ jobs in four categories [3]: High Skill Clerical – HSC; Low Skill Clerical – LSC; High Skill Manual – HSM; and Low Skill Manual – LSM (see Table 1A).
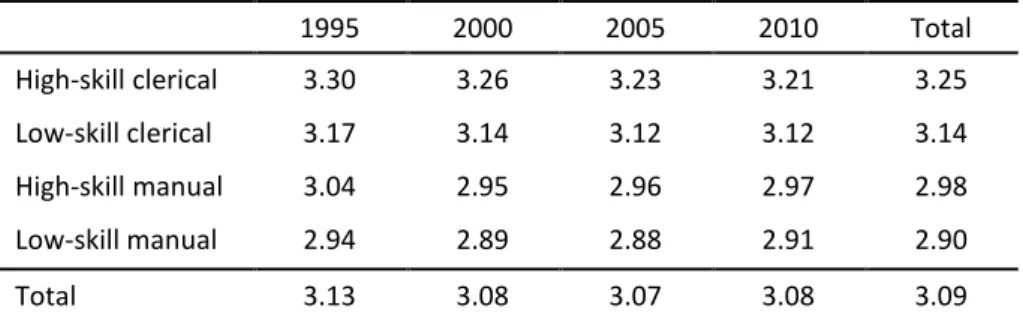
The analysis of average job satisfaction by skill level reveals that, in each wave and overall, high-skill workers display higher levels of satisfaction than low-skill workers, and clerical workers are on average more satisfied than manual workers (Table 1). As for trends, average satisfaction in 1995 was higher than in any other year for all skill levels. There is a marked decline in the satisfaction of clerical workers over the years whereas the satisfaction of manual workers seems to have stabilized in the 2000s.
Table 1. Average job satisfaction by year and skill level
1995 2000 2005 2010 Total High-skill clerical 3.30 3.26 3.23 3.21 3.25 Low-skill clerical 3.17 3.14 3.12 3.12 3.14 High-skill manual 3.04 2.95 2.96 2.97 2.98 Low-skill manual 2.94 2.89 2.88 2.91 2.90 Total 3.13 3.08 3.07 3.08 3.09
Note: job satisfaction goes from 1 – not at all satisfied to 4 – very satisfied.
Though declining, there is not a very pronounced trend in average job satisfaction. In contrast, the percentage of “very satisfied” workers decreased significantly. Differences between 1995 and 2010 are significant (p < 0.001) for all skill levels (Table 2). It appears that the steadiness of the average level of job satisfaction results from two phenomena: the decline in the number of “very satisfied” workers, which lowers the average satisfaction, and the decline in the “not at all satisfied” workers, which has the opposite effect.
8 Table 2. Proportion of “Very satisfied” workers by year and skill level
1995 2000 2005 2010 2010 – 1995 High-skill clerical 0.42 0.36 0.35 0.33 -0.09* n= 2313 3300 2585 3832 Low-skill clerical 0.33 0.31 0.29 0.27 -0.06* n= 5599 8097 5342 8708 High-skill manual 0.24 0.19 0.18 0.17 -0.07* n= 2135 2893 1659 2495 Low-skill manual 0.22 0.19 0.16 0.18 -0.04* n= 2415 3519 2611 3479 Total 0.31 0.28 0.26 0.25 -0.06* n= 12462 17809 12197 18514
* Significant difference at the 0.001 level
4. The evolution of work autonomy and work intensity in the EU
If the findings mentioned in the introduction hold, i.e., if work autonomy is actually related to job performance and job satisfaction, one would expect to see work autonomy steadily increasing for all workers over time and space. However, some studies show that there is no performance advantage to autonomous motivation for low-skill jobs (Gagné and Deci, 2005); while work autonomy is shown to promote performance in jobs requiring high levels of commitment, control devices have been found to yield superior short-term performance in unskilled tasks. Managers seeking efficiency would therefore discriminate between workers and a polarization process would be observed, marked by a long-term decline in job autonomy for the workers in less skilled jobs.
With regard work intensity, the competitive pressure due to the progressive catching-up of emerging economies might lead European firms to intensify work in an effort to maintain higher levels of competitiveness. However, work intensification is not an unlimited process and there is evidence that European workers are already subject to high work strain. As predicted by Karasek and Theorell (1990), evidence shows that the combination of high work intensity and low autonomy is associated to high risks of cardiovascular disease, depression, insomnia and musculoskeletal
9
disorders (Van der Doef and Maes, 2010; Siegrist, 2006; De Lange et al, 2003). An increase in work intensity is hence to be expected for all skill levels but it might be less pronounced for workers with already high work intensity and/or low work autonomy.
Although all countries face similar competitive demands and economic constraints, national institutional settings and cultural specificities may strongly impact the levels and trends of work-related variables. In effect, the different welfare regimes exhibit substantially different levels of job quality (Esser and Olsen, 2012; Davoine et al., 2008; Gallie, 2003). Because of their more egalitarian regimes, higher trade union membership and labor-oriented policies, we expect the Scandinavian countries to display better levels of intrinsic job quality and less difference among groups of workers. Conversely, South European countries are expected to fare worse in terms of both work autonomy levels and polarization trends, while Continental and Anglo-Saxon countries would display average positions.
As for the measurement of work autonomy, we rely on Lopes et al. (2013)’s indicators which are based on seven questions of the EWCS that reasonably cover what Karasek (1979) calls “job control”. We conducted the same Principal Components Analyses (PCA) and obtained the same (standardized) scores, which we use in the analysis below. Our PCA also systematically revealed that work autonomy is a bi-dimensional phenomenon [7]. We nonetheless prefer not to keep Lopes et al (2013)’s terms and label instead the first factor “procedural autonomy” (PA) and the second factor “content autonomy” (CA).
Despite some divergences, these two factors broadly correspond to the two distinct constructs that, for Karasek (1979), constituted “job control”, namely “decision authority” and “skill discretion”. In effect, PA refers to the degree of control that workers perceive to exert on when and how they carry out their work tasks and CA refers to the learning opportunities available in their job and to whether workers asses the quality of their work (see Table 1A). In other words, PA shows the control workers have over their methods and schedules while CA shows the control workers have over their work content and the use of their skills. In most studies, the two constructs are combined in a single index of work control in spite of evidence that the constructs are
10
empirically distinct (Mansell and Brough, 2005). Like Karasek and Theorell, we prefer not to subsume the two dimensions into a single additive scale. In fact, results show that the behavior of both measures differs across the four skill levels in a meaningful way.
Overall, work autonomy declined significantly over the period (see last rows of Table 3). Results confirm the “Scandinavian exception”: work autonomy levels in Denmark, Finland, the Netherlands and Sweden are above the EU average for all groups of workers and there is much less difference between clerical and manual workers and between low-skill and high-skill workers than in all other countries, where manual workers systematically suffer from below average work autonomy (Lopes et al.., 2013). In addition, whereas work autonomy decreased in all other countries from 1995 to 2010, it stabilized or increased in Denmark, Finland, the Netherlands and Sweden. As for polarization processes, the situation of manual workers in the 15 studied countries has not deteriorated when compared to clerical workers. By contrast, a clear polarization process is under way between high-skill and low-skill clerical workers. Hence, our expectations regarding polarization trends and welfare regimes are confirmed but, contrary to expectations, autonomy at work for high-skill workers slightly decreased rather than increased (for complete analysis, see Lopes et al., 2013).
We now concentrate on examining the levels and trends in work intensity and analyzing the combined evolution of work intensity and work autonomy by skill level and country.
Measuring work intensity - or job demands, in Karasek’s terms - requires information on work load or work effort. However, no such data is available in the four EWCS waves. To construct our indicator, we used the two questions traditionally examined in studies of work intensity based on EWCS (“job involving working at very high speed” and “working to tight deadlines”) to which we added questions related to potentially stressful patterns of work such as reliance on work done by colleagues, defined performance targets, and time constraint. The set of possible responses to the time constraint question differs across waves: the 1995 and 2000 waves required a yes/no answer while the 2005 and 2010 waves proposed an ordered set of categories
11
(see Table 2A in the Appendix). The ordinal nature of some variables and the dichotomous nature of others led us to use Categorical Principal Components Analysis. CatPCA also presents the advantage of incorporating a sophisticated option that only takes into account the non-missing data when the loss function is minimized (Meulman et al, 2004), and it allows the score computation for all objects with at least one valid response. Thus, the time constraint question could be included in the analysis. CatPCA reveals that the five items load on a single factor (eigenvalue 2.43). Cronbach’s alpha for the index is 0.71, indicating sufficient internal consistency.
The resulting indicator, named “work pressure” rather than work intensity for the sake of rigor, fully exploits the information available in the EWCS and contains reliable information on an important dimension of job demands. The (standardized) score on this factor is used hereafter as the Work Pressure indicator (dataset pooled).
Table 3 shows that, with minor exceptions, perceived work pressure has been steadily increasing over the years for all skill levels. Differences for the period are significant at the 0.001 level for all workers. The increase in work pressure has been higher for high-skill clerical workers – who suffer from the highest levels of work pressure at the end of the period while enjoying relatively low levels at the beginning - and lower for low-skill manual workers. These findings suggest that it is high skill clerical workers who have seen their situation deteriorate the most, but definite conclusions can only be drawn from the analysis of the combined evolution of work autonomy and work pressure.
12 Table 3. Work pressure and work autonomy scores over time, all countries pooled
1995 2000 2005 2010 2010-1995 Work Pressure: High-skill clerical -0.144 -0.162 0.157 0.214 0.358* n= 2326 3310 2599 3847 Low-skill clerical -0.291 -0.278 0.043 -0.024 0.267* n= 5631 8118 5373 8758 High-skill manual 0.15 0.19 0.533 0.41 0.260* n= 2140 2912 1671 2508 Low-skill manual -0.047 0.014 0.094 0.179 0.226* n= 2433 3558 2625 3515 Total -0.141 -0.122 0.145 0.122 0.263* n= 12531 17898 12267 18628 Work Autonomy: PA 0.023 0.011 -0.028 -0,008 -0.031* n= 12517 17880 12249 18598 CA 0.116 -0.012 -0,054 -0.030 -0.146* n= 12517 17880 12249 18598
* Significant difference at the 0.001 level
Note: the 0.00 score corresponds to the average level of work pressure or work autonomy of all workers for all waves; a negative score means below average work pressure/work autonomy while a positive score means above average work pressure/autonomy.
The analysis reveals that, overall, work pressure increased and work autonomy decreased over the period. More specifically, Figure 1 shows that job strain clearly increased for all workers over the period: work pressure rose for all skill levels without being compensated for by any increase in work autonomy. Work autonomy decreased more intensely and work pressure increased the most between 2000 and 2005; since then, both phenomena seem to have stabilized but no reversion of the overall negative trends can be observed. Work pressure for high-skill clerical workers increased markedly but they still benefit from high, though declining, work autonomy levels [4], especially when compared to low-skill clerical workers. But according to Karasek and Theorell (1990)’s model, it is high-skill manual workers who suffer from the highest job strain since they experience the larger excess of work pressure over decision latitude. The large discrepancy between work autonomy and work pressure for manual workers may partly explain their lower levels of job satisfaction.
13
Fig 1: Work autonomy (PA and CA) and Work Pressure by skill level and year for all countries
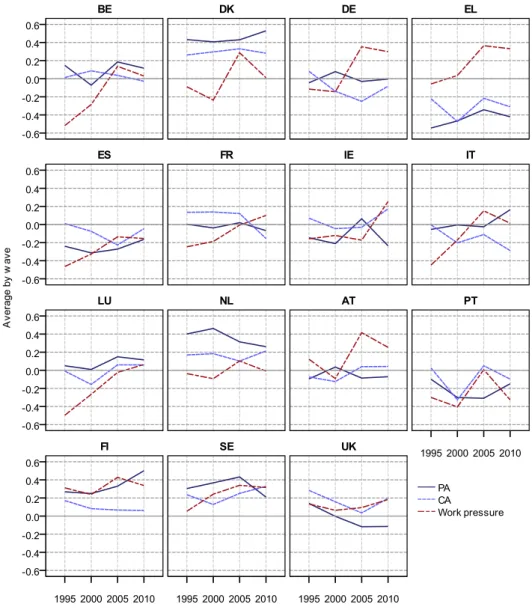
Turning now to the analysis of countries, we can see in Figure 2 that Finland and Sweden have the highest perceived work pressure over the period, followed by the Netherlands and Denmark – the four countries where work autonomy is also the highest. But we can also note that work pressure was already very high in Finland and Sweden in 1995. While closer to the Continental countries for work autonomy, the United Kingdom stands closer to the Scandinavian countries regarding work pressure, which indicates high levels of job strain in this country.
Another interesting finding is that Continental countries (Belgium, Austria, Germany, France, Luxemburg) and Ireland [5] display quite high work pressure at the end of the period – in fact, these are the countries where work pressure increased the most – and yet are still characterized by rather low work autonomy. Finally, South European countries - with the exception of Greece for work pressure - display low
14
levels of both work pressure and work autonomy. Italy stands between Continental and South European countries.
Fig 2: Work autonomy (PA and CA) and Work Pressure by country and year
As for trends, the evolution for workers in Continental countries and Greece is the most negative: work pressure rose significantly without being compensated for by increases in work autonomy. Workers in Scandinavian countries have seen their situation slightly worsen or stabilize. Analysis by skill level and country (results not shown, available on request) shows that whereas most clerical workers benefitted from lower work pressure than manual workers in Continental countries over the period, workers of all skill levels in Scandinavian countries have always experienced
15
similar – high - levels of work pressure. The conclusions concerning polarization trends and welfare regimes are the same for work pressure and work autonomy: overall, a polarization trend is observed between high and low skill clerical workers with a deeper worsening of the latter group’s situation, and Scandinavian countries offer markedly more egalitarian and higher quality jobs.
5. Examining the relation between work autonomy, work pressure and
job satisfaction
To analyze the extent to which the evolution of work autonomy and work pressure affects job satisfaction, we estimate econometric models using worker-level data and controlling for several explanatory variables of job satisfaction.
Since job satisfaction is measured through an ordered multi-level scale, we use an ordered logit regression model. Our main interest is in the work autonomy and work pressure variables, measured using the scores obtained previously. We also introduce an interaction term between work autonomy and work pressure to capture the effect of the relation between both variables on job satisfaction. As mentioned, our hypothesis is that an increase in work pressure is less harmful to the worker’s satisfaction if he/she enjoys high autonomy. This means that the coefficients of the interaction terms should be positive.
We introduce sequentially our explanatory variables, starting with the control variables. Next, we test the autonomy variables, followed by work pressure. The quadratic terms of both variables are then introduced. Finally, the interaction terms between autonomy and work pressure are considered. The quadratic terms are introduced prior to the interaction terms to rule out the possibility that the significance of the interaction is the spurious result of a curvilinear impact of work autonomy or work pressure on job satisfaction (Mansell and Brough, 2005). One advantage of this sequential approach is that it allows understanding what occurs to the unexplained time trend as additional variables are introduced.
16
Our first estimated model includes only control variables (Model 1, Table 4), that is, the variables available in the four EWCS waves that theory and previous evidence show to influence job satisfaction: socio-demographic features, skill level, hours of work, and dummies for years, countries, fixed term contract and economic sector (description of variables in Table 1A). Results confirm those of the descriptive analysis reported earlier: low skill workers are less satisfied than high skill workers, and manual workers experience less satisfaction than clerical workers. The coefficients for the other control variables are in line with previous studies on the determinants of job satisfaction. The time dummies indicate a significant unexplained decline in job satisfaction between 1995 and 2010.
In the second model, the introduction of the autonomy variables (Model 2, table 4) reveals that work autonomy has a significant and positive effect on job satisfaction, a result consistent with the literature. Even though the time dummies continue to be statistically significant, the reduction in their size shows that work autonomy contributes to explain the observed decline in job satisfaction.
Next, we introduced work pressure which, as expected, proves to be negatively and significantly related to job satisfaction (Model 3, Table 4). An one unit increase in work pressure (the value of the standard deviation) decreases the odds of a higher level of job satisfaction compared with a lower level by a factor of 0.40. Likewise, PA and CA increase the odds ratio by a factor of 0.25 and 0.22, respectively. It can also be observed that the 2005 and 2010 time dummies become insignificant after introducing work pressure, which means that the increase in work pressure is highly significant in explaining the decline in job satisfaction.
Quadratic terms for CA, PA and WP were then introduced because, besides the reason pointed above, autonomy and work pressure may have non-linear effects on job satisfaction (Karasek, 1979). Indeed, the detrimental effect of work pressure on job satisfaction may increase as work pressure increases: an increase in work pressure would have a greater negative impact on job satisfaction for a worker with an already high work pressure. Results confirm the curvilinear effects of autonomy and pressure on job satisfaction (Model 4, Table 4). For example, assuming autonomy constant, if
17
work pressure increases one unit for a worker with low work pressure (work pressure =-1) the odds of a higher level of job satisfaction compared to a lower level decreases by a factor of 0.34, while the same increase in work pressure in a worker with high work pressure (work pressure =1) has an impact of - 0.45.
Interestingly, the impact of both autonomy indicators increases with the level of autonomy, as can be seen by the positive sign of the squared terms of autonomy. In other words, both work pressure and work autonomy have an increasing marginal impact on job satisfaction, the former being negative and the latter positive. Workers with already large autonomy are those who most benefit from an increase in autonomy. Other aspects constant, an increase in PA for a worker with high PA (=1) has a 2 times larger effect on job satisfaction than for a worker with low PA (=-1): the odds ratios increase 0.38 and 0.19, respectively. A possible explanation for this result is that there may be a learning process on how to cope with autonomy, a process yielding satisfaction.
Finally, we introduced the interaction terms between work pressure and work autonomy (Model 5, Table 4). The interaction terms are positive, confirming our expectation: an increase in work pressure has a smaller negative impact on job satisfaction when the workers’ autonomy is high. This indicates that the moderating influence of autonomy on the effect of work pressure on job satisfaction – the “buffer” effect - is significant. Furthermore, a simultaneous increase of one unit in PA, CA and WP increases the odds ratio of job satisfaction by a factor of 0.11. [6] This confirms Karasek (1979)’s prediction that high work pressure and high work autonomy may be associated to higher job satisfaction than low work pressure and low autonomy.
We also estimated the model for each country separately (results not shown, available on request). For all countries, the coefficients of the work autonomy variables are significant and positive while the work pressure coefficients are negative and of larger amplitude. It is in the countries where work pressure increased the most and where work autonomy is around average (Austria, Belgium, Denmark, France, Germany and Luxemburg) that the negative effect of work pressure on job satisfaction is higher (above EU average). Conversely, for low levels of work autonomy and work
18
pressure (Spain and Portugal), the negative effect of work pressure is below average, as is the positive effect of work autonomy. In other words, increases in work autonomy are more valued by workers in Continental and Scandinavian countries, which confirm the results obtained with the aggregate data at the European level.
Table 4. Regressions for job satisfaction
Model 1 Model 2 Model 3 Model 4 Model 5
PA 0.328*** (0.013) 0.255*** (0.013) 0.286*** (0.016) 0.290*** (0.016) CA 0.135*** (0.013) 0.216*** (0.013) 0.252*** (0.018) 0.250*** (0.018) Work Press. (WP) -0.402*** (0.0137) -0.396*** (0.013) -0.392*** (0.013) PA squared 0.049*** (0.014) 0.062*** (0.015) CA squared 0.034*** (0.011) 0.024** (0.012) WP squared -0.029*** (0.011) -0.027** (0.011) PA*WP 0.050*** (0.012) CA*WP 0.047*** (0.012) LSC -0.246*** (0.039) -0.130*** (0.040) -0.195*** (0.041) -0.192*** (0.041) -0.190*** (0.041) HSM -0.610*** (0.050) -0.397*** (0.050) -0.391*** (0.051) -0.388*** (0.051) -0.380*** (0.051) LSM -0.826*** (0.045) -0.530*** (0.047) -0.544*** (0.048) -0.540*** (0.048) -0.526*** (0.048) Hours of work -0.008*** (0.001) -0.009*** (0.001) -0.004*** (0.001) -0.004*** (0.001) -0.004*** (0.001) Fixed Contract 0.258*** (0.035) 0.217*** (0.035) 0.225*** (0.035) 0.224*** (0.035) 0.219*** (0.035) Women -0.064** (0.030) -0.032 (0.030) -0.021 (0.030) -0.019 (0.030) -0.015 (0.030) Age -0.024*** (0.007) -0.036*** (0.007) -0.028*** (0.007) -0.027*** (0.007) -0.028*** (0.007) Age squared 0.0003*** (0.00009) 0.0004*** (0.00009) 0.0003*** (0.00009) 0.0003*** (0.00009) 0.0003*** (0.00009) Year 2000 -0.135*** (0.037) -0.118*** (0.038) -0.089** (0.038) -0.092** (0.038) -0.094** (0.038) Year 2005 -0.173*** (0.041) -0.137*** (0.042) 0.009 (0.042) 0.010 (0.042) 0.009 (0.042) Year 2010 -0.195*** (0.036) -0.167*** (0.036) -0.015 (0.037) -0.018 (0.037) -0.021 (0.037) No. observ 59388 59278 59278 59278 59278 Pseudo R2 0.0703 0.0873 0.1149 0.1150 0.1076 F(sig) 98.69 (0.000) 110.90 (0.000) 127.77 (0.000) 117.31 (0.000) 112.31 (0.000)
Note: The base categories are: high-skill clerical for skill level, services for economic sector and UK for country. standard deviations in brackets. Other control variables also included: dummies for economic sector and country dummies. * – significant at 10% level of significance, ** – significant at 5%, and *** – significant at 1%.
19
Attending to the limitations of job satisfaction as an indicator of well-being at work (see Section 2), we wanted to know whether our results hold when job satisfaction is replaced by work-related health problems. We constructed a variable with the number of diseases likely to be generated by job strain that the employee says have been caused by his job: anxiety, heart diseases, overall fatigue, sleep difficulties, and some muscular pains. This variable was used as dependent variable in the estimation of an equation similar to model 5 (in Table 4). Both the correlation and the regression analyses show that more PA is associated to a smaller number of reported diseases, while more CA and work pressure contribute to an increase in the number of diseases (results available on request). The interaction terms between each of the autonomy indicators and work pressure are not statistically significant, but they have a negative sign. Therefore, when job satisfaction is replaced by the number of work-related diseases, we find weaker but still positive evidence supporting the Karasek-Theorell’s model, which is consistent with results reported in meta-analyses (Van der Doef and Maes, 2010; De Lange et al, 2003).
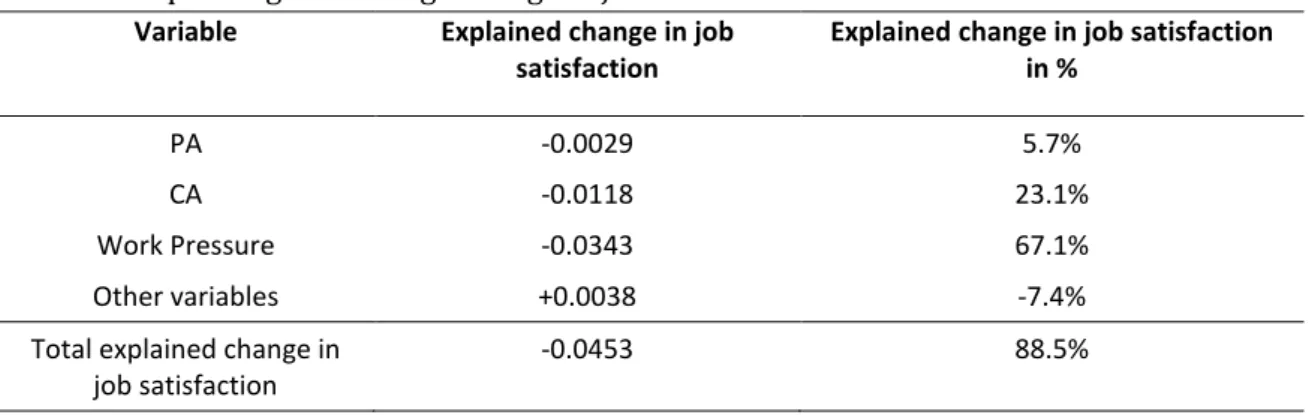
Finally, to assess the extent to which the evolution of work pressure and work autonomy accounts for the average decline in satisfaction, we followed Green (2006) and Bartolini et al.. (2011). First, to simplify calculations and the interpretation of results, we estimated the job satisfaction model using OLS. Then, we computed the average change between 1995 and 2010 in each regressor. Finally, we multiplied each variable’s coefficient obtained in the first step by the respective average change in the variable, but using only the coefficients significant at the 10% level. We thereby obtained the contribution of each regressor to the explanation of the average change in job satisfaction. The sum of the contributions of each explanatory variable gives us the overall predicted change in job satisfaction, which can be compared with the observed variation in job satisfaction (- 0.047).
The application of this method shows that the increase in work pressure is the main factor explaining the decline in job satisfaction, accounting for around 67% of the decline (Table 5). The decrease in CA was also an important factor, explaining around 23% of the reduction in job satisfaction. PA accounted for only 6% of the decline in satisfaction. As suggested in the literature (Clark, 2005; Rose, 2003) the deterioration
20
of the quality of intrinsic aspects of work outweighed the beneficial effects on job satisfaction of other features of work.
Table 5. Explaining the average change in job satisfaction
Variable Explained change in job satisfaction
Explained change in job satisfaction in %
PA -0.0029 5.7%
CA -0.0118 23.1%
Work Pressure -0.0343 67.1%
Other variables +0.0038 -7.4%
Total explained change in job satisfaction
-0.0453 88.5%
6. Discussion and concluding remarks
Our main contribution in this paper is to shed light on the long-term evolution of some intrinsic aspects of work, namely work autonomy and work pressure, in fifteen EU countries, and of its impact on the well-being of workers. Because job satisfaction is an imperfect measure of well-being at work, we concentrated on assessing the effect of the combined evolution of work pressure and work autonomy on the change – rather than the level - in job satisfaction since 1995.
Karasek and Theorell (1990) have long since highlighted the need to monitor the levels of both variables simultaneously. Our hypothesis, derived from Karasek (1979)’s strain hypothesis, that an increase in work intensity is less harmful to the worker’s satisfaction if the worker enjoys high work autonomy, is confirmed by the econometric results. Regression analyses show that our model also performs well at the country level. The use of the method suggested in Bartolini et al. (2011) revealed that the increase in work pressure and decrease in work autonomy account for most of the observed average decline in job satisfaction. Our results support the existence of additive and interactive effects of work intensity and work autonomy, which is in line with the evidence surveyed by De Lange et al (2003) and Van der Doef and Maes (2010) that shows that high levels of work intensity not accompanied by high levels of work autonomy are detrimental for the workers’ well-being.
21
It must be noted that the well-being generated by autonomy is not simply a subjective experience of pleasure; work autonomy has also an objective function related to vitality, psychological flexibility and self-realization. What is at stake in work autonomy is hence more than the pleasantness of given work conditions; it involves one’s self-esteem and opportunity for personal growth, that is, the eudaimonic dimension of well-being.
Overall, our results document a clear deterioration in the psychosocial work environments in the EU. Work pressure has risen considerably in the last fifteen years and work autonomy has not kept up with this development. On the contrary, and in contradiction with dominant managerial discourses, it seems that the changes in the organization of work of the last two decades have led to a decline in the workers’ influence on when and how to do their work and, for most workers, also on the content of work. Workers are pressured to deliver more results while the tools provided to cope with such demanding situations have decreased. This means that high-strain working situations are becoming more predominant in the EU, which is shown to be highly detrimental to physical and psychological health and to result in premature retirement from work (Siegrist, 2006).
Most existing studies examine job quality at the country level without differentiating by skill level. In contrast, we have been able to document i) the very discrepant situation of manual and clerical workers in most countries and ii) the substantial divergent process taking place between high and low skill clerical workers in all but Scandinavian countries. We also show that the differences between welfare regimes in terms of job quality are deepening rather than diminishing. Some of the distinguishing features of Scandinavian countries are i) the stabilization of work autonomy at high levels, ii) a less marked increase in work pressure than in other countries (probably because work pressure levels were already high in 1995); iii) the fact that workers of all skill levels face similar intrinsic job characteristics.
Our analysis confirms the results obtained by Dhondt et al. (2002)’s for the year 2000 and testifies to their structural nature: most workers in Scandinavian countries work in “active jobs” which, by combining high levels of work autonomy and work
22
intensity, are hypothesized to be favorable to the workers’ self-development (Karasek and Theorell, 1990). By contrast, most South European workers are in “passive jobs”, hypothesized to be related to low overall activity and reduced problem-solving ability. These results strongly suggest that institutional factors, e.g. the strength of trade union membership and the public policy commitment to work life quality, and societal factors, which influence firm-level management policies and work attitudes, may be of great importance. Further research should aim at better understanding the role played by institutional and cultural factors in influencing work autonomy.
Mention should be made of some limitations of the present study. Firstly, the cross-sectional nature of the data does not allow the establishment of causal relationships, even though it was difficult to avoid mentioning causality when interpreting the results. We are aware of the potential endogeneity of working conditions in a job satisfaction model, but the features of the data make it difficult to control properly for it. Secondly, as previously mentioned, self-reported measures of intrinsic facets of work are always subject to expectations biases – this is why i) our indicators of work autonomy and work pressure comprise more information than usually found in the literature, resulting in more rigorous constructs, ii) our analysis devotes particular attention to the interpretation of observed changes.
The observed trends in intrinsic aspects of work clearly go against the desired evolution. We appear to be developing work environments that place impossible demands on workers and lead to severe health and social problems. A normative recommendation follows directly from our theoretical framework and empirical results: work processes should provide increased work autonomy, as work pressure is not likely to substantially decrease in the near future. Moreover, one of our econometric findings (to our knowledge previously unobserved) suggests that work pressure has increasing negative marginal effects on job satisfaction. Since high skill jobs already have high work pressure, this result suggests that work pressure may be reaching an upper limit for high skill workers. As pointed out by Van der Doef and Maes (2010) and others, Karasek (1979) might have been wrong when suggesting that work autonomy would always buffer the negative effects of work intensity. Beyond a certain level, it is highly probable that these negative effects cannot be mitigated.
23
Notwithstanding the pressures from product and financial markets, employers can do a great deal to improve working conditions, as evidenced by the wide differences in the quality of psychosocial environments observed in the EU. Securing healthy psychosocial work environments is a major responsibility as their effects no doubt spill over to the whole society.
Acknowledgments
The authors gratefully acknowledge the valuable comments and suggestions of the anonymous referees.
The European Working Conditions Surveys are sponsored and owned by the European Foundation for the Improvement of Living and Working Conditions and distributed by UK Data Archive, University of Essex. These institutions bear no responsibility for the present analysis and interpretation of the data.
References
Bauer, T. (2004), “High performance workplace practices and job satisfaction: Evidence from Europe”, IZA Discussion Paper No. 1265.
Bustillo, R., Fernández-Macías, E., Esteve, F. and Antón, J.-I. (2011), “E pluribus unum? A critical survey of Job quality indicators”, Socio-Economic Review, Vol. 9 No. 3, pp. 447-502.
Brown, A.; Charlwood, A.; Forde, C. and David S. (2007), “Job quality and the economics of New Labour”, Cambridge Journal of Economics, Vol 31, pp. 941-971.
Clark, A. (2005), “Your money or your life: Changing job quality in OECD countries”, British
Journal of Industrial Relations, Vol. 43 No. 3, pp. 377-400.
Danna, K. and Griffin, R. (1999), “Health and well-being in the workplace: A review and synthesis of the literature”, Journal of Management, Vol. 25 No 3, pp. 357-384.
Davoine, L., Ehrel, C. and Guergoat-Lariviere, M. (2008), “Monitoring quality in work”,
24 De Jonge, J. and Kompier, M. (1997), A critical examination of the Demand-control-support model from a work psychological perspective“, International Journal of Stress Management, vol. 4 No. 4, pp.235-258.
De Lange A., Taris T., Kompier M., Houtman I., Bongers P. (2003), The very best of the millenium, Journal of Occupational Health Psychology, Vol. 8 No. 4, pp. 282-305.
Esser, I. and Olsen, K. (2012), “Perceived job quality: autonomy and job security within a multilevel framework”, European Sociological Review, Vol. 28 No. 4, pp. 443-454.
Eurofound (1995) (2000) (2005) European Working Conditions Survey (computer files). Colchester, Essex: UK Data Archive [distributor], March 2007. SN: 5286, DOI: 10.5255/UKDA-SN-5286-1; SN: 5604, DOI: 10.5255/UKDA-SN-5604-1; SN: 5639. DOI: 10.5255/UKDA-SN-5639-1.
Eurofound (2007), Measuring job satisfaction in surveys – Comparative analytical report, Dublin, Eurofound.
Eurofound (2010a) EWCS (computer file). Colchester, Essex: UK Data Archive [distributor], February 2012. SN: 6971, DOI: 10.5255/UKDA-SN-6971-1.
Eurofound (2010b) - http://www.eurofound.europa.eu/pubdocs/2010/74/en/3/EF1074EN.pdf, accessed 21th March 2012
Gagné, M. and Deci, E. (2005), “Self-determination theory and work motivation”, Journal of
Organizational Behavior, Vol. 26, pp. 331-362.
Gallie, D. (2007), “Task discretion and job quality”, in Gallie, Duncan (Ed.), Employment
Regimes and the Quality of Work, Oxford, Oxford University Press, pp. 105-136.
Gallie, D. (2003): “The quality of working life. Is Scandinavia different?”, European Sociological
Review, Vol. 19, pp. 61-79.
Green, F. (2006), Demanding Work, Princeton and Oxford, Princeton University Press.
Green, F. (2004), “Work intensification, discretion, and the decline in well-being at work”,
Eastern Economic Journal, Vol. 30 No. 4, pp. 615-625.
Green, F. and Tsitsianis, N. (2005), “An investigation of national trends in job satisfaction in Britain and Germany”, British Journal of Industrial Relations, Vol . 43 No. 3, pp. 401-429.
25 Judge, T., Thoresen, C., Bono, J. and Patton, G. (2001), “The job satisfaction-job performance relationship: A qualitative and quantitative review”; Psychological Bulletin, Vol. 127, No. 3, pp. 376-407.
Karasek, R. and Theorell, T. (1990), Healthy work: Stress, productivity and the reconstruction of
work life, New York: Basic Books.
Knudsen H, Busck O, and Lind, J (2011), “Work environment quality: The role of workplace participation and democracy”; Work, Employment & Society, 25(3): 379-396.
Lopes, H.; Lagoa, S., and Teresa C. (2013), “Declining autonomy at work in the EU and its effect on civic participation”, Economic and Industrial Democracy, online before print, June 11, 2013 doi: 10.1177/0143831X13484606.
Mansell A. and Brough, P. (2005), “A comprehensive test of the job-demands-control interaction”, Australian Journal of Psycholoy, Vol. 57 No. 2, pp. 103-114.
Meulman, J., Van Der Kooij, A. and Heiser, W. (2004), “Principal components analysis with nonlinear optimal scaling transformations” in D. Kaplan (ed.), The Sage Handbook of
Quantitative Methodology for the Social Sciences, Thousand Oak: SAGE Publications, pp. 49–70.
Nguyen, A. N., Taylor, J. and Bradley, S. (2003), “Job autonomy and job satisfaction: new evidence”, Lancaster University Working-Paper 2003/050.
Rose, M. (2003): “Good deal, bad deal? Job satisfaction in occupations”, Work, Employment
and Society, Vol. 17, pp. 503-530.
Ryan, R. and Edward D. (2000), “Self-determination Theory and the facilitation of intrinsic motivation, social development, and well-being”, American psychologist, Vol. 55, pp. 68-78. Siegrist, J. (2006), “Work, health and welfare: new challenges”, International Journal of Social
Welfare, Vol. 15 (Suppl.1), pp. S5-S12.
Sousa-Poza, A. and Sousa-Poza, A. (2000), “Well-being at work: a cross-national analysis of the levels and determinants of job satisfaction”, Journal of Socio-Economics, Vol. 29, pp. 517-538. Spector, P (1986), “Perceived control by employees: A meta-analysis of studies concerning autonomy and participation at work”, Human Relations, Vol. 39, 1005-1016.
Utman, C. H. (1997), “Performance effects of motivational state: A meta-analysis”, Personality
26 Van der Doef, M. and Maes, S. (2010), The job-demand-control-(support) model and psychological well-being, Work and Stress: An International Journal of Work, Health and
Occupations, Vol. 12 No 2, pp. 87-114.
Notes
[1] Terminology is far from stabilized. Green and Gallie use “task discretion” while Karasek prefers “job control” or “decision latitude”. Such oscillations are only partially explained by the information included in the indicators. We use “work autonomy” as this seems to be the term common to psychologists, sociologists and economists, notwithstanding the many facets of the phenomenon and the corresponding necessary nuances.
[2] See http://www.eurofound.europa.eu/surveys/ewcs/2010/sampling.htm and http://www.eurofound.europa.eu/docs/ewco/4EWCS/Methodology.pdf for further information.
[3] See http://www.eurofound.europa.eu/surveys/ewcs/2010/methodology.htm.
[4] It is interesting to note that CA, i.e. control over work content, has risen for HSC but declined for LSM workers. Conversely, low-skill manual workers now have more control over their work methods and schedules (increasing PA) while high-skill clerical workers have less. [5] Note that for labor-related matters the Anglo-Saxon countries do not appear to create a distinct model, a fact already pointed out by Davoine et al. (2008) in their study of job quality in the EU.
[6] Two notes should be made. Firstly, an increase of one unit in those variables is equivalent to one standard deviation increase. Secondly, in this exercise we assume the initial values of work pressure and both work autonomies to be zero, the average value.
[7] A 2-factor model was adjusted using Confirmatory Factor Analysis that supported the results of our PCA. Due to the dichotomous nature of the variables considered, we used Mplus v6.11 and WLSMV (robust Weighted Least Squares for categorical data) estimators. General fit measures were generally adequate (CFI=0.963, TLI=0.956, RMSEA=0.043).
27
Appendix
Table 1A – Definition of Variables PA – Procedural Autonomy (1 – yes; 0 – no)
Is the respondent able to choose or change his/her method of work? speed or rate of work? order of tasks?
Is the respondent’s pace of work dependent on the direct control of his/her boss? CA – Content Autonomy (1 – yes; 0 – no)
Does the respondent’s main paid job involve assessing the quality of his/her own work? learning new things?
resolving unforeseen problems on his/her own? Classification of occupations into skill levels
High-Skilled Clerical Isco1 – Legislators, senior officials and managers Isco2 – Professionals
Low-Skilled Clerical Isco3 – Technicians and associate professionals Isco4 – Clerks
Isco5 – Service workers and shop and market sales workers High-Skilled Manual Isco6 – Skilled agricultural and fishery workers
Isco7 – Craft and related trades workers
Low-Skilled Manual Isco8 – Plant and machine operators and assemblers Isco9 – Elementary occupations
Isco10 – Armed forces Other variables
Work pressure: see Table 2A below.
Satisfaction: satisfaction with working conditions in main paid job? 1– not at all satisfied to 4 – very satisfied.
Women - 1 and 0 – men. Age: in years.
Year 2000: 1 – 2000 and 0 – otherwise. Year 2005 and Year 2010: similar to Year 2000. LSC - 1 and 0 otherwise.
HSM - 1 and 0 otherwise. LSM - 1 and 0 otherwise. Hours of work: per week.
28
Table 2A. Distribution of Work intensity variables, by year
1995 2000 2005 2010
q45a. Does your job involve working at very high speed?
Never 29.00% 26.60% 20.50% 20.00%
Almost never 16.40% 17.30% 18.20% 17.70% Around 1/4 of the time 11.20% 11.60% 12.70% 13.80% Around half of the time 11.60% 12.10% 12.30% 14.10% Around 3/4 of the time 6.10% 7.40% 10.30% 10.90% Almost all of the time 14.30% 13.80% 15.70% 14.40% All of the time 11.40% 11.10% 10.30% 9.20%
q45b. Does your job involve working to tight deadlines?
Never 28.60% 23.10% 18.10% 17.80%
Almost never 13.90% 16.90% 18.90% 17.60% Around 1/4 of the time 11.00% 11.70% 12.70% 13.90% Around half of the time 9.80% 10.90% 11.80% 13.70% Around 3/4 of the time 5.90% 8.10% 10.10% 9.90% Almost all of the time 14.30% 14.50% 15.10% 14.60% All of the time 16.40% 14.80% 13.30% 12.40% q46a. Is your pace of work
dependent on the work done by colleagues?
% yes responses 40.90% 47.10% 46.20% 43.30% q46c. Is your pace of work
dependent on numerical production/performance targets
% yes responses 36.40% 30.80% 44.40% 43.00%
q51g. You have enough time to get the job done (ordinal)
Always 38.20% 29.60%
Most of the time 29.00% 43.50%
Sometimes 19.50% 16.40%
Rarely 7.90% 7.30%
Never 5.40% 3.20%
q51g_01. You have enough time to get the job done (dichotomous)
% yes responses 77.10% 77.80%
View publication stats View publication stats