Department of Information Science and Technology
UNFOLDING THE DRIVERS FOR ACADEMIC SUCCESS: THE CASE OF
ISCTE-IUL
A Dissertation presented in partial fulfilment of the Requirements for the Degree of Master in Computer Engineering
By
PAULO ALEXANDRE VIEIRA DINIZ FERREIRA GIL
Advisor:
PhD, Sérgio Moro, Assistant Professor, ISCTE-IUL
Co-advisor:
PhD, Susana da Cruz Martins, Assistant Professor, ISCTE-IUL
I
Abstract
Predicting the success of academic students is a major topic in the higher education research community. This study presents a data mining approach to predict academic success in a Portuguese University called ISCTE-IUL, unveiling the features that better explain failures. A dataset of 10 curricular years for bachelor’s degrees has been analysed. Features’ selection resulted in a characterising set of 68 features, encompassing socio-demographic, social origin, previous education, special statutes and educational path information. Understanding features’ collection timings, distinct predicting was conducted. Based on entrance date, end of the first and the second curricular semesters, three distinct data models were proposed and tested. An additional model was designed for outlier degrees (i.e., a 4-year Bachelor). Six algorithms were tested for modelling. A support vector machines (SVM) model achieved the best overall performance and was selected to conduct a data-based sensitivity analysis. Relevance and impact review allowed extracting meaningful knowledge. This approach unfolded that previous evaluation performance, study gaps and age-related features play a major role in explaining failures at entrance stage. For subsequent stages, current evaluation performance features unveil their predicting power. Also, it should be noted that most of the features’ groups are represented on each model’s most relevant features, revealing that academic success is a combination of a wide range of distinct factors. These and many other findings, such as, age-related features increasing impact at the end first curricular semester, set a baseline for success improvement recommendations, and for easier data mining adoption by Higher Education institutions. Suggested guidelines include to provide study support groups to risk profiles and to create monitoring frameworks. From a practical standpoint, a data-driven decision-making framework based on these models can be used to promote academic success.
III
Resumo
O sucesso académico é um dos tópicos mais explorados nos estudos sobre o ensino superior. Este trabalho apresenta uma abordagem de data mining para a previsão do sucesso académico no ISCTE-IUL. Numa abordagem focada no insucesso, são estudados os fatores que explicam estes casos. Neste estudo foram utilizados dados de licenciatura de 10 anos curriculares. Foram analisadas 68 características sociodemográficas, origem social, percurso escolar anterior (ensino secundário), estatutos especiais e percurso académico. Foram adotados diferentes vetores de análise para o primeiro ano curricular (entrada e final dos primeiro e segundo semestres curriculares), dando origem a 3 modelos distintos. Um modelo suplementar foi projetado para cursos especiais. Entre os seis algoritmos de modelação testados, SVM obteve a melhor performance, sendo utilizado para a análise de sensibilidade. O processo de extração de conhecimento indicou que fatores como desempenho anterior, interrupções do percurso educacional e idade, demonstram grande impacto no (in)sucesso num estágio inicial. Nos estágios seguintes, fatores de performance atuais revelam um grande poder de previsão do (in)sucesso. A maior parte dos grupos de características faz-se representar, nas características mais relevantes de cada modelo. Estes e outros resultados, como o aumento do impacto dos fatores relacionadas com a idade no final do segundo semestre curricular, suportam a criação de recomendações institucionais. Por exemplo, criar grupos de apoio ao estudo para perfis de risco e criar ferramentas de monitorização são algumas das diretrizes sugeridas. Em suma, é possível criar uma ferramenta de apoio à decisão, baseada nos modelos apresentados, podendo ser utilizada pelo ISCTE-IUL para promover o sucesso académico.
Palavras-Chave: Sucesso académico; Data mining; Modelação; SVM; Características; Análise de sensibilidade.
V
Acknowledgments
I would like to acknowledge my advisor Professor Sérgio Moro for all the support and guidance since the beginning and through each stage of this work. Sérgio provided me with the tools that I needed to choose the right direction and successfully complete my dissertation. Thus, I had the chance to explore and enhance my understanding regarding each stage that comprises a structured data mining project.
I would like to thank my co-advisor, Professor Susana Martins for all dedication and shared knowledge, that provide me the opportunity to learn so much about higher education research field. Both provided me with brilliant insights that greatly improved the quality of this dissertation.
A special referral is due to António Casqueiro, António Luís Lopes, Pedro Ramos and the whole Information Systems Department of ISCTE-IUL for providing the academic dataset and their dedication on clarifying our questions about it.
I would like to express my very profound gratitude to my parents, close family and friends for all the support and continuous encouragement throughout my years of study and specially to my beloved wife through the process of researching and writing this dissertation. Finally, I would also like to dedicate this accomplishment to my firstborn Margarida that is about to be born. It would not have been possible without you all. Thank you.
VII
Index
Abstract ... I Resumo ... III Acknowledgments ... V 1. Introduction ... 1 2. Literature review ... 23. Materials and methods ... 18
3.1. Domain understanding and data mining problem definition ... 18
3.2. Unfolding a higher education institution database ... 19
3.3. Preparing the Analytical Base Table ... 26
4. Results and discussion ... 32
4.1. Modelling... 32
4.2. Evaluation ... 33
4.2.1. Features’ selection tuning ... 34
4.2.2. Final models’ evaluation ... 36
4.2.3. Extended evaluation for 4-years Bologna bachelor’s degrees ... 44
4.3. Knowledge extraction and guidelines for implementation ... 48
4.3.1. DM_Entrance model’s DSA ... 48
4.3.2. DM_EntryYear1Sem model’s DSA ... 54
4.3.3. DM_EntryYear2Sem model’s DSA ... 58
4.3.4. DM_Entrance_IGE model’s DSA ... 61
4.3.5. Practical implications ... 62
5. Conclusions ... 65
6. References ... 70
VIII
Appendix A – Related works details ... 78
Appendix B – Data source model ... 82
Appendix C – Features detail ... 83
Appendix D – DM Algorithms on literature ... 88
Appendix E – DM_30%FilledFeatures model evaluation ... 91
Appendix F – Complete features’ importance ... 93
Appendix G – High relevance features’ impact on DM_EntryYear1Sem model ... 97
Appendix H – High relevance features’ impact on DM_EntryYear2Sem model ... 99
IX
Table Index
Table 1 - Summary of the 41 reviewed studies. ... 9
Table 2 – Features’ groups used in EDM literature. ... 15
Table 3 - First ABT version. ... 21
Table 4 - Additional derived features included in ABT. ... 23
Table 5 - Additional computed features included in ABT. ... 25
Table 6 – High level concepts for data generalization ... 26
Table 7 - Missing data features handling ... 27
Table 8 - Removed single class's features ... 28
Table 9 - Outliers and conflicting data features approach ... 29
Table 10 - Final ABT for DM modelling purposes. ... 29
Table 11 - AUC results for all preliminary test models. ... 34
Table 12 - AUC results for DM_30%FilledFeatures model. ... 35
Table 13 - AUC results for DM_Entrance model. ... 36
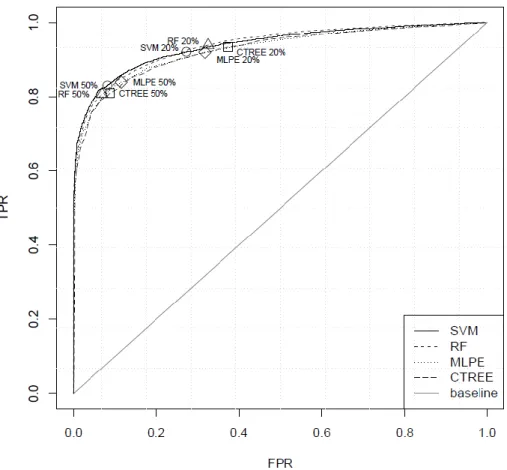
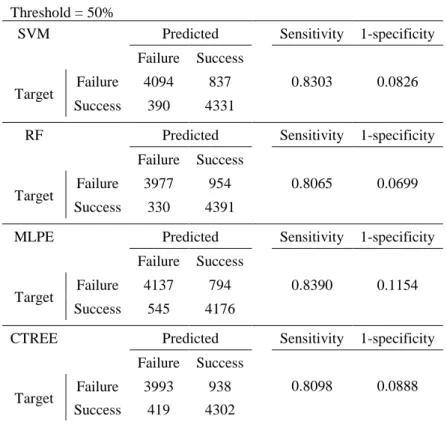
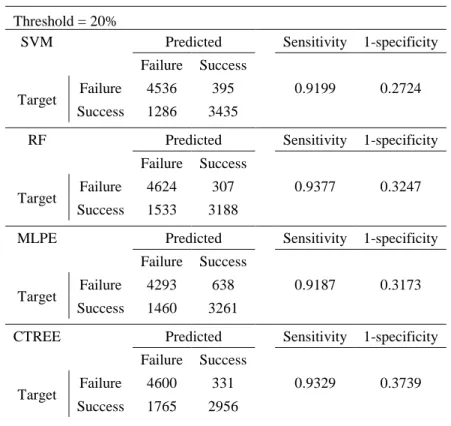
Table 14 - Confusion matrices for DM_Entrance model. ... 37
Table 15 - AUC results for DM_EntryYear1Sem model ... 38
Table 16 - Confusion matrices for DM_EntryYear1Sem model. ... 39
Table 17 - AUC results for DM_EntryYear2Sem model. ... 41
Table 18 - Confusion matrices for DM_EntryYear2Sem model. ... 42
Table 19 - AUC results for DM_Entrance_IGE model and all modelling techniques. ... 44
X
Figure Index
Figure 1 - Preliminary theoretical model for institutional action ... 3
Figure 2 - Inputs-Environments-Outcomes (IE-O) Model ... 4
Figure 3 - Framework for data mining application in educational systems ... 5
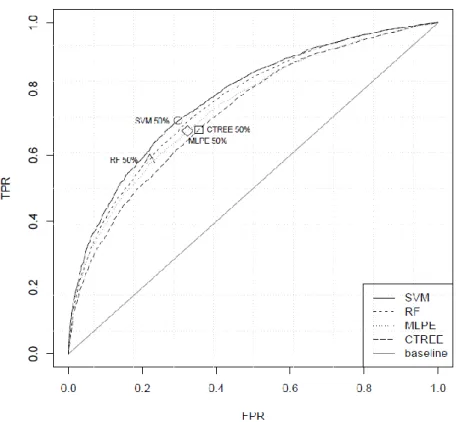
Figure 4 - ROC curves for DM_Entrance model. ... 37
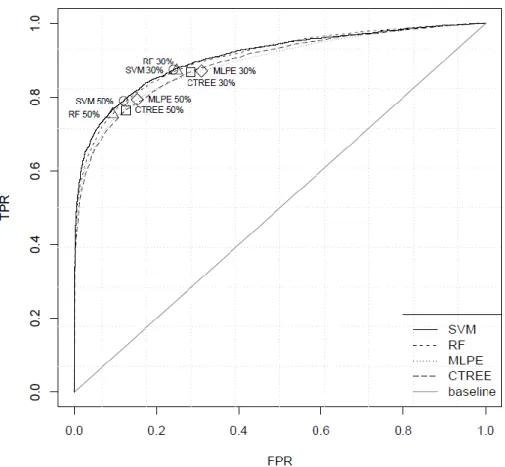
Figure 5 - ROC curves for DM_EntryYear1Sem model. ... 39
Figure 6 - ROC curves for DM_EntryYear2Sem model. ... 41
Figure 7 - Shows a wrapped-up analysis for reviewed models performance. ... 43
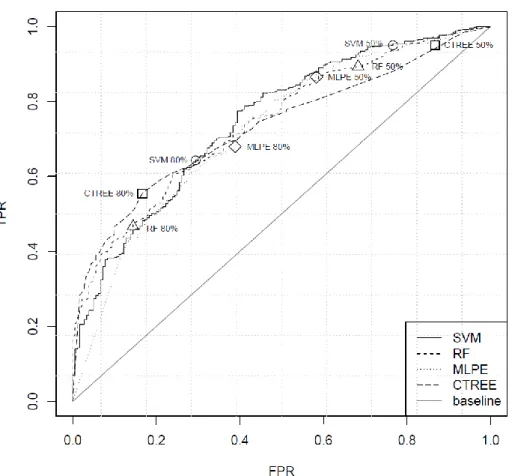
Figure 8 - ROC curves for DM_Entrance_IGE model. ... 45
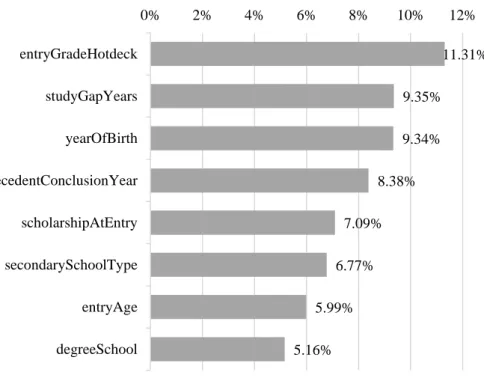
Figure 9 - Features’ relevance for DM_Entrance model. ... 49
Figure 10 - Impact of entryGradeHotdeck on DM_Entrance model. ... 49
Figure 11 - Impact of studyGapYears on DM_Entrance model. ... 50
Figure 12- Impact of yearOfBirth on DM_Entrance model. ... 51
Figure 13 - Impact of precedentConclusionYear on DM_Entrance model. ... 51
Figure 14 - Impact of scholarshipAtEntry on DM_Entrance model. ... 52
Figure 15 - Impact of secondarySchoolType on DM_Entrance model. ... 52
Figure 16 - Impact of entryAge on DM_Entrance model. ... 53
Figure 17 - Impact of degreeSchool on DM_Entrance model. ... 54
Figure 18 - Features’ relevance for DM_EntryYear1Sem model. ... 55
Figure 19 - Impact of weightedAverageGradeEntryYear1stSem on DM_EntryYear1Sem model. ... 56
Figure 20 - Impact of ectsCreditsEntryYear1stSem on DM_EntryYear1Sem model. ... 56
Figure 21 - Impact of averageGradeEntryYear1stSem on DM_ EntryYear1Sem model. ... 57
Figure 22 - Impact of sasGrantOwnerEntryYear1stSem on DM_ EntryYear1Sem model. .... 57
Figure 23 - Features’ relevance for DM_EntryYear2Sem model. ... 59
Figure 24 - Impact of weightedAverageGradeEntryYear2ndSem on DM_ EntryYear2Sem model. ... 59
Figure 25 - Impact of ectsCreditsEntryYear2ndSem on DM_ EntryYear2Sem model. ... 60
XI
Abbreviations
ABT Analytical Base Table ANN Artificial Neural Networks AUC Area Under the ROC Curve CC Cumulative Criteria
CRISP-DM Cross-Industry Standard Process for Data Mining
DM Data Mining
DSA Data-based Sensitivity Analysis DT Decision Trees
ECTS European Credit Transfer Scale EDM Educational Data Mining
ESCO European Skills, Competences, Qualifications and Occupations FPR False Positive Rate
GPA Grade Point Average HEI Higher Education Institutes LA Learning Analytics
MLPE Multilayer Perceptron RF Random Forests RQ Research Questions
ROC Receiver Operating Characteristic SA Sensitivity Analysis
SQ Search Queries
SVM Support Vector Machines TPR True Positive Rate
1
1. Introduction
Over the last decades, researchers on higher education are devoting more attention to academic success. While some studies establish theoretical frameworks to explain students’ success, the vast majority analyse success through empirical research by considering the operational definition adopted by the studied institutions (York et al., 2015). Predicting students success has been a key topic for long in various scientific communities (Romero & Ventura, 2010). Researchers frequently seek insights regarding student characteristics and their impact on academic success.
Higher education institutes (HEI) are increasingly realizing the potential of their information systems and the data managed through it. Huge datasets originated by the most diverse activities and operations for the most diverse purposes are stored every day. As the volume of available data increases, the interest on exploring its potential and learn from it increases alongside (Canito et al., 2018). Data Mining (DM) is a computational method of processing large sets of existing data to obtain meaningful knowledge (Moro et al., 2018). Nowadays, data stored in educational databases is considerably large and increasing rapidly. These large datasets contain hidden patterns that can be explored through DM. Therefore, research areas such as higher education are expanding their interest in extracting meaningful and more complex knowledge from their data sources (Koedinger et al., 2008). Recently, a research area that combines DM and education has emerged and consolidated. Educational Data Mining (EDM) is a field that explores DM applied on different types of educational data (Howard et al., 2016). EDM uses data mainly obtained from educational information systems unfold knowledge and find answers to questions and problems concerning the education system.
This study aims to provide ISCTE-IUL - Instituto Universitário de Lisboa (ISCTE-IUL) meaningful information to increase academic success. It applies EDM techniques to an academic dataset provided by ISCTE-IUL information systems to unfold drivers for academic success. The resulting models’ performance is evaluated and its suitability to predict potential success and failure cases are scrutinized. A knowledge extraction process is conducted, and the collected insights used to formulate guidelines and suggestions regarding institutional policies and pedagogical approaches to improve academic success. On an Institutional and management level, the suggested guidelines are expected to leverage decision-making, optimize allocation of educational resources and increase overall institutional productivity.
2
2. Literature review
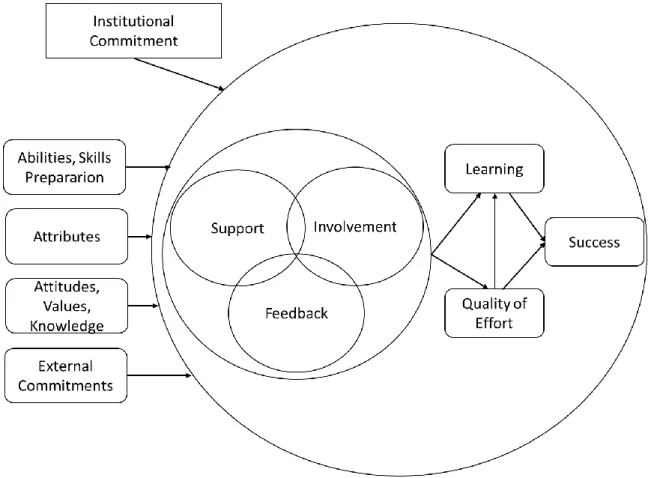
Nowadays, HEI are challenged to provide the best curricula and programs as well as potentiate all means available into success. Pressure is intense in a context where very high value is attached to credentials. In fact, academic success concerns not only students and institutional but also governments, higher education policymakers and leaders (Kahu & Nelson, 2018). Great importance is being given by higher education’ researchers to topics like student’s dropout, persistence, learning processes and success. Conceiving the academic success as a final goal of a long run with diverse challenges and checkpoints, we could think of persistence as an endurance capability, enabler of success. Vincent Tinto (1997, 2006) explored five conditions that higher educational institutes might meet to enhance student persistence and success: institutional commitment, institutional expectations, support, feedback, and involvement or engagement.
Involvement and engagement are concepts strictly related with persistence that deserve especial attention within the higher education research community. Academic and social integration is also a condition for student success (Astin, 2012; Tinto, 1997). Kuh et al. (2006) describe and operationalize the concept of academic and social integration in ways that can be reasonably measured. The more students are academically and socially involved, the more likely they are to persist and graduate. This is especially true during the first year of study, when student membership is so tenuous yet so critical to subsequent learning and persistence (Tinto, 1999). Vincent Tinto (2006) points out and articulates a set of institutional initiatives for student success and additionally presents an important and well accepted theoretical model for institutional action that leads to success in higher education. As per this study, students enter an institution with a variety of abilities, skills, levels of high education preparation, attributes (such as social class, age and gender), attitudes, values and knowledge about higher education. At the same time students participate in external commitments like (family, work, community) (Figure 1). These set of features is being used as root to correlation and patterns studies regarding academic success.
3
Figure 1 - Preliminary theoretical model for institutional action (source: adapted from Tinto, 2006: p. 9).
Academic success concept is being applied as a wrap-up definition that aggregates a multiple number of student and institutional outcomes. Success, in conceptual terms, remains universal in its appeal and motivation for attainment or achievement of a goal (Hannon et al., 2017). Research studies such as the ones by Parker et al. (2004) and Choi (2005) describe successful completion of course activities by students as ultimately improving students’ academic achievement, defining assessment as Grade Point Average (GPA). There are a vast number of other studies that defines academic success as academic achievement referring to Grades or GAP (e.g., Gore Jr., 2006; Tracey et al., 2012). Kuh et al. (2006) and York et al. (2015) adopted the Astin’s Inputs-Environments-Outcomes (IE-O) Model as the theoretical framework for their research, defining academic student success as the combination of the following factors: academic achievement, engagement in educationally purposeful activities, satisfaction, acquisition of desired knowledge, skills and competencies, persistence, attainment of educational outcomes, and post-college performance. The Astin model, first proposed in 1991 (Astin, 2012), clearly identifies academic success as an outcome of both input factors and the environment (Figure 2). The model also suggests that the environment functions as a mediator.
4
However, the relationship between environment and student outcomes cannot be understood without considering student inputs.
Figure 2 - Inputs-Environments-Outcomes (IE-O) Model (source: Astin, 2012).
Pascarella & Terenzini (2005) extended Astin’s framework by explaining higher education outcomes as functions of three sets of elements. The first set (inputs) is composed by demographic characteristics, family backgrounds, academic and social experiences that students bring to college. The second set (environment) encompasses people, programs, policies, cultures, and experiences that students encounter in HEI, whether on or off campus. The last set (outputs) includes students’ characteristics, knowledge, skills, attitudes, values, beliefs, and behaviours as these exist after graduation. Academic success research track, based on how students perceive their own success, as well as their peers’ success, has also gained some momentum recently. Students’ perceptions of success depend on each individual’s thoughts and beliefs. It is strongly influenced by the structures and cultures of the programs and demands of future occupation (Börjesson et al., 2016). Some relevant studies emphasize that successful students are described by their peers as those who achieve academic goals and at the same time are not apparently stressed by effort, still having time and energy for extra-academic activities and socializing. Nyström et al. (2013) coins this concept as ‘stress-less achievement’. Wood and Breyer (2017) argues that achievement factors are relevant and relatively easy to measure, but also offer limited insight into the complexities of student success.
York et al. (2015) states that the improper usage of academic success definition by the research community when research aim is just narrowed to a portion of that concept may result in findings and conclusions that are not generalizable. The literature review conducted by York el al. (2015) highlights grades and GPA as the most used measures of academic success, accounting at making academic achievement the most commonly assessed aspect of academic success within higher education research community.
5
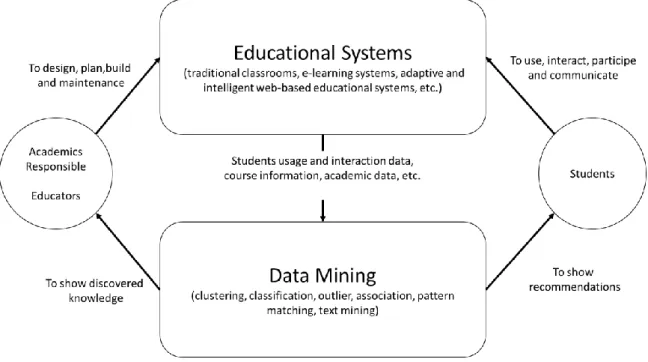
Assessments, as the main procedure for the measurement of studying outcomes, indicate the level of students' performance, which can be expressed qualitatively and quantitatively. According to Romero & Ventura (2007), the introduction of DM techniques in academic domains could improve decision-making processes in higher learning institutions. This improvement is expected to promote student’s retention, transition rate and academic success (Figure 3).
Figure 3 - Framework for data mining application in educational systems (source: adapted from Romero & Ventura, 2007: p 2).
EDM is a field that explores data-mining approaches and techniques on different types of educational data, aiming at solving problems within the educational context (Baker & Yacef, 2009). It concerns to better understand students and the settings in which they learn (Baker, 2010). Over the years, students’ enrolment and practicing in HEI has generated huge sets of student related data that may reflect the efficiency of the learning process (Koedinger et al., 2008). EDM seeks to use these data repositories to better understand learners and learning, and to understand patterns between academic features. Converting raw data originated by educational systems into useful information can potentially have a great impact on educational research and practice. Learning Analytics (LA) is an emerging technology-enhanced learning area based on online learning (Ferguson, 2012). Student’s behaviour and usage data collected through online learning framework are being used recently as data source for DM analysis. Regardless of the origin, all DM techniques show one common characteristic: automated discovery of new relations and dependencies between attributes in the observed data.
6
The replicable approach for systematic literature review based on empirical studies presented by Kitchenham et al. (2009) has been adopted to collect relevant EDM studies that set academic success as the main DM goal. Thus, the following research questions have been addressed (RQ): RQ1. How are DM researchers defining students’ success?
RQ2. What are the main input features that influence the most the students’ success?
A consolidated search strategy is crucial to assure the most relevant studies are retrieved during the search process (Santos et al., 2019). Therefore, 4 main search queries (SQ) have been designed by identifying the main academic success-related keywords in combination with the “data mining” term:
SQ1. “higher education success” AND “data mining” SQ2. “academic success” AND “data mining”
SQ3. “higher education performance” AND “data mining” SQ4. “academic performance” AND “data mining”
Each of these queries was executed on the following academic search engines since 2003: Google Scholar; ScienceDirect; Elsevier; ERIC; IEEEXplore. Searches were based on the title, abstract, and keywords (the sections that are indexed in most academic databases) and took place in July-August 2018. The collected knowledgebase was carefully reviewed and pruned, considering the following cumulative criteria (CC):
CC1. Clearly define academic success as the DM goal;
CC2. Clearly explore how DM model was defined and operationalized;
CC3. Present which input features were included in the model and resume their meanings; CC4. Explicitly define context and data volume.
After applying the above inclusion/exclusion criteria, the body of knowledge was reduced to forty-one references, from which twenty-one are conference proceedings and the remaining twenty are journal articles. These references cover a fifteen-year timeframe from 2003 to 2018 and have been published under Computer Science/ Information Systems and/or Education focused’ source titles (see Table A-1 in Appendix A for detailed stats). A few studies EDM literature review studies that identify current and future trends on the subject were also collected
7
during this research effort (Table A-2 in Appendix A details these studies on scope and contributions).
Table 1 characterizes the collect EDM studies on their main goals, the success metrics adopted, dataset volume, the number of features included in the model and the ones that influenced the most the success according to each study.
Academic success’ modelling is significantly affected by diverse factors, such as, higher educational context, educational system and its specificities, available data, data granularity and data quality. Other aspects such as problem and modelling decisions lead to distinct operationalization of success and how it is measured. Regarding datasets there is a great diversity in terms of source, nature and volume. The data source used for empirical studies is mostly originated through surveys to students and/or form the HEI database. There is a wide variety of explanatory features to be found in literature, some studies made use of only few dozen features, while others counted with many dozens or even hundreds of features. Further analysis has been conducted through collecting the most observed features and grouping them in five distinct clustering groups. The following features’ groups have been designed: socio-demographic features, social origin features, educational path features, previous education features and special statute features. Table 2 answers the following questions: which study includes each features’ group in its DM model? Which are the three most used features within each group? Thus, it is possible to verify that approximately three quarters of the studies includes two or more distinct groups’ representatives. By analysing each group share, it can be observed that more than three quarters of the studies include educational path features, more than two thirds include socio-demographic features and, approximately half include social origin features, previous education and special statute features. The importance of these feature’s groups is discussed in academic success research literature and its usage incidence in data mining studies can be explained through great part of these being extracted from data that is generally collected as a requirement for admission or enrolment process. Individual analysis points gender as the most frequently used feature in overall literature. Student’s behaviour and student’s commitment are good examples of unconventional features that can be found in literature as well.
Summing up findings regarding RQ1, it is possible to cluster student’s success operationalizations in the following main groups: passing grade in a specific module or course, passing grade in a specific exam, passing grade point average, student's graduation and student's
8
graduation with no failures. On RQ2, a wide spectrum of relevant explanatory features is observed, as there is a large number of distinct features pointed as the most relevant in the literature depending on each study’s characteristics. There is no standard in the used datasets, as each study relies on distinct sources. Note that each study relies on data collected from potentially distinct academic systems and contexts with its own specificities. Even so, the following features’ groups showed great impact on multiple studies: previous education features, educational path features and socio-demographic features.
9
Table 1 - Summary of the 41 reviewed studies. Reference Main Goal Success Measure Data Volume Nr.
Features Relevant dependent variables
Minaei-Bidgoli et al. (2003)
Predict students’ performance (Success). Identify students at risk.
Passing grade point average
Data set of 227 students who completed a homework set of 184 problems in LON-CAPA Web based system 10 Total_Correct _Answers Total_Number_of_Tries First_Got_Correct Time_Spent_to_Solve
Kotsiantis & Pintelas (2005)
Predict Students’ marks and performance.
Passing the module (Introduction to Informatics)
Data set of 354 student records from Introduction to Informatics module 16
4th written assignment 3rd written assignment 2nd written assignment 4th face to face meeting Gender
Superby et al. (2006)
Classify students at early stages into three groups of risk
Move on to next academic year
Data set of 533 first-year university students’
answers to 42 questions or question series.
375
High School last year’ GPA
Hours of mathematics in the last year of secondary education
Hours students admit to attending class Student’ confidence in his/her own abilities
Vandamme et al. (2007)
Predict academic performance of first-year students.
Classify students into groups of risk.
Passing grade point average
Data set of 533 first-year university
students’ surveys 25
Attendance of courses by students
Feeling of having made a good decision to enrol into the university
Romero et al. (2008a)
Compare several DM techniques for students' performance
classification based on e-learning data
Passing grade point average
Data set of 438 Cordoba University
students in 7 e-learning courses 11
Number of quizzes passed in e-learning framework
Some others that are not described in the article.
Romero et al. (2008b)
Classify students based on e-learning data and the final marks obtained in their respective courses.
Passing grade point average
Data set of 438 Cordoba University
students in 7 e-learning courses 11
Number of quizzes passed in e-learning framework Some others that are not described in the article.
Kabra & Bichkar (2011)
Predict the success (passing) of student in First Year of Engineering course.
Passing grade (final exam)
Data set of 346 first year of engineering students. University of Pune in Maharashtra, India
16
HSCCET - Marks obtained in common entrance test.
SSCBoard - State, CBSE
HSCPCM - Sum of Physics, Chemistry and Mathematics marks in HSC exam
Delen (2011) Developed analytical models to predict
Passing the first year in University
Data set of 25,224 students' records - 1999 - 2006 timeframe - public 39
Earned/Registered = EarnedHours/RegisteredHours FallStudentLoan
10
Reference Main Goal Success Measure Data Volume Nr.
Features Relevant dependent variables
freshmen student attrition.
university located in the mid-west region of the United States
ReceivedSpringAid AdmissionType Barber & Sharkey,
(2012)
Evaluate a likelihood of a given student
failing/passing the current course.
Passing the current course
Data set of working adult students
University of Phoenix, Arizona, USA. 24
Cumulative points earned (%) Points earned - prior courses (%) Ratio credits earned/attempted Point delta - prior courses >10%
Kovačić (2012)
Explore the profile of a student who successfully completes Information Systems course. Explore variables that influence persistence or dropout.
Students’ persistence and graduation
Data set of 450 New Zealand students enrolled to Information Systems course 9
Ethnicity
Course programme Course block Osmanbegović & Suljić
(2012)
Derive conclusions on students' academic success.
Passing grade at the exam (Business Informatics course)
Data set composed by Enrolment data and survey data collected from 257 students
12
GPA
Entrance Exam Study Material
Average Weekly hours devoted to studying
Watson et al. (2013)
Predict student’s performance based upon various aspects of their ordinary programming behaviour
Passing grade
Data set of 45 students who studied Introduction to Programming (IP) course. University of Durham, UK 2012/2013
5 types Programming behaviour features as a whole
Goker et al. (2013)
Apply data mining to improve an early warning system that may estimate the future academic success
Students' graduation Data set of 200 students' records 25
Student's 9th level grades Absenteeism Knowledge Book reading habits Test Anxiety
Primary school graduation certificate note Family income
Parents educational qualification
Mishra et al. (2014) Predict third semester performance
Third semester passing grade
Data set of 250 students' records collected from structured survey. Colleges affiliated to Guru Gobind Singh Indraprastha University, India
25
SECSEM - (% marks in 2nd Semester of MCA) GRAD - (% marks in Graduation)
Leadership
Drive - (Drive of the student)
Trstenjak & Donko (2014)
Predicting student success in Croatia using demographic features
Passing the first year in University - At least 42 ECTS at the end of the first year
Data set gathered from Croatian Information System of Higher Education Institutions (ISVU). Three years’ timeframe 2010- 2012
15
Average grade
Completed secondary school (the name of the secondary school that the student has completed)
Student rights (designation of student rights and subventions)
11
Reference Main Goal Success Measure Data Volume Nr.
Features Relevant dependent variables
Slim et al. (2014)
Predict the performance of students early in their academic careers
Passing grade point average
Data set of 115746 students' records. University of New Mexico, Mexico.
1 per prior
course Prior Courses Grades
Olama et al. (2014)
Validate if the UMN LMS data elements are suitable to predict students success in early stages
Passing the course
Data set collected from Moodle. University of Minnesota (UMN). 2009 - 2013 timeframe
10 Homework
Martínez & Gómez (2014)
Determine patterns of academic success and failure for students
Students' graduation
Data set of TSAP course student’s data. Institute of Curuzú, Cuatiá, Argentina. 2009-2013 timeframe
40
Type of residence (w/wo family) Student employment situation Weekly hours worked Relationship chosen career Parents educational qualification Priority assigned to the study Simeunović &
Preradović (2014)
Predict Students’ Performance. Analyse factors which affect levels of success.
Passing grade point
average Data set of 354 students' records 17
Importance of mark Duration of studying Attendance at tests Intellectual capability Natek & Zwilling
(2014)
Predict the success rate of
academic students Passing final grade
Data set of 74 students' records in Informatics. 2010/11 - 2011/2012 timeframe + 34 students' records in Informatics 2012/2013. 8 Type of studies Age Employment Type of study Mayilvaganan & Kalpanadevi (2014) Predict academic students' performance. Improve classic Prediction/ classification techniques used in EDM to predict academic performance
Very Good/ Good/ Medium Learner
Data set of 197 student's records. PSG College of Arts and Science College, Coimbatore, India
18 Not clear
Hu et al. (2014)
Predict student learning performance based on activities in a fully online course
Passing the online course
Complete learning portfolio data of undergraduate students. Information Literacy
and Information Ethics online course in a national university. 2009 - 2010 timeframe. 14 Course_LoginTime ReadTimeDOCCount Course_LoginAVGTime Taruna & Pandey
(2014)
Predict and classify students's marks in four distinct classes.
Student's graduation
Data set of 1000 undergraduate students' records. Engineering college in India.
11
Ag-g-7th - aggregate grades up to 7th semester Ag-g-3rd - aggregate grades up to 7th semester Backlogs
12
Reference Main Goal Success Measure Data Volume Nr.
Features Relevant dependent variables
Junco & Clem (2015)
Predicted final course grades using digital textbook usage metrics.
Passing course grade Data set of 233 students. Iowa State
University, USA 27 Number of days students spent reading
Cheewaprakobkit (2015) Classifying a group of student academic achievement. Analyse factors affecting academic achievement.
Passing grade point
average Data set of 1600 students' records 22 Number of hours worked per semester
Stretch et al. (2015)
Predict individual performance of students in courses. Explore factors associated with success and failure.
Approval for classification. Passing grade average points for regression.
Data set of 5779 student's course 14 Not clear
Zimmermann et al. (2015)
Predictive value of undergraduate level indicators for subsequent graduate level success
Student's graduation Data set of 171 student records in
computer science 81 Third-year GPA
Zhou et al. (2015)
Predict students' performance of offline courses from their access records on general websites.
Passing Grade
Data set of 195 students' academic data + their internet access and navigation logs.
16
Visiting frequencies on 14 selected categories of websites
Amount of time spent on online videos
Ahmad et al. (2015)
Predicting students’ academic performance of first year bachelor students in Computer Science course
Passing the first year in University
Data set of 399 students' records. UniSZA, Malaysia. 8 years’ timeframe 2006/2007 - 2013/2014 9 Not clear Amrieh et al. (2015) Predicting student's performance by including student's behaviour features Passing total grade/mark
Data set of 150 students' records collected from e-learning system that called Kalboard 360
11
Raised hand on class Visited resources Announcements view Discussion Groups Relation
You (2016)
Identify indicators using LMS data to predict course achievement in online learning
Passing grade
Data set of 530 online course students in Gachon University, Republic of Korea
6
Regular Study Late submission Sessions
13
Reference Main Goal Success Measure Data Volume Nr.
Features Relevant dependent variables
Badr et al. (2016)
Predict students's performance in a programming course based on their grades in other courses.
Passing grade in programming course
Data set of 203 graduate students. King Saud University (KSU). 2008‒2014 Timeframe
57 English course performance
Vuttipittayamongkol (2016)
Predict students' success by using three main features: activity hours, English scores, and number of students admitted
Students' graduation
Data set of undergraduate students' records. Mae Fah Luang University, Thailand. 1999-2014 timeframe.
3 main features groups
English I course performance
Daud et al. (2017)
Explore the impact of proposed features on student performance prediction
Students' graduation Data set of Around 700 students after
data cleansing 23
Family expenditure
Personal information features
Martins et al. (2017)
Explore Success Factors in Portuguese Higher Education
Students' graduation with no failures
Data set of 3000 students taken from
academic surveys 32
Characteristics of the educational institution Type of education
Field of education Age
Student's commitment
Schooling conditions at the starting point
Asif et al. (2017)
Predict performance and investigate how student's performance progresses during their studies
Students' graduation
Data set of 210 undergraduate students’ records enrolled in a 4-year Information Technology bachelor’s degree of a public engineering university in Pakistan
8
Pre-university marks 1st year courses' marks 2nd year courses' marks
Rahman & Islam (2017)
Study the impact of behavioural and student absent features on students' success
Passing performance
Data set called Student’s Academic Performance data set’ collected from e-learning system that called Kalboard 360. Comprises 480 instances
16
Absent days in class
Behaviour features (such as raise hand on class, resource review, and group discussion etc.
Leppanen et al. (2017)
Study the impact of material usage on students' success
Passing grade in introduction to programming course
Data set of 271 students' records collected using a client-side data gathering component applied to e-learning content for Introduction to programming course. University of Helsinki
Not clear Element-level usage
Kostopoulos et al. (2018) Estimate students’ academic success in a web-based university course combining
Passing the module (Introduction to Informatics)
Data set composed by a total of 3882 instances. Introduction to informatics
17
Type of employment New student
OCS2, OCS4 and OCS5 (students’ presence in the optional contact sessions
14
Reference Main Goal Success Measure Data Volume Nr.
Features Relevant dependent variables
classification and regression rules
module of the computer science course. Three years’ timeframe (2008–2010)
WR1, WR2, WR3 (students’ grades in the written assignments)
Martins et al., (2018)
Predict the undergraduate academic performance of students from a
Portuguese higher education institution
Students' graduation
Data set of 2159 students' records. Distinct bachelor’s degree programmes in a Portuguese higher education institute. 2007 - 2015 timeframe 50 Ects_reprov_s Media_s Cod_escola Ects_aprov_s Ects_cred_tx Navalr_s Cod_curso Max_s Nível_esc_mae Ano_s Ano_mat Fernandes et al. (2018) Predict whether a student will pass/fail at the end of the school year.
Passing at the end of the school year
Data set of 238,575
records in 2015 and 247,297 records in 2016 - Public universities in Brasília district, Brazil 17 Grade Neighborhood School School_subjects Absence City Age
15
Table 2 – Features’ groups used in EDM literature. Research Studies F ea tures M in ae i-Bid g o li et al. ( 2 0 0 3 ) Ko tsian ti s & P in tela s (2 0 0 5 ) S u p er b y e t al. (2 0 0 6 ) Va n d am m e et al. (2 0 0 7 ) Ro m ero e t al. ( 2 0 0 8 a) Ro m ero e t al. ( 2 0 0 8 b ) Ka b ra & Bich k ar (2 0 1 1 ) De len (2 0 1 1 ) Ba rb er & S h ark ey , (2 0 1 2 ) Ko va čić (2 01 2) Os m an be go vić & S ulj ić ( 20 12 ) Watso n e t al. (2 0 1 3 ) Go k er et al. ( 2 0 1 3 ) M ish ra e t al. ( 2 0 1 4 ) Trsten jak & Do n k o (2 0 1 4 ) S li m e t al. ( 2 0 1 4 ) Ola m a et al. (2 0 1 4 ) M artí n ez & Gó m ez (2 0 1 4 ) S ime un ov ić & P re ra do vić ( 20 14 ) Na tek & Zwil li n g (2 0 1 4 ) M ay il v ag an an & Ka lp an ad ev i (2 0 1 4 ) Hu e t al. ( 2 0 1 4 ) Taru n a & P an d ey ( 2 0 1 4 ) Ju n co & Clem (2 0 1 5 ) Ch ee wa p ra k o b k it ( 2 0 1 5 ) S tretc h e t al. ( 2 0 1 5 ) Zi m m erm an n e t al. (2 0 1 5 ) Zh o u e t al. ( 2 0 1 5 ) Ah m ad e t al. (2 0 1 5 ) Am rieh e t al. (2 0 1 5 ) Ba d r et al. (2 0 1 6 ) Yo u ( 2 0 1 6 ) Vu tt ip itt ay am o n g k o l (2 0 1 6 ) Da u d e t al. ( 2 0 1 7 ) M arti n s e t al. ( 2 0 1 7 ) As if et al. (2 0 1 7 ) Ra h m an & Isla m (2 0 1 7 ) Lep p an en e t al. ( 2 0 1 7 ) Ko sto p o u lo s e t al. (2 0 1 8 ) M arti n s e t al. ( 2 0 1 8 ) F ern an d es e t al. ( 2 0 1 8 ) T o ta l SD X X X X X X X X X X X X X X X X X X X X X X X X X X X X 2 8 Gend er X X X X X X X X X X X X X X X X X X X X X X X X X X X X 2 8 Age X X X X X X X X X X X X X X X X X X X 1 9 Marit al Statu s X X X X X X X X X X X X X 1 3 Othe r X X X X X X X X X X X X X X X X X X X X X X X 2 3 SO X X X X X X X X X X X X X X X X X 1 7 Pare nts' Educ ation X X X X X X X X X 9 Pare nts' X X X X X X X X X 9
16 Occu patio n Num ber of Hous ehold Mem bers X X X X X 5 Othe r X X X X X X X X X X X X X X X X 1 6 EP X X X X X X X X X X X X X X X X X X X X X X X X X X X X X X X X 3 2 Cou rse X X X X X X X X X X X X 1 2 Deg ree Typ e X X X X X X X X X 9 HEI Typ e X X X X X X 6 Othe r X X X X X X X X X X X X X X X X X X X X X X X X X X X X X X 3 0 PE X X X X X X X X X X X X X X X X X X X 1 9 Entr y Exa ms X X X X X X 6 Entr y Gra de X X X X X X X X X 9 Entr y Exa ms Gra de X X X X X 5
17 Othe r X X X X X X X X X X X X X X X X X X 1 8 SS X X X X X X X X X X X X X X X X X X X 1 9 Socia l Servi ces X X X X X X X 7 Scho larshi p X X X X X X X X 8 Wor king Stud ent X X X X X X X X X X X X X 1 3 Othe r X X X X X X X X X X X X 1 2 Tot al 1 2 5 5 1 1 4 4 5 3 4 1 4 5 4 1 1 4 1 2 4 1 3 3 4 2 2 1 4 2 1 1 1 4 5 2 3 1 4 5 4
18
3. Materials and methods
Cross-Industry Standard Process for Data Mining (CRISP-DM) is the methodology implemented in this study. It is the most adopted methodology within DM’ research domain and was designed to be applied in real-world business cases, helping to support business decisions and increasing DM projects’ success. It defines a project as a cyclic process and applies a non-rigid sequence of six main stages (Chapman et al, 2000). As a flexible methodology, CRISP-DM allows and encourages iterative process, so it is a common practice to move back and forth between distinct stages promoting final DM results. CRISP-DM main stages are business understanding, data understanding, data preparation, modelling, evaluation and deployment (Shearer, 2000). As described in Chapman et al. (2000) the first three main stages are critical for the DM study’s success and it is where the main implementation’s effort and focus are required. R tool is an open source programming language and environment for statistical and data analysis. It is highly extensible and flexible, counting with a great variety of libraries and packages. There is a dynamic and enthusiastic DM research community, supporting and adopting R on their research studies. This study bases on R tool to apply CRISP-DM methodology. According to Roy & Garg (2017), R tool alongside with WEKA, is the most adopted tool in EDM literature. Furthermore, Rminer library, as an integrated R tool framework is used to implement complex DM analysis though an extensively documented set of functions (Cortez, 2010).
3.1. Domain understanding and data mining problem definition
ISCTE-IUL is a public HEI located in Lisbon, Portugal. It was established in 1972 and currently counts with approximately, 9000 students enrolled in undergraduate (46%) and postgraduate (54%) programmes, 450 teachers and 220 non-teaching staff. ISCTE-IUL provides 89 distinct degree programmes through the following school, i.e., study areas: Business, Sociology and Public Policy, Social Sciences, Technology and Architecture. Fénix@ISCTE-IUL (Fénix) is the information system adopted by ISCTE-IUL to manage educational processes. It allows candidates, students, teaching and non-teaching staff to have on-line access to services provided by ISCTE-IUL. Admission process management, applications and programme enrolments, academic path and evaluation monitoring are some critical features provided by Fénix. As part of the information process, Fénix manages and stores highly relevant academic-related data. It
19
sets the data source used in this study. This data was provided by the Information Systems Department of ISCTE-IUL and have been anonymised before being exposed for analysis. This procedure ensures that students is no longer identifiable through the provided dataset.
Business Understanding is CRISP-DM’s kick-off stage and is based on understanding the domain and requirements from a business perspective and defining the main DM goal. Preliminary understanding efforts showed that is critical for HEI purposes, to maximize academic success rate. Thus, the ability to detect potential failures and dropouts, in early stages, assumes great importance to educational stakeholders. Understanding that ISCTE-IUL is interested to promote student’s success, it is critical to focus on potential unsuccessful students. Therefore, a-priori detection of failures is set as a success enhancement feature for HEI. As important as its predicting capacity, the DM model, needs to be suitable for ISCTE-IUL to apply success enhancement actions in time to prevent failures. Thus, the earlier in the academic path, the DM model could predict failures, avoiding a high level of incorrectly predicted cases (false positives), the better.
As discussed in previous section, each EDM’s approach depends on each specific higher educational system and the academic dataset it relies on, among other significant context characteristics. It leads studies to distinct dependent variable operationalization and how it is measured. This study adopts student's graduation with no failures as student’s success operationalization. Thus, DM’s goal and the main analysis’ subject are devoted to predicting students that would not complete their degree’s programme within the optimal number of curricular years. In other words, students that fails and/or repeats at least one curricular year. This study follows a classification DM approach, as it builds a predictive model that classifies a data record into one of two predefined classes. Predefined classes used for success are “Failure” and “Success”.
3.2. Unfolding a higher education institution database
Data understanding stage is composed by data obtaining, data describing, data exploring and initial data quality review tasks. Academic dataset collected by Fénix set up the data source for this study’s DM model. Fénix was implemented in 2008 and imported historical data from previous information systems. Its database uses a relational model composed by SQL tables. Among these tables there are a dozen main tables, covering candidacy, registration, enrolment,
20
evaluation, statutes and social services data mostly. A dozen lookup and matching tables are also provided, supporting data understanding and data quality tasks (see Figures B-1 and B-2 in Appendix B for data source model). There are three main tables within data source that defines student-HEI relationship: Person, Candidacy and Registration tables. Person table stores general student’s data as socio-demographic and social origin data and new records are inserted during the admission process. Candidacy table stores data regarding student’s candidacy to a degree provided by ISCTE-IUL. Note that the relationship between these two tables allows multiple candidacies to a single person. For instance, a student that interrupts and is transferred to a distinct degree, or a student that completes a bachelor’s degree and apply for a master’s degree, are some good examples. Registration table establishes the relationship between Candidacy table and relevant tables, such as, evaluations, courses and statutes related tables. It stores the current registration state that indicates whether the student completed registration’s related degree.
After an initial data exploring process and stepping back to revisit DM goal’s operationalization, it was detected that degree’s standards have changed through time, such as the case of, Pre-Bologna and Post-Bologna process’ degrees. Encompassing 1978/1979 to 2018/2019 curricular timeframe, the dataset includes both standards as well as the transition period. DM goal’s operationalization may ensure that each subject of the prediction is comparable and defined through a well-identified characterization set for each feature. Pre-Bologna and Post-Pre-Bologna degrees are not comparable in terms of the adopted goal operationalization, as they differ in success premises and conditions, for instance, different curricular years’ total. As per the same rational, bachelor’s degree, master’s degree and PhD’s degree are not comparable as well. ISCTE-IUL implemented Bologna process in the curricular year of 2006/2007 and it is still currently in place. Priority criteria, such as, current higher education process and most recent and higher quality data, set up bases for selecting the subset of data to be used in this study. Accordingly, the original dataset was reduced to Bologna bachelor’s degrees related records. General case, Bologna process sets a programme of 3 curricular years for bachelor’s degrees, through which, passing all curricular courses, the student earns 180 ECTS (European Credit Transfer scale), completing it. Considering these premises and DM goal’s operationalization, 2016/2017 to 2018/2019 entry curricular years’ data were removed from the analysis, as it is not possible to calculate these cases’ success. Another important issue is student’s mobility within HEI, as students can be transferred from a HEI to another HEI. Most of the times transferred students can keep earned ECTS and
21
completed courses' evaluation. In these specific cases, it is not possible to guarantee success operationalization requirements as available data source doesn't provide information originated or collected by other HEI. This limitation forces transferred students’ data to be excluded from the analysis.
Summing up decisions at this point, this analysis will be focused on bachelor’s students who effectually enrolled a programme provided by ISCTE-IUL, between 2006/2007 and 2015/2016 (10 years’ timeframe). This ensures success operationalization requirements to be met. Further data review revealed that, even being considered Bologna process’s degrees, IGE and IGE-PL set a 4 curricular years’ programme, so a similar analysis is conducted separately for these specific degrees. A further modelling and comparative analysis are performed to review features’ relevance between regular bachelors and 4-years bachelors.
After redefining DM’ requirements, an initial analytical base table (ABT) is created to aggregate features’ candidates, originally spread among distinct tables of the relational database model. ABT is a flat table used for building analytical models, such as DM models. Each ABT’s record represents the subject of the model and stores feature’s data representing the subject. ABT records are set at registration level, so further data quality tasks and computed measures are designed ensuring registration’s granularity. Table 3 summarizes the first ABT version composed by thirty-two features, by features’ group, origin and main source table. Note that this initial gathering, are composed by multiple representatives for each of the five features’ groups reviewed on literature (see Table C-1 in Appendix C for detailed feature’s description and their classes).
Table 3 - First ABT version.
Feature Features' Group Origin Source Table
Area Socio-demographic Extracted
Person
areaCode Socio-demographic Extracted
Gender Socio-demographic Extracted
yearOfBirth Socio-demographic Extracted
fatherOccupation Social Origin Extracted
motherOccupation Social Origin Extracted
fatherOccupationConditionType Social Origin Extracted
motherOccupationConditionType Social Origin Extracted
Occupation Socio-demographic Extracted
iscteFirstExecutionYear Educational Path Extracted
maritalStatusType Socio-demographic Extracted
Nationality Socio-demographic Extracted
22
Feature Features' Group Origin Source Table
entryYear Educational Path Extracted
fatherLiteraryHabilitationType Social Origin Extracted
motherLiteraryHabilitationType Social Origin Extracted
workingStudentAtEntry Special Statute Extracted
Person Special Regime
partialTimeStudentAtEntry Special Statute Extracted
specialEducationNeedsAtEntry Special Statute Extracted
scholarshipAtEntry Special Statute Extracted
dislocatedAtEntry Special Statute Extracted
degreeCode Educational Path Extracted
Candidacy
degreeType Educational Path Extracted
degreeSchool Educational Path Extracted
entryGrade Previous Education Extracted
precedentDegreeDesignation Previous Education Extracted
precedentConclusionYear Previous Education Extracted
secondarySchoolType Previous Education Extracted
Ingression Previous Education Extracted
highSchoolDegreeType Previous Education Extracted
iscteWasFirstChoice Previous Education Extracted
erasmusOutgoing Educational Path Extracted Outgoing
Mobility
Further data exploring efforts showed up a great number of new potential feature’s candidates. There are student statutes and social services data to be found, stored by curricular semester and curricular year, respectively. This data relates to special statute features’ group and the way it is stored allows special statute’ time-based features to be created. Thus, fifty-four derived features total were created at this stage, a single feature per student statute by first curricular year’s semester and a single feature per social service by first curricular year. Social services features were also split in two categories: accepted and requested. A requested social service doesn’t mean that it has been accepted, so it adds extra detail to the analysis. Note that, as discussed in the beginning of this section, early-stage prediction is one of the main motivations for this study, so no data collected after the first curricular year are considered for feature’s gathering purposes. In other words, features’ gathering concentrates in freshmen characteristics’ scrutiny. Table 4 reviews new derived features added to ABT (see Table C-1 in Appendix C for detailed feature’s description and resultant classes).
23
Table 4 - Additional derived features included in ABT.
Feature Features' Group Origin Source Table
workingStudentEntryYear1stSem Special Statute Derived
Student Statutes
InternationalStudentEntryYear1stSem Special Statute Derived
partialTimeStudentEntryYear1stSem Special Statute Derived
fctgrantOwnerEntryYear1stSem Special Statute Derived
classSubRepresentativeEntryYear1stSem Special Statute Derived
classRepresentativeEntryYear1stSem Special Statute Derived
handicappedEntryYear1stSem Special Statute Derived
pregnantOrChildrenUnder3EntryYear1stSem Special Statute Derived
professionalAthleteEntryYear1stSem Special Statute Derived
sasGrantOwnerEntryYear1stSem Special Statute Derived
militaryEntryYear1stSem Special Statute Derived
temporaryDisabilityEntryYear1stSem Special Statute Derived
religiousEntryYear1stSem Special Statute Derived
associativeLeaderEntryYear1stSem Special Statute Derived
iscteAthleteEntryYear1stSem Special Statute Derived
firefighterEntryYear1stSem Special Statute Derived
erasmusGuestEntryYear1stSem Special Statute Derived
deathOfSpouseOrFamilyEntryYear1stSem Special Statute Derived
appearancePoliceOrMilitaryAuthorityEntryYear1stSem Special Statute Derived
monitorEntryYear1stSem Special Statute Derived
previousIBSStudentEntryYear1stSem Special Statute Derived
top15IBSEntryYear1stSem Special Statute Derived
workingStudentEntryYear2ndSem Special Statute Derived
InternationalStudentEntryYear2ndSem Special Statute Derived
partialTimeStudentEntryYear2ndSem Special Statute Derived
fctgrantOwnerEntryYear2ndSem Special Statute Derived
classSubRepresentativeEntryYear2ndSem Special Statute Derived
classRepresentativeEntryYear2ndSem Special Statute Derived
handicappedEntryYear2ndSem Special Statute Derived
pregnantOrChildrenUnder3EntryYear2ndSem Special Statute Derived
professionalAthleteEntryYear2ndSem Special Statute Derived
sasGrantOwnerEntryYear2ndSem Special Statute Derived
militaryEntryYear2ndSem Special Statute Derived
temporaryDisabilityEntryYear2ndSem Special Statute Derived
religiousEntryYear2ndSem Special Statute Derived
associativeLeaderEntryYear2ndSem Special Statute Derived
iscteAthleteEntryYear2ndSem Special Statute Derived
firefighterEntryYear2ndSem Special Statute Derived
erasmusGuestEntryYear2ndSem Special Statute Derived
24
Feature Features' Group Origin Source Table
appearancePoliceOrMilitaryAuthorityEntryYear2ndSem Special Statute Derived
monitorEntryYear2ndSem Special Statute Derived
previousIBSStudentEntryYear2ndSem Special Statute Derived
top15IBSEntryYear2ndSem Special Statute Derived
requestedSocialServiceEntryYear Special Statute Derived
Social Services
acceptedSocialServiceEntryYear Special Statute Derived
requestedSStransportSupplementEntryYear Special Statute Derived
requestedSSaccommodationSupplementEntryYear Special Statute Derived
requestedSSresidenceRequestEntryYear Special Statute Derived
requestedSSiscteFinantialSupportEntryYear Special Statute Derived
acceptedSStransportSupplementEntryYear Special Statute Derived
acceptedSSaccommodationSupplementEntryYear Special Statute Derived
acceptedSSresidenceRequestEntryYear Special Statute Derived
acceptedSSiscteFinantialSupportEntryYear Special Statute Derived
Further data understanding effort exposed potential features based on pre-existing data. According to Barraza et al. (2019), feature engineering is key for data mining, Therefore, new features were designed applying non-straightforward logic, requiring distinct transformation, aggregation or/and calculation processes. These new set of features are labelled computed features due to the processes involved in their creation.
Candidacy preference related-table details higher education candidacy process. Each table’s record specifies a candidacy preference by its order, HEI and degree, and stores the whole set of student’s entry exams and respective grades. Portuguese higher education admission process allows a student to choose up to six candidacy preferences, that results in multiple records, per student. Therefore, five new computed features, encompassing previous education features’ group, were designed for candidacy preference. Four of those, considering the relationship between student’s preference, HEI and degree student ended up registering, and a fifth one for entry exams grades average. For instance, new computed feature, orderPreference, represents the order in which student has chosen HEI and degree he ended up registering.
Student’s evaluation related data is stored by course and curricular semester. Evaluation records are updated each time there is an attempt to complete a specific course or improve its grade, reflecting its most recent state. Thus, new computed evaluation related features were designed, comprising overall evaluation by each semester of the first curricular year. Each course set up its ECTS, so each time a student achieves a passing grade in a specific course, its correspondent ECTS amount is earned. It is important to note that single course’s analysis is not possible, as
25
each degree sets its specific programme, composed by distinct courses’ set. Thus, six new computed educational path features are designed for student’s evaluation. For instance, new computed feature, ectsCreditsEntryYear1stSem represents the total amount of ECTS earned in the first curricular semester. It is important to detail that weighted average features were calculated relying on the premise that 30 ECTS are the optimum amount of ECTS to be collected per semester. It is an approximate value, set for comparable analysis, as it is possible for students to earn more than 30 ECTS per semester. For instance, a student that passes all current semester courses and a pending previous semester course, will exceed 30 ECTS. Additional computed features representing, student’s age at entry, study gap time between precedent and current educational degree, and student’s residence location are also developed. Residence location features are calculated by integrating Postal Code database1, provided by the Portuguese Postal Office (CTT). This is public-domain data covered by Open Data Commons Public Domain Dedication and License (PDDL). This information set up lookups for location data to be represented in distinct aggregation levels, best suited for DM.
Table 5 represents computed features added to ABT (see Table C-1 in Appendix C for detailed feature’s description and resultant classes)
Table 5 - Additional computed features included in ABT.
Feature Features' Group Origin Source Table
firstChoice Previous Education Computed
Candidacy Preference
firstChoiceUniversity Previous Education Computed
firstChoiceCourse Previous Education Computed
orderPreference Previous Education Computed
gapEntryExames Previous Education Computed
entryAge Educational Path Computed
Person
entryAgeRange Educational Path Computed
municipality Socio-demographic Computed
district Socio-demographic Computed
lisbonMetropolitanArea Socio-demographic Computed
studyGap Previous Education Computed
Candidacy
studyGapYears Previous Education Computed
ectsCreditsEntryYear1stSem Educational Path Computed
Enrolment
ectsCreditsEntryYear2ndSem Educational Path Computed
averageEntryYear1stSem Educational Path Computed
weightedAverageEntryYear1stSem Educational Path Computed
averageGradeEntryYear2ndSem Educational Path Computed
1 Available for download from CTT website: