M
ASTERS
F
INANCE
M
ASTERS
’
F
INAL
W
ORK
P
ROJECT
IS GOLD A HEDGE? THE RELATION BETWEEN GOLD AND SHARES
RICARDO CLÁUDIO GOMES
M
ASTERS IN
F
INANCE
M
ASTERS
’
F
INAL
W
ORK
P
ROJECT
IS GOLD A HEDGE? THE RELATION BETWEEN GOLD AND SHARES
RICARDO CLÁUDIO GOMES
S
UPERVISION:
R
AQUELM.
G
ASPARResumo
Num período em que uma estratégia de investimento cuidadosa e diligente é cada vez mais necessária, o hedging é uma poderosa ferramenta que pode ser usada pelos investidores com o propósito de reduzir os riscos associados aos investimentos no mercado de ações. Este projecto tem como objectivo estudar a correlação entre os retornos do ouro e os retornos das ações, com o intuito de descobrir se o ouro pode ser considerado um hedge para as ações ou um safe haven.
Os resultados do uso de um modelo econométrico, baseado em dados de alguns dos maiores índices a nível mundial e de um índice de rastreamento de referência para futuros de ouro, para o período de Janeiro de 1996 até Dezembro de 2015, sugerem que o ouro não é um hedge para qualquer dos mercados de ações analisados, ainda que aparente ser um forte safe haven sobre condições extremas de retornos negativos do mercado de ações. Ainda assim, é demonstrado que os resultados do modelo econométrico estão dependentes do período analisado.
Palavras-chave: Hedge, Safe Haven, Correlação Classificação JEL: G11
Abstract
In a period where careful and diligent investing is increasingly required, hedging is a powerful weapon that can be used by investors in order to reduce the risks associated with stock market investments. This project aims at studying the correlation between gold returns and stock returns, intending to find out if gold can be considered a hedge for stocks or a safe haven.
The results of the use of an econometric model, based on data from some major worldwide stock indexes and a benchmark tracking index for gold futures, regarding the period from January of 1996 until December of 2015, suggest that gold is not a hedge for any of the stock markets under analysis but it appears to be a strong safe haven under extreme negative stock market conditions. However, it is shown that the results from the model are dependent on the period analysed.
Keywords: Hedge, Safe Haven, Correlation JEL Claassification: G11
List of Abbreviations US – United States UK – United Kingdom USD – United States Dollars EUR – Euros
S&P – Standard & Poors
MSCI – Morgan Stanley Capital International GSCI – Goldman Sachs Commodity Index COMEX – Commodity Exchange
NBER – National Bureau of Economic Research ETF – Exchange Traded Fund
ARCH – Autoregressive Conditional Heteroskedasticity
GARCH – Generalized Autoregressive Conditional Heteroskedasticity Std. Dev. – Standard Deviation
Table of Contents Resumo Abstract List of Abbreviations Table of contents List of Tables List of Figures 1. Introduction 2. Literature Review 3. Data and Methodology 4. Results 5. Conclusion 6. References Appendix i ii iii iv vi vii 1 4 7 15 31 33 35 iv
List of Tables
Table 1 – Descriptive statistics of the indexes daily returns (01/01/1996 – 31/12/2015)
Table 2 – Descriptive statistics of the Euro Stoxx 50 returns and of the USD/EUR exchange rate (01/01/1996 – 31/12/2015) Table 3 – Estimation results from the econometric model ((01/01/1996 – 31/12/2015)
Table 4a – Correlation matrix of the indexes daily returns (01/01/1996 – 31/12/2015)
Table 4b – Correlation matrix of the indexes daily returns in the first recession period (15/03/2001 – 15/11/2001)
Table 4c – Correlation matrix of the indexes daily returns in the second recession period (15/12/2007 – 15/06/2009)
Table 5a – Estimation results from the econometric model (01/01/1996 – 31/12/2002)
Table 5b – Estimation results from the econometric model (01/01/2003 – 31/12/2009)
Table 6 – Mean daily returns of the S&P GSCI Gold during the sample period and also during the recession periods
Table 7 – Annual mean returns, standard deviation and Sharpe ratio analysis (01/01/1996 – 31/12/2015)
Table 8 – Descriptive statistics of the indexes returns (01/01/2016 – 30/06/2016) 11 13 14 17 18 19 20 22 23 24 27 III v
Table 9 – Correlation matrix of the indexes daily returns (01/01/2016 – 30/06/2016)
Table 10 – Estimation results from the econometric model (01/01/2016 – 30/06/2016)
28
29
List of Figures
Figure 1a – Stock indexes and gold index prices, in a linear scaler scale (01/01/1996 – 31/12/2015)
Figure 3a – Stock indexes and gold index prices, linearized (01/01/2016 – 30/06/2016)
Figure 1b – Stock indexes and gold index prices, in a logarithmic scale (01/01/1996 – 31/12/2015)
Figure 1c – Stock indexes and gold prices, linearized (01/01/1996 – 31/12/2015)
Figure 2a – S&P 500 daily returns (01/01/1996 – 31/12/2015) Figure 2b – Euro Stoxx 50 daily returns (01/01/1996 – 31/12/2015)
Figure 2c – MSCI World Index daily returns (01/01/1996 – 31/12/2015)
Figure 2d – S&P GSCI Gold Index daily returns (01/01/1996 – 31/12/2015)
Figure 3b – Stock indexes and gold index prices, in a linear scale (01/01/2016 – 30/06/2016) 9 26 35 36 37 37 38 38 39 vii
1. Introduction
Gold demand worldwide currently exceeds its total production. It is one of the most requested precious metals and one of the main ends of newly produced gold, alongside jewerly, is investment. But why do investors seek for gold? A probable cause may be the fact that some investors see gold as an optimal long-term investment, as reported by Saad (2012), but it can also be for the reason that they believe it can be used to reduce portfolios’ losses by hedging against adverse movements in the price of financial assets. According to Ratner and Klein (2008) investing in gold produces inferior returns to a simple buy-and-hold strategy of U.S. stocks in the long term. However, the authors state that investors believe it can provide some protection to the unstable stock market, given its low correlation with equities.
The main purpose of investing in stock markets is to earn returns. Nevertheless, stocks are a risky security and, therefore, investors and managers need to worry not only about the returns but also about the level of risk they put their money or their clients’ money into. It is difficult to keep earning money every day in the stock market, since a day of rising stock prices can be followed by a day of declines in those same stock prices, making markets arguably unpredictable. According to Campbell et al. (2001) there is even a positive trend in idiosyncratic firm-level volatility. Therefore, by diversifying their portfolios, investors are able to better protect themselves against adverse moves in financial markets, by reducing or even eliminating the unsystematic risk of the financial assets included in the portfolios. This can be done by including a great variety of assets in the portfolio in order to be less vulnerable to a specific asset or asset class risk. A strategy like this can only be performed if the securities are not perfectly positively correlated.
Through hedging, investors not only reduce their potential losses but also their possible profits. In other words, hedging is the act of trying to protect some asset by acquiring an offset position in a related security that allows for a reduction of risk, shrinking the potential losses of the asset and diminishing, consequentially, its potential profits. It is usually realized through the use of derivatives but it can also be achieved by diversification, which can lower the costs of the strategy as well as its complexity. A
hedging instrument should be a security that is, on average, uncorrelated or negatively
correlated with the security for which we wish to hedge against and the main purpose of this study is to verify if gold has that property relatively to stocks. If gold would be uncorrelated with stocks, it means that a movement in the stock prices would have no impact in the gold price, while if a negative correlation was the case, it would mean that, most of the times, if the stock prices increase (decrease), the gold prices would experience a decline (rise). Basically, if they these two markets were to be negatively correlated they would move in opposite directions.
Sometimes gold is also referred to as a safe haven, which can be defined as an asset, usually liquid, that is expected to maintain or even increase its value in times of market downfalls, which can limit the investor’s exposure to losses under those specific market conditions. Market downfalls are periods of recession or bear markets in which the stock market yields negative returns, on average. In order to be considered a safe haven, gold should be uncorrelated or negatively correlated with stocks in periods of stock market disturbance. It should be noted that an instrument that is considered a safe haven in a certain period may not be able to have those characteristics in a different one, as a result of changes in the market environment.
It can be the case that gold is neither a hedge nor a safe haven, having a positive correlation with the stock market. However, if it can still reduce the risk a stock portfolio, by decreasing its unsystematic risk, gold can be considered a diversifier. In order for that to be true, the correlation must not be perfectly positive, as mentioned above. The further away from one the correlation between gold and stocks is, the more powerful the diversification is. This way, if the stock market suffers a loss, an investor might be compensated by the gold market and vice-versa.
In this study I use a twenty year period to examine the relationship between gold and stocks. I opt to choose three very large stock indexes: the S&P 500, the Euro Stoxx 50 and the MSCI World index. This way, the study is not just dedicated to the correlation between gold and some particular country, but it is also focused on the correlation between gold and most of the developed economies in the world. It is also the first study in this field that I am aware of that involves the post latest financial crisis period, in which gold has seen its highest and fastest rise in its price level but also, afterwards, its longest period of price decline.
Regressing gold’s daily returns on stocks’ daily returns for each of the indexes produces results that differ from some previous studies in the sense that gold is not a hedge for any of these indexes, even though it has the capacity to be a safe haven when the stock market yields its lowest returns.
The paper starts with the review of some previous studies and its findings, followed by a descriptive examination of the data, before proceeding to the analysis of the results of the econometric model and its conclusions.
2. Literature Review
One of the main previous studies in this field is that of Baur and Lucey (2009) in which the authors tested the existence of the hedge or safe haven properties of gold in relation to the US, UK and German stock markets, as well as for bonds. They find that gold is a hedge against stocks on average and a safe haven in extreme stock market conditions. They also reveal that this safe haven property is particularly short-lived, so that an investor that buys gold a day after a shock loses money. It follows that gold acts as a safe haven only for a limited period of time (about 15 days) and loses this attribute in the long-run, according to their study.
In another study, Baur and McDermott (2010) state that gold typically generates positive returns throughout periods of economic downturns, providing investors some certainty during periods of market agitation. The authors affirm that gold is both a hedge and a safe haven for major European stock markets and the US but not for many other developed countries and emerging economies. They also document that since July 2007 until September 2009, during the financial crisis, the nominal gold price has risen 42%, which led to an increase in its demand about 64% in just 2008, with ETF’s and similar products assuming a vital role.
Using the same methodology, Hood and Malik (2013) find that gold, contrasting to other precious metals, acts as a hedge and a weak safe haven for the U.S. stock market. Yet, during periods of low and high volatility gold does not possess a negative correlation with the U.S. stock market, according to the authors.
Also Mulyiadi and Anwar (2012) find that gold, besides being a hedge and a safe haven, in extreme stock market conditions, is also a good diversifier and a safe asset for investors. They state that when the stock market is down, gold tends to increase its
value, whereas if gold returns are increasing, it has a linear impact on the stock markets returns.
This diversification feature of gold may turn out of major importance as, according to Goetzmann and Kumar (2008), investors are still under-diversified despite from the fact that the most rational models of portfolio choice support the fact that investors should hold diversified portfolios in order to decrease or even eliminate the idiosyncratic risk. Belousova and Dorfleitner (2012) support that idea in stating that diversifying with precious metals can be very useful for investors as it can not only reduce portfolio risk but also enhance the returns, either with the physical commodities or with futures contracts on the commodities.
In a study conducted by Coudert and Raymond (2011) they find that gold can be considered a safe haven, since it does not co-move, on average, with stocks returns, neither during recessions nor bear markets. It also seems to perform as a hedge against stocks in the majority of international markets under analysis. In any case, it appears to be an interesting asset to diversify stock portfolios, particularly in periods of bear market.
However, Ciner et al. (2013), using a dynamic correlation approach, reach to opposite conclusions, in the sense that gold does not act has a safe haven for equities. In their personal opinion, this may be a result of the fact that their data is more recent and includes a period where gold has increased its own valuation.
Lawrence (2003) concludes that gold is much less affected by macroeconomic variables than other commodities are and that returns on gold are less correlated with returns on equity and bond indices than are returns on other commodities.
5 6
These conclusions are similar to the ones reached by Hillier et al. (2006) that suggest gold has low correlations with stock index returns which can make it a good diversifier, while having some hedging capability, mainly during periods of atypical stock market volatility. They also show that including gold in portfolios usually leads to a better performance, mainly with a buy-and-hold strategy instead of a constantly switching one. McCown and Zimmerman (2006) also highlight the fact that gold adds no systematic risk to an investor’s portfolio, as it displays the features of a zero-beta asset. This way, the exposure to the market risk is almost insignificant for this precious metal.
Bialkowski et al. (2013), who also affirm that gold can act as a hedge and a safe haven for stocks, state that investors see gold as a worldwide accepted currency that does not lose its purchasing power. Moreover, they state that in the presence of financial disturbance regarding the monetary and banking systems, acquiring gold is a usual reaction by investors.
In summary, many authors reach to the conclusion that gold can be both a hedge and a safe haven. However, the findings suggest that it is not always the case and that it can depend not only on the methodology used but also on the stock markets analysed, as well as the period of analysis. Apparently, it can be the case that gold, during a certain period, serves as a hedge for the stocks of a certain region but not for the stocks of other regions and that the results can change over time because of the non-linear relationship between the gold market and the stock market.
5 6
3. Data and Methodology
The data used in this paper to study the relationship between gold and stocks consists of daily observations, covering the period from January of 1996 until December of 2015. It is a large and recent period which includes some economic downfalls that help studying the properties of gold in relation to shares during that period.
Given that the goal is to examine not only the hedging properties but also if gold can be a safe haven for stocks, I use a regression model proposed by Baur and McDermott (2009), also employed in Hood and Malik (2013).
It is defined as an It is an ARMA-GARCH model that consists of the following equations:
rgold = a + btrstock,t + et
b = c0 + c1D(rstock,q10) + c2D(rstock,q5) + c3D(rstock,q1)
σt2 = αet-12 + γet-12D(et-1<0) + βσt-12
This model includes dummy variables that allow to study gold in periods of downward pressure of the stock market, which facilitates the objective of studying the safe haven properties, besides the hedging ones.
These dummy variabes D(rstock,q) are equal to 1 if the stock returns are in a certain
percentile of the stock returns distribution, such as the 10%, 5% or 1%. If, otherwise, the return is larger than the q% percentile, the value of dummy variable is zero. Moreover, rgold and rstock are the returns of gold and stock prices, respectively.
If the parameters c0, c1, c2 and c3 are negative and statistically different from zero gold
can be considered as a strong safe haven. If, otherwise, the parameters are just non-positive it means gold is a weak safe haven; gold would be seen as a hedge if c0 is zero
(weak hedge) or negative (strong hedge) and the sum of the c1, c2 and c3 are not jointly
positive exceeding the value of c0.
The last equation presents a GARCH(1,1) where the parameters involved are: α (the ARCH term), γ (the asymmetric component) and β (the GARCH term).
The S&P 500 index is used to analyse the U.S. stock market. It includes the market capitalizations of the 500 largest companies in the U.S. market, in many different sectors, which make it one of the best representations of the market it symbolizes. The European market is also analysed through the Euro Stoxx 50, which contains the supposedly largest and most liquid stocks of twelve major Eurozone countries.
Finally, I also consider a global and broader stock index, such as the MSCI World Index. It comprises equity performance across twenty three developed countries, which allows for the avoidance of emerging markets exposure.
For gold, I use the S&P GSCI Gold Index. It is a benchmark tracking index for the COMEX (Commodity Exchange) gold futures. It is a reliable index designed to be tradable and readily accessible to market participants.
With COMEX gold futures measured in US Dollars, such as the S&P 500 and the MSCI World Index, the Euro Stoxx 50 was also extracted in US Dollars so that all the indexes are in the same currency, in order to be able to perform a more reliable analysis, taking into account the exchange rate issues. Moreover, all data is obtained from DataStream and all of the indexes are in total returns.
In order to refer to periods of economic downfalls, I use the NBER (National Bureau of Economic Research) recession dates. The NBER is a U.S. private, non-profit organization dedicated to conducting economic research and to disseminating research findings.
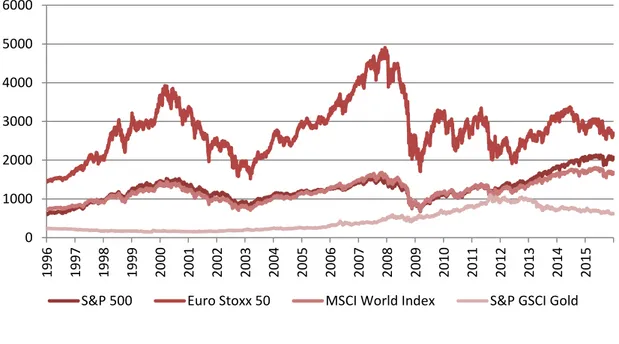
Figure 1a: Stock indexes and gold index prices, in a linear scale (01/01/1996 – 31/12/2015)
This figure displays the evolution of the S&P 500, the Euro Stoxx 50, the MSCI World Index and the S&P GSCI Gold Index, in a linear scale, over a 20 year period from January 1996 until December 2015, with daily observations.
Looking at how the indexes have evolved throughout the sample period, it is clear from Figure 1a that all stock indexes tend to move together, especially the S&P 500 and the MSCI World Index. This tendency, according to Baxter and Kouparitsas (2004) may be related to the high bilateral trade between the countries involved in the indexes and also because of the fact that all of them are industrialized and developed countries.
Because of the unequal order of magnitude of the indexes, in Figure 1b (see appendix) it can be witnessed the same behaviour but in a logarithm scale, instead of a linear one, in order to have a better comparison between the movements of the indexes and their respective magnitudes. Also, in order to account for the same scale issue, in Figure 1c
0 1000 2000 3000 4000 5000 6000 19 96 19 97 19 98 19 99 20 00 20 01 20 02 20 03 20 04 20 05 20 06 20 07 20 08 20 09 20 10 20 11 20 12 20 13 20 14 20 15
S&P 500 Euro Stoxx 50 MSCI World Index S&P GSCI Gold
9 9
(see appendix), a normalized graph can be observed, which probably gives the best insight about the returns of each index, when compared to each other.
All the indexes composed by stocks increased until the year of 2000, where a downturn that lasted for about three years has started, causing those same indexes to approach their initial levels. This recession originated in 2000 was known has the dotcom crash. From then on, a similar rise to the initial one can be observed for the indexes, triggering the Euro Stoxx 50 to its peak in the ending of 2007.
Afterwards, the financial crisis of 2008 affected the global economy. The excessive and easy access to house credit for subprime borrowers together with the conception of the so-called CDO’s originated the default of both borrowers and lenders, which resulted in a financial meltdown that was spread to Europe and inverted the economic growth that was being witnessed. The stock indexes levels quickly returned to the ones observable in 2002. This took just about a year or even less and from then on, although one can state that the indexes have been recovering, only the S&P 500 and the MSCI World Index have reached new peaks, while the Euro Stoxx 50 could not increase in the same proportion as the others, displaying evidence that Europe has not yet entirely recovered. On the other hand, the S&P GSCI Gold index seems practically stable in the first ten sample years, starting then to rise until its peak in 2011. According to Sumner et al. (2009) this makes sense because, as they state, what makes gold so interesting and secure in times of political and economic uncertainty is its tangibility and role as a store of value and therefore, given its low and slightly negative correlation with stocks it constitutes a big advantage in portfolio making. Two years later, a downfall of the gold price was initiated that has lasted until the last day of the sample period.
11
It can be clearly observed that the correlation between the stock market and the gold market is not constant over time. Instead, it is easily understandable that it differs very much as time passes, with periods of positive correlation but also periods of negative correlation, pointing to the fact that gold cannot be a hedge against stocks at all times, but only on average, supporting the conclusions presented by Baur and Lucey (2009).
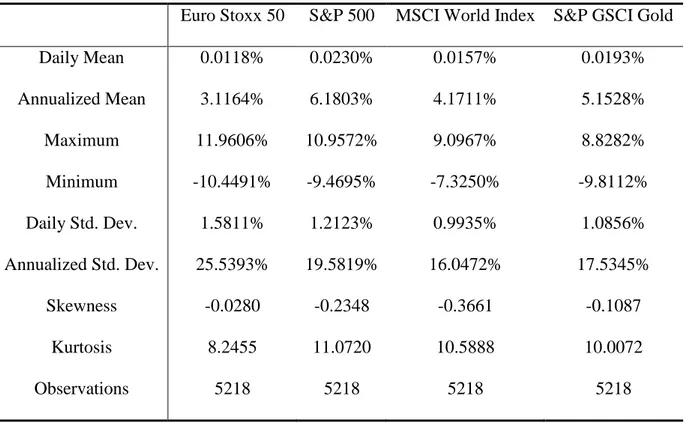
Table 1: Descriptive statistics of the indexes returns (01/01/1996 – 31/12/2015)
This table presents the descriptive statistics of the S&P 500, the Euro Stoxx 50, the MSCI World Index and the S&P GSCI Gold Index over the entire sample period, with daily observations.
Euro Stoxx 50 S&P 500 MSCI World Index S&P GSCI Gold
Daily Mean 0.0118% 0.0230% 0.0157% 0.0193% Annualized Mean 3.1164% 6.1803% 4.1711% 5.1528% Maximum 11.9606% 10.9572% 9.0967% 8.8282% Minimum -10.4491% -9.4695% -7.3250% -9.8112% Daily Std. Dev. 1.5811% 1.2123% 0.9935% 1.0856% Annualized Std. Dev. 25.5393% 19.5819% 16.0472% 17.5345% Skewness -0.0280 -0.2348 -0.3661 -0.1087 Kurtosis 8.2455 11.0720 10.5888 10.0072 Observations 5218 5218 5218 5218
Analysing Table 1, it can be reached the interesting and perhaps unexpected conclusion that gold’s annualized log returns (5.1528%) were higher than the ones of the MSCI
World Index (4.1711%) and were even greater than the Euro Stoxx 50 index’s returns (3.1164%) that, despite from having a higher volatility did not provide as much returns as the other indexes during the sample period. This high returns on gold when compared to the other indexes is most certainly related to the fact that, as it can be easily observed in Figure 1c (see appendix), gold prices suffered a huge increase between 2008 and 2012, a period that includes the financial crisis and that affected negatively the stock market, with an impact that was to be felt during a long period of time. The index with the highest returns was the S&P 500 with an average of 0.023% per day and a correspondent 6.1803% per year.
The volatility of gold was quite high as well, with an annualized standard deviation of 17.5345%. Gold’s daily returns displayed a maximum value of almost 9%, not too far away from the other indexes’ maximums and the minimum return of gold is nearly -10%, lower than the minimums for the S&P 500 and the MSCI World Index.
It can also be verified that the skewness was negative in all cases, meaning that the extreme returns of the indexes occurred more often downwards than upwards, especially for the MSCI World Index and the S&P 500.
12 10
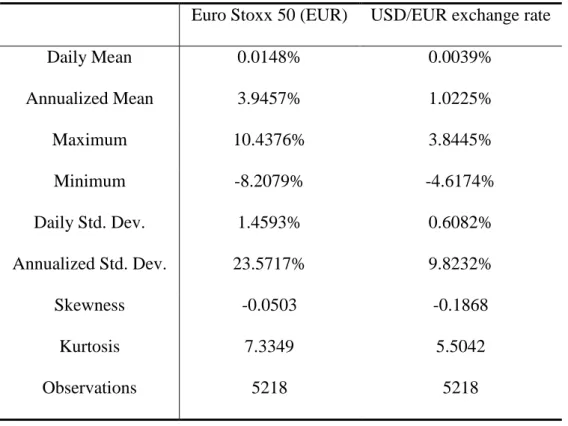
Table 2: Descriptive statistics of the Euro Stoxx 50 returns and of the USD/EUR exchange rate (01/01/1996 – 31/12/2015)
This table presents the descriptive statistics of the Euro Stoxx 50 and of the USD/EUR exchange rate over the entire sample period, with daily observations.
Euro Stoxx 50 (EUR) USD/EUR exchange rate
Daily Mean 0.0148% 0.0039% Annualized Mean 3.9457% 1.0225% Maximum 10.4376% 3.8445% Minimum -8.2079% -4.6174% Daily Std. Dev. 1.4593% 0.6082% Annualized Std. Dev. 23.5717% 9.8232% Skewness -0.0503 -0.1868 Kurtosis 7.3349 5.5042 Observations 5218 5218
Even though this does not change much the analysis, one should note that one of the reasons for the low returns of the Euro Stoxx 50 is because the analysis is being made in U.S. Dollars and the dollar has appreciated against the Euro during this period, leading to lower returns for an investor that is investing in an index that is in Euros. The USD/EUR exchange rate has risen from 0.75€ per dollar in the first day of the sample to 0.92€ per dollar in the last day of the sample period, which translates an average annualized appreciation of 1.0225%, that can be observed in Table 2. Therefore, the real
13 10
14 10
average annualized returns of the Euro Stoxx 50 were about 0.8293% more than the returns observable in table 1, if we analyse it in euros instead of dollars.
4. Results
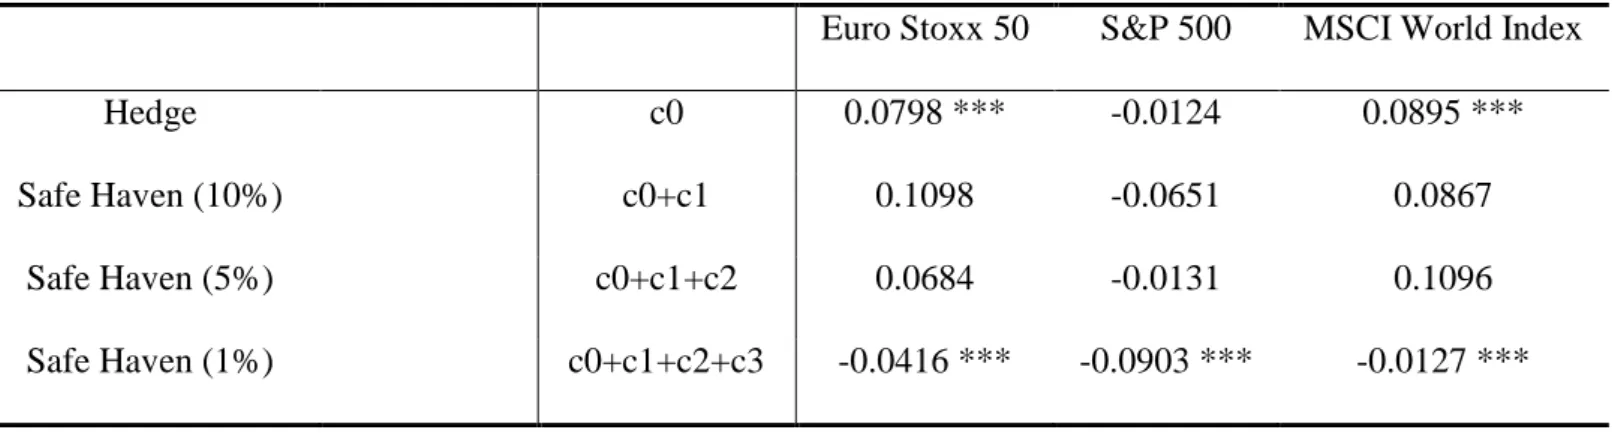
Table 3: Estimation results from the econometric model (01/01/1996 – 31/12/2015)
This table presents the estimation results derived from the model regarding the hedging and safe haven properties of gold in relation to the analysed stock indexes.
Euro Stoxx 50 S&P 500 MSCI World Index
Hedge c0 c0 0.0798 *** -0.0124 0.0895 ***
Safe Haven (10%) c0+c1 c0+c1 0.1098 -0.0651 0.0867
Safe Haven (5%) c0+c1+c2 c0+c1+c2 0.0684 -0.0131 0.1096
Safe Haven (1%) c0+c1+c2+c3 c0+c1+c2+c3 -0.0416 *** -0.0903 *** -0.0127 ***
As it can be observed in Table 3, this study indicates that gold is not a hedge for any of the stock indexes. In order to be considered a hedge for any stock index, the hedge line must be negative. To be considered a weak or strong safe haven in a particular percentile for any stock index, that percentile line must be zero or negative, respectively. It looks as if gold has a small positive correlation with the stock indexes, on average, being unable to be considered a hedge. Baur and McDermott (2010) justified similar obtained outcomes by the fact that the indexes are all in the same currency, which can influence the results by implying a larger degree of co-movement, resulting from changes in the exchange rate.
It can be perceived from the table that gold has a highly statistically significant c0 value
of approximately 0.0798 and 0.0895, for the Euro Stoxx 50 and the MSCI World Index, respectively, which can be a consequence of the currency adjustment for each of the
15 10
* - statistically significant at the 10% level ** - statistically significant at the 5% level *** - statistically significant at the 1% level
index. On the other hand, while the S&P 500 correlation estimate with gold is negative, on average, the results are statistically insignificant for this particular stock index, leaving it unable to make any inferences about the real correlation between the two indexes.
Moreover, for the tenth and fifth percentile, gold cannot be considered a safe haven according to the estimation model. Still, an interesting conclusion and perhaps useful for investors is that for extreme negative stock market returns (first percentile), gold appears to be a strong safe haven for all of the stock indexes with highly statistically significant negative correlation. The table presents a value of the sum of all of the c parameters of about 0.0416 for the Euro Stoxx 50, 0.0903 for the S&P 500 and -0.0127 for the MSCI World Index. This means that, during the days that the stock markets are having its lowest returns, the gold market tends to exhibit positive returns, protecting investors when they need the most.
Therefore, this study does not point to the fact that gold can be able to serve as a hedge of stocks, contrasting to some previous studies, as it was observed during the literature review. It seems the precious metal is much better at protecting stock portfolios only when the stock market is experiencing its worst performances.
16 10
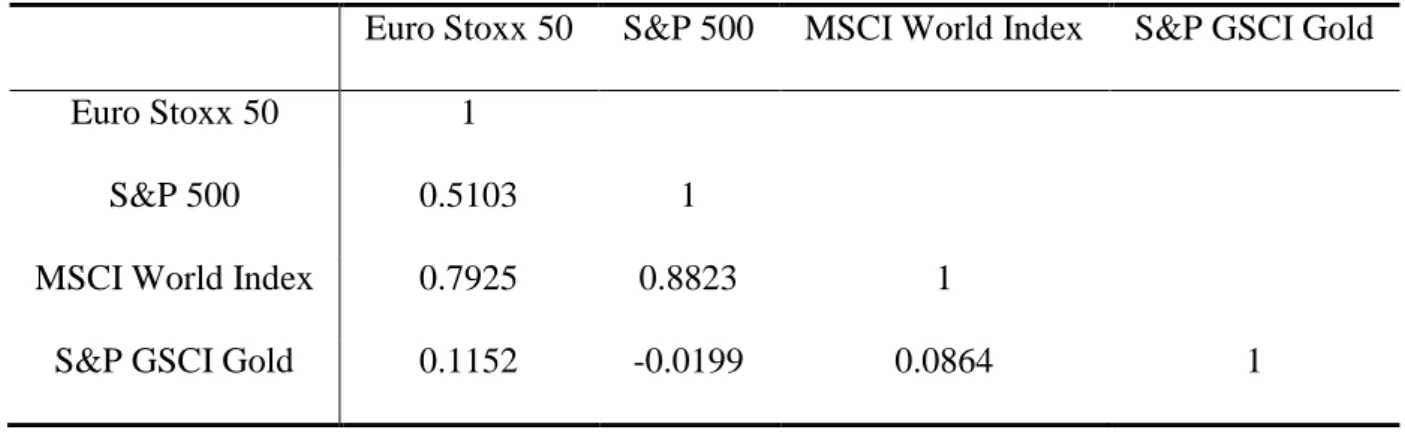
Table 4a: Correlation matrix of the indexes returns (01/01/1996 – 31/12/2015)
This table presents the correlation analysis between the S&P 500, the Euro Stoxx 50, the MSCI World Index and the S&P GSCI Gold Index over the period from January 1996 until December 2015, with daily observations.
Euro Stoxx 50 S&P 500 MSCI World Index S&P GSCI Gold
Euro Stoxx 50 1
S&P 500 0.5103 1
MSCI World Index 0.7925 0.8823 1
S&P GSCI Gold 0.1152 -0.0199 0.0864 1
In order to see if the model makes any sense it is better to check how the correlations between the indexes really were during the sample period. Table 4a shows the correlation matrix between the daily returns of the indexes under analysis during the whole sample period. It can be observed that there was a very high correlation (0.8823) between the S&P 500 and the MSCI World Index, as was expected. The Euro Stoxx 50 was also very much correlated with the MSCI World Index (0.7925) and has also a 0.5103 correlation with the S&P 500.
On the other hand, gold returns do not appear to be very much correlated with the other indexes returns. The highest observable correlation is between this precious metal and the Euro Stoxx 50 (0.1152) and it presents an even negative correlation with the S&P 500 of about -0.0199. One cannot affirm that gold was a hedge against all stocks by the fact that, although small, a positive correlation was witnessed between gold and both the Euro Stoxx 50 and the MSCI World Index, which supports the results obtained from the
17 10
model. Still, gold could have been a hedge for the S&P 500 in the sample period, despite from the fact that its correlation with the index was almost zero. However, the statistically insignificant results for the U.S. stock index, derived from the model, do not allow for any conclusions in that matter.
In order to investigate if it also was a safe haven an analysis to the correlation between gold and stocks during periods of market downfall can be performed. According to NBER, there are two periods of that kind in the sample.
Table 4b: Correlation matrix of the indexes returns in the first recession period (15/03/2001 – 15/11/2001)
This table presents the correlation analysis between the S&P 500, the Euro Stoxx 50, the MSCI World Index and the S&P GSCI Gold Index over the period from March 2001 until November 2001, with daily observations.
Euro Stoxx 50 S&P 500 MSCI World Index S&P GSCI Gold
Euro Stoxx 50 1
S&P 500 0.4190 1
MSCI World Index 0.7014 0.9018 1
S&P GSCI Gold -0.1067 -0.0694 -0.0714 1
Analysing Table 4b where it can be seen the first example, the sub-sample from March 2001 to November 2001, in which the first NBER recession of the sample as occurred, it can be observed that gold returns were negatively correlated with the returns of all the
other indexes, which is evidence of gold being a safe haven for stocks during that period.
Table 4c: Correlation matrix of the indexes returns in the second recession period (15/12/2007 – 15/06/2009)
This table presents the correlation analysis between the S&P 500, the Euro Stoxx 50, the MSCI World Index and the S&P GSCI Gold Index over the period from December 2007 until June 2009, with daily observations.
Euro Stoxx 50 S&P 500 MSCI World Index S&P GSCI Gold
Euro Stoxx 50 1
S&P 500 0.5374 1
MSCI World Index 0.8373 0.8790 1
S&P GSCI Gold 0.1048 -0.0647 0.0440 1
Table 4c shows the analysis of the correlations between the indexes in the second NBER recession period that goes from December 2007 until June 2009, which corresponds to the latest major worldwide financial crisis. In this case, gold returns are only negatively correlated with the returns of the S&P 500, meaning that the safe haven property was not for all stock indexes in this case. The results from this NBER recession period may be associated with the fact that it is a larger sub-sample and that has experienced more stock market volatility (as it can be seen in Figures 2a, 2b and 2c), which can include a greater percentage of days of stock positive returns in relation to the first period.
19 10
In order to observe that the properties of gold, in fact, are dependent on the period of analysis, the econometric estimation model was used in the sub-sample that goes from January of 1996 (the first day of the sample) until December 2002, where, by looking at the evolution of the indexes through time, it seems the correlation between the gold index and the stock indexes was lower, with a first period (about four years) of rising stock prices and decreasing gold prices and a second period (around three years) of falling stock prices and increasing gold prices.
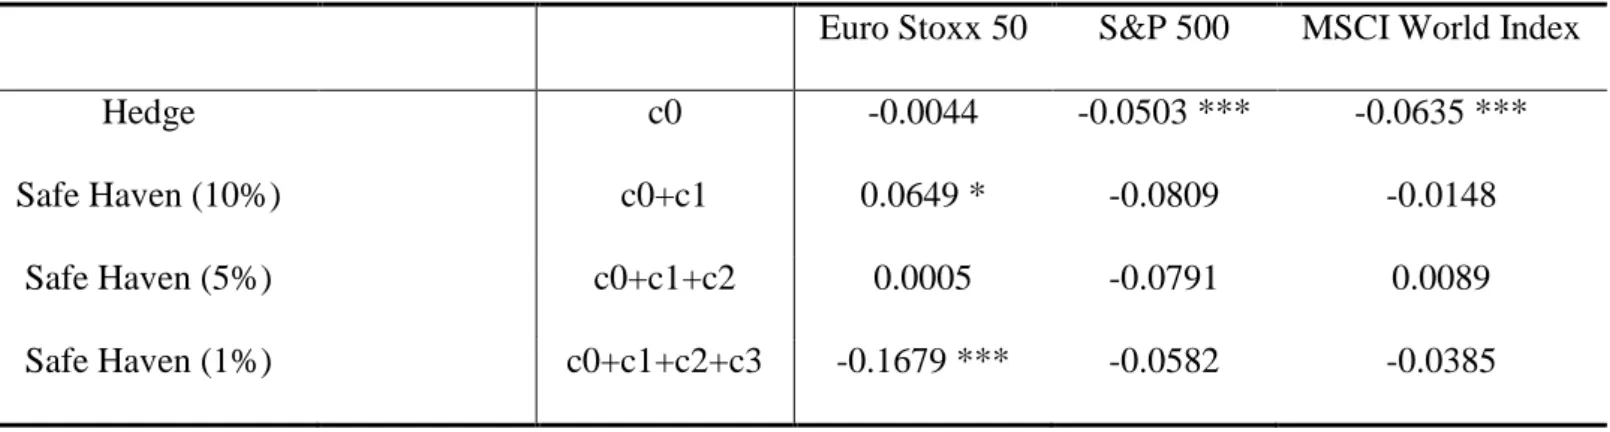
Table 5a: Estimation results from the econometric model (01/01/1996 – 31/12/2002)
This table presents the estimation results derived from the model regarding the hedging and safe haven properties of gold in relation to the analysed stock indexes, considering only the sub-sample period from January 1996 until December 2002
Euro Stoxx 50 S&P 500 MSCI World Index
Hedge c0 c0 -0.0044 -0.0503 *** -0.0635 ***
Safe Haven (10%) c0+c1 c0+c1 0.0649 * -0.0809 -0.0148
Safe Haven (5%) c0+c1+c2 c0+c1+c2 0.0005 -0.0791 0.0089
Safe Haven (1%) c0+c1+c2+c3 c0+c1+c2+c3 -0.1679 *** -0.0582 -0.0385
It can be clearly observed that the results are, in fact, very different from the ones obtained when the whole sample period was used. In this case, looking at Table 5a, it can be verified that for the EuroStoxx, the results imply the same conclusion: gold is not a hedge for this stock index, neither a safe haven for the tenth and the fifth percentile. It
20
* - statistically significant at the 10% level ** - statistically significant at the 5% level *** - statistically significant at the 1% level
also still remains a safe haven for the first percentile with value of -0.1679, when considering the sum of c0, c1, c2 and c3.
For the other two stocks indexes, the results are much more distinct that those obtained before. Looking at the S&P 500 estimation results from the model, it can be seen that the hedging property is now valid for gold in relation to this index, as it presents a highly statistically significant c0 value of -0.0503. However, the safe haven properties of
gold can no longer be analysed for gold, regarding the S&P 500, even for the first percentile, as the econometric model do not provide statistically significant values for these parameters anymore.
For the MSCI World Index the results are very similar. It displays a highly statistically significant c0 value of -0.0635 and statistically insignificant values for the rest of the
parameters, implying that gold is a hedge for this stock index but making it unable to make inferences about the safe haven properties of gold, even though negative values can be observed in the table.
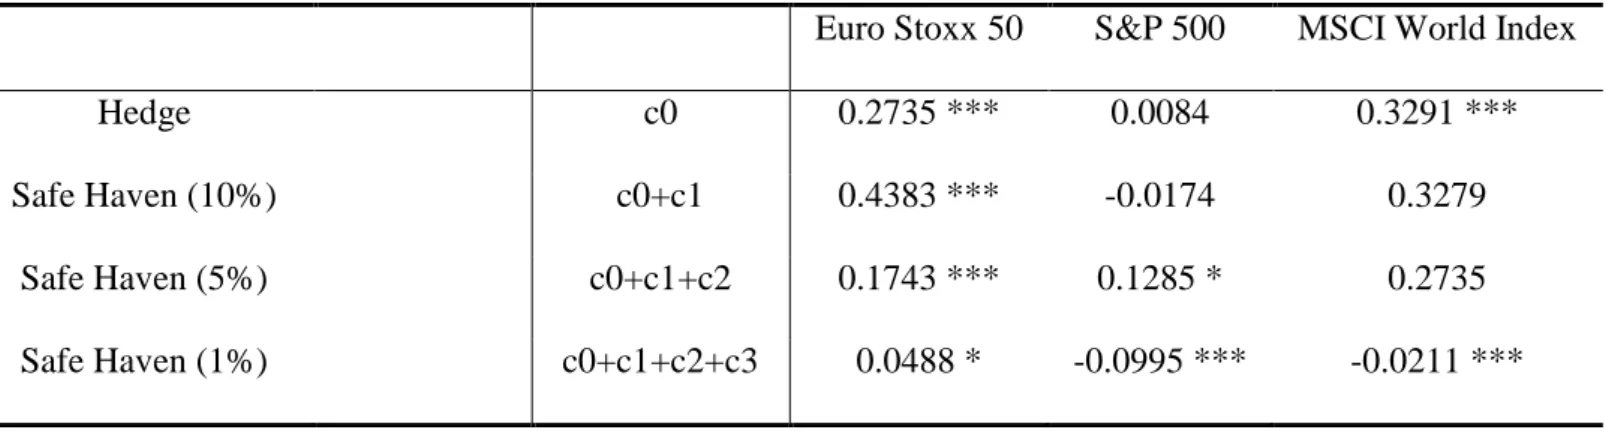
Table 5b: Estimation results from the econometric model (01/01/2003 – 31/12/2009)
This table presents the estimation results derived from the model regarding the hedging and safe haven properties of gold in relation to the analysed stock indexes, considering only the sub-sample period from January 2002 until December 2009
Euro Stoxx 50 S&P 500 MSCI World Index
Hedge c0 c0 0.2735 *** 0.0084 0.3291 ***
Safe Haven (10%) c0+c1 c0+c1 0.4383 *** -0.0174 0.3279
Safe Haven (5%) c0+c1+c2 c0+c1+c2 0.1743 *** 0.1285 * 0.2735
Safe Haven (1%) c0+c1+c2+c3 c0+c1+c2+c3 0.0488 * -0.0995 *** -0.0211 ***
Studying the sub-sample period that follows, from the beginning of 2003 until the last day of 2009, it can be observed in Table 5b that the results are now more similar to the ones observed when considering the full sample period. For the Euro Stoxx 50, gold is no longer a safe haven for the first percentile, but with a highly statistical significance, it can be verified that gold still remains not being a hedge nor a safe haven for the tenth and fifth percentiles of the Euro Stoxx 50 returns distribution.
It also remains not being a hedge of the other two stock indexes, which was already expected by looking at the evolution of the indexes as it seems there was more correlation between gold and stocks, and neither a safe haven for the tenth and the fifth percentile. Still for the lowest percentile, the safe haven property is still observed with a highly statistical significance level.
22
* - statistically significant at the 10% level ** - statistically significant at the 5% level *** - statistically significant at the 1% level
This analysis leads to the conclusion that one must be very careful when analysing the properties of gold in relation to stocks as it was observed by the results of the econometric model that it changes over time, making it very difficult to draw any precise conclusions about the relation between this commodity and stocks.
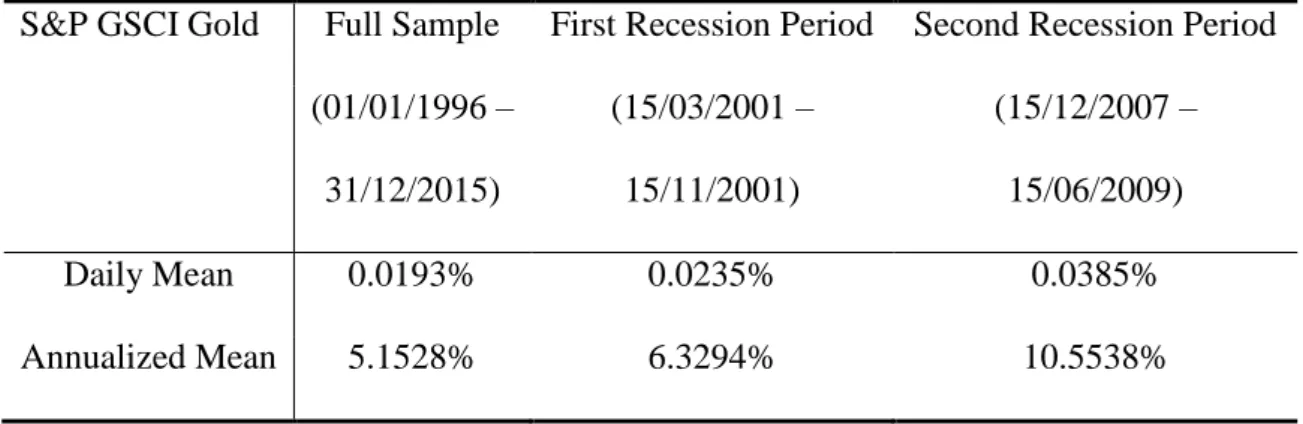
Table 6: Mean returns of the S&P GSCI Gold during the entire sample period and also during the first and the second NBER recession periods
This table presents an analysis to the returns of the S&P GSCI Gold Index over the period from January 1996 until December 2015, the sub-period from March 2001 until November 2001 and the sub-period from December 2007 until June 2009, with daily observations.
S&P GSCI Gold Full Sample First Recession Period Second Recession Period (01/01/1996 – 31/12/2015) (15/03/2001 – 15/11/2001) (15/12/2007 – 15/06/2009) Daily Mean 0.0193% 0.0235% 0.0385% Annualized Mean 5.1528% 6.3294% 10.5538%
An interesting analysis for gold returns during the two recession periods can be observed in Table 6, which demonstrates that during the two NBER recession periods gold returns have performed better than in the overall sample period under analysis, highlighting the fact that when the stock market is experiencing times of disturbance, the gold market tends to be able to protect itself and yield even higher returns than it does overall.
Table 7: Annual mean returns, standard deviation and Sharpe ratio analysis (01/01/1996 – 31/12/2015)
This table presents an analysis to the annualized returns, annualized standard deviation and Sharpe ratio of the S&P 500, the Euro Stoxx 50 and the MSCI World Index as well as to portfolios composed by 50% of each one of these indexes and 50% by the S&P GSCI Gold Index, over the entire sample period, with daily observations.
Annualized Mean Annualized Std. Dev. Sharpe Ratio Euro Stoxx 50 3.1164% 25.5393% 0.0512 S&P 500 6.1803% 19.5819% 0.2232
MSCI World Index 4.1711% 16.0472% 0.1471
50% * Euro Stoxx 50 + 50% * S&P GSCI Gold 4.1346% 2.6592% 0.8741 50% * S&P 500 + 50% * S&P GSCI Gold 5.6665% 1.9266% 2.0017 50% * MSCI World Index + 50% * S&P GSCI Gold 4.6620% 1.5758% 1.8099
Analysing Table 7, it can be seen that gold is in fact a good diversifier, as if combined with any of the stock indexes it has the ability to lower the portfolio’s risk, measured by its standard deviation. Moreover, if combined with the Euro Stoxx 50 or the MSCI World Index, it would also increase the portfolio’s returns during the sample period. A way of measuring the total effect of combining the stock and the gold index is to look at the Sharpe ratio. The Sharpe Ratio is a very popular measure that, according to Sharpe (1994) himself is designed to compute the expected returns per unit of risk of the asset, in order to improve the investments managing, through a proper comparison. It is
calculated by subtracting the risk-free rate return to the return of the index, in this case, and by then dividing it by the standard deviation of the index. Assuming that the risk-free rate is the 20-year U.S. Treasury bond, since the sample period is precisely twenty years and, according to Damodaran (2008), the risk-free rate should be a government zero coupon bond, because of its low default and reinvestment risks, it can be observed that creating portfolios composed of both one of the stock indexes and the gold index, equally divided, leads to a much greater Sharpe ratio than the ratio for only the stock indexes itself. Jaffe (1989) emphasises these gains obtained by including gold in stock portfolios in terms of diversification, revealing that adding gold to a portfolio can improve to some extent its returns, while decreasing its volatility. The author tests four hypothetical portfolios of varying risk which showed that the addition of gold in each case increases the average returns and reduces the risk of the portfolio.
In that same paper it is also revealed by the author that the reason why gold has a lower return than some other risky assets has to do mainly with the fact that gold is the most liquid asset in times of catastrophe and, consequently, investors are willing to pay a premium price for this commodity.
The fact is that, as it can be verified in the table, adding gold to stock portfolios results in far higher returns adjusted to the asset’s risk, enhancing the power of the diversification effects of gold in relation to stocks, which supports the study conducted by Belousova and Dorfleitner (2012) , previously mentioned in the literature review.
Figure 3a: Stock indexes and gold index prices, linearized (01/01/2016 – 30/06/2016)
This figure displays the evolution of the S&P 500, the Euro Stoxx 50, the MSCI World Index and the S&P GSCI Gold Index, in a linear scale, over a 6 month period from January 2016 until June 2016, with daily observations.
An out-of-sample analysis for the first six months of 2016 was also performed in order to see if the conclusions of the model would make sense in this latest very short period. In Figure 3a it can be observed the evolution of the indexes, linearized, as it was a very short period and, this way, one can have a better insight on how the indexes have performed during this period. In the appendix it can be seen the evolution in a linear scale (see Figure 3b).
It can be perceived from Figure 3a that it was a tough period for the stock indexes as a decrease can be observed for all of them, mainly during the first month of the sample period. Afterwards, a recovery was witnessed but a lot of instability in the stock market
70 80 90 100 110 120 130 01/01/2016 01/02/2016 01/03/2016 01/04/2016 01/05/2016 01/06/2016 S&P 500 Euro Stoxx 50 MSCI World Index S&P GSCI Gold
on June due to Brexit saw both the Euro Stoxx 50 and the MSCI World Index end the period in a lower level than the initial one.
On the other hand, the gold index seems to perform much better than stocks, especially during the first month and a half, where the stock market experienced some difficulties. It was thereafter more stable but still with an increasing run until the end of the sample period.
Table 8: Descriptive statistics of the indexes returns (01/01/2016 – 30/06/2016)
This table presents the descriptive statistics of the S&P 500, the Euro Stoxx 50, the MSCI World Index and the S&P GSCI Gold Index over the period from January 2016 until June 2016, with daily observations.
Euro Stoxx 50 S&P 500 MSCI World Index S&P GSCI Gold
Daily Mean -0.0846% 0.0206% -0.0047% 0.1702% Annualized Mean -19.8108% 5.5084% -1.1600% 55.8613% Maximum 4.0199% 2.4459% 2.5653% 4.5873% Minimum -11.1033% -3.6581% -5.0285% -2.5503% Daily Std. Dev. 1.8103% 1.0035% 1.0260% 1.1333% Annualized Std. Dev. 29.2414% 16.2096% 16.5718% 18.3052% Skewness -1.7128 -0.4074 -0.8436 0.8474 Kurtosis 12.3808 4.0936 6.6223 5.4464 Observations 129 129 129 129 27
In Table 8 it can be observed that in fact the Euro Stoxx 50 and the MSCI World Index had negative returns during the period analysed (with -19.8108% and -1.1600% annualized returns, respectively). The S&P 500 managed to have positive annualized returns of 5.5084% but what really stands out is the fact that the S&P GSCI Gold Index had annualized returns of 55.8613% during this period, highlighting once again that the gold market tends to behave very well when the stock market is decreasing, especially in this specific period. It was a semester where the gold prices have seen a big rally mainly due to a lot of uncertainty in the stock market with the likes of Brexit and the U.S elections and also because of the downward revisions of the expected path of US interest rates from investors and the Fed.
The volatility of the gold index was quite in line with the volatility of the S&P 500 and the MSCI World Index, whereas the Euro Stoxx 50, despite performing much worse, had a much higher annualized volatility of 29.2414%.
Table 9: Correlation matrix of the indexes returns (01/01/2016 – 30/06/2016)
This table presents the correlation analysis between the S&P 500, the Euro Stoxx 50, the MSCI World Index and the S&P GSCI Gold Index over the period from January 2016 until June 2016, with daily observations.
Euro Stoxx 50 S&P 500 MSCI World Index S&P GSCI Gold
Euro Stoxx 50 1
S&P 500 0.6644 1
MSCI World Index 0.8832 0.9035 1
S&P GSCI Gold -0.3835 -0.4042 -0.3676 1
In terms of the correlations of the indexes, it was a period of very negative correlations between the gold index and the stock indexes (as it can be observed in Table 9), which was already expected when looking at the performance of each one of them. This is an indicator that during this period, gold could have been, in fact, a good hedging instrument for investors to use against the stock market, which contradicts the results obtained by the model for the period between January 1996 and December 2015. However, this was a very small period and, therefore, not as credible as the 20 year period firstly analysed to make inferences about the properties of gold in relation to stocks.
Nevertheless, it demonstrates once again that there are periods where one can effectively hedge a portfolio of stocks with the use of gold, even if the long-run the outcomes suggest otherwise.
Table 10: Estimation results from the econometric model (01/01/2016 – 30/06/2016)
This table presents the estimation results derived from the model regarding the hedging and safe haven properties of gold in relation to the analysed stock indexes, considering only the period from January 2016 until June 2016
Euro Stoxx 50 S&P 500 MSCI World Index
Hedge c0 c0 -0.1191 -0.2377 ** -0.0497
Safe Haven (10%) c0+c1 c0+c1 0.0314 -1.2175 *** -0.9078 ***
Safe Haven (5%) c0+c1+c2 c0+c1+c2 -0.5441 *** -0.4283 *** -0.6733
Safe Haven (1%) c0+c1+c2+c3 c0+c1+c2+c3 -0.3847 -0.7551 -0.7464
* - statistically significant at the 10% level ** - statistically significant at the 5% level *** - statistically significant at the 1% level
The econometric model displays negative c0 values for each one of the stock indexes but
only for the S&P 500 the figures are statistically significant, pointing to the fact that, according to the model, when analysing only the period from January until June of 2016, gold is a hedge of this stock index. For both the Euro Stoxx 50 and the MSCI World Index the model does not allow making any conclusions about the hedging property of gold.
Moreover, it can be observed that, according to the estimation model, gold is a safe haven for the 10% percentile for the S&P 500 and the MSCI World Index and for the 5% percentile for the S&P 500 and the Euro Stoxx 50, contradicting once again the results of the analysis to the period from January 1996 until December 2015.
This out-of-sample analysis points once more to the fact that the results of the econometric model might change with the period of analysis, due to the non-constant correlation between stocks and gold during time, which can be effortlessly observed when analysing the evolution of the indexes.
6. Conclusions
After making a distinction between a hedge and a safe haven, in this study, I analyse the role of gold in the stock market through an econometric model, followed by some tests, in order to check the veracity of the model. Contrasting to some previous papers, the results, when considering the whole sample period, show that gold is not a hedge on average for any of the stock indexes considered, although being a safe haven for the first percentile of the stock market returns. This can be, to some extent, related to the fact that my study involves a more recent period, where the gold index levels differ very much from the levels observed in former studies. After 2010, gold levels fired to its highest ever and were followed by its quickest and steeper decline.
It was shown, though, that a lot of care must be taken into account when analysing the results of the econometric model as it may vary with the period of analysis considered, which can constitute a strong limitation for studies on this topic. When the sub-sample period from January 1996 until December 2002 was measured, for instance, only the EuroStoxx 50 had similar outcomes whereas for both the S&P 500 and the MSCI World Index, the safe haven property was no longer valid, despite from the fact that gold could be a hedge for those indexes. The out-of-sample analysis for the first semester of 2016 also had contradictory results in relation to the whole sample period, as gold was no safe haven for any stock index anymore and gold was now a hedge for the S&P 500 for instance, if only this very short period was analysed. It was also easily understandable that the results depend strongly on the stock index analysed. Further research could, therefore, focus on different stock indexes, such the Asian market or even emerging markets. One could also incorporate other commodities in such a study, instead of just considering gold.
It was finally highlighted in this study the importance of adding gold to stock portfolios as a way of diversifying the risk. This is possible because of the very low correlation between gold and stocks.
32 32
7. References
Baur, D. and B. Lucey (2009). Is gold a Hedge or Safe Haven? An Analysis of Stocks, Bonds and Gold. Journal of Financial stability, Vol. 45, Issue 2, pp. 217-229.
Baur, D. and T. McDermott (2010). Is Gold a Safe Haven? International Evidence.
Journal of Banking & Finance, Vol. 34, Issue 8, pp. 1886-1898.
Baxter, M. and M. Kouparitsas (2005). Determinants of Business Cycle Comovement: a Robust Analysis. Journal of Monetary Economics, Vol. 52, Issue 1, pp. 113–157.
Belousova, J. and G. Dorfleitner (2012). On the diversification benefits of commodities from the perspective of euro investors. Journal of Banking & Finance, 9, pp. 2455-2472.
Bialkowski, J. et al. (2015). The Gold Price in Times of Crisis. International Review
of Financial Analysis, Vol. 41, pp. 329-339.
Campbell, J.Y. et al. (2001). Have Individual Stocks Become More Volatile? An Empirical Exploration of Idiosyncratic Risk. The Journal of Finance, Volume 56, Issue 1, pp. 1–43.
Ciner, C. et al. (2013). Hedges and Safe Havens: An Examination of Stocks, Bonds, Gold, Oil and Exchange Rates. International Review of Financial Analysis, Vol. 29, pp. 202-211.
Coudert, V. and H. Raymond (2011). Gold and Financial Assets: Are there any Safe Havens in Bear Markets? Economics Bulletin, Vol. 31, Issue 2, pp. 1613-1622.
Damodaran, A. (2008). What is the Riskfree Rate? A Search for the Basic Building Block. papers.ssrn.com
Goetzmann, W.N. and A. Kumar (2008). Equity Portfolio Diversification. Review of
Finance, pp. 433-463.
Hillier, D. et al. (2006). Do Precious Metals Shine? An Investment Perspective.
Financial Analysts Journal – CFA Institute, Vol.62, Issue 2, pp. 98-106.
Hood, M. and F. Malik (2013). Is Gold the Best Hedge and a Safe Haven Under Changing Stock Market Volatility? Review of Financial Economics, Vol. 22, Issue 2, pp. 47–52.
Jaffe, J.F. (1989). Gold and Gold Stocks as Investments for Institutional Portfolios.
Financial Analysts Journal - CFA Institute, Vol.45, Issue 2, pp. 53-59.
Lawrence, C. (2003). Why is Gold Different from Other Assets? An Empirical Investigation. London, UK: The World Gold Council.
McCown, J.R. and J.R. Zimmerman (2006). Is Gold a Zero-Beta Asset? Analysis of the Investment Potential of Precious Metals, Working Paper Series.
Mulyadi, M.S. and Y. Anwar (2012). Gold versus stock investment: An econometric analysis. International Journal of Development and Sustainability, Vol. 1, Issue 1, pp. 1-7.
Ratner, M. and S. Klein (2008). The Portfolio Implications of Gold Investment.
Journal of Investing, Vol. 17, Issue 8.
Saad, L. (2012). Still Americans' Top Pick Among Long-Term Investments.
Sharpe, W.F. (1994). The sharpe ratio. The journal of portfolio management, Vol. 21, Issue 1, pp. 49-58.
Sumner, S. et al. (2010). Spillover Effects among Gold, Stocks, and Bonds. Journal
of Centrum Cathedra, Vol. 3, Issue 2, pp. 106-120.
33 34 34
Appendix
Figure 1b: Stock indexes and gold index prices, in a logarithmic scale (01/01/1996 – 31/12/2015)
This figure displays the evolution of the S&P 500, the Euro Stoxx 50, the MSCI World Index and the S&P GSCI Gold Index, in a logarithmic scale, over a 20 year period from January 1996 until December 2015, with daily observations.
100 1000 10000 19 96 19 97 19 98 19 99 20 00 20 01 20 02 20 03 20 04 20 05 20 06 20 07 20 08 20 09 20 10 20 11 20 12 20 13 20 14 20 15
S&P 500 Euro Stoxx 50 MSCI World Index S&P GSCI Gold
Figure 1c: Stock indexes and gold prices, linearized (01/01/1996 – 31/12/2015)
This figure displays the evolution of the S&P 500, the Euro Stoxx 50, the MSCI World Index and the S&P GSCI Gold Index, linearized, over a 20 year period from January 1996 until December 2015, with daily observations.
0 100 200 300 400 500 600 19 96 19 97 19 98 19 99 20 00 20 01 20 02 20 03 20 04 20 05 20 06 20 07 20 08 20 09 20 10 20 11 20 12 20 13 20 14 20 15
S&P 500 Euro Stoxx 50 MSCI World Index S&P GSCI Gold TR
Figure 2a: S&P 500 daily returns (01/01/1996 – 31/12/2015)
This figure displays the evolution of the daily returns of the S&P 500 over a 20 year period from January 1996 until December 2015, with daily observations.
Figure 2b: Euro Stoxx 50 daily returns (01/01/1996 – 31/12/2015)
This figure displays the evolution of the daily returns of the Euro Stoxx 50 over a 20 year period from January 1996 until December 2015, with daily observations.
-0,15 -0,10 -0,05 0,00 0,05 0,10 0,15 19 96 19 97 19 98 19 99 20 00 20 01 20 02 20 03 20 04 20 05 20 06 20 07 20 08 20 09 20 10 20 11 20 12 20 13 20 14 20 15 -0,15 -0,10 -0,05 0,00 0,05 0,10 0,15 19 96 19 97 19 98 19 99 20 00 20 01 20 02 20 03 20 04 20 05 20 06 20 07 20 08 20 09 20 10 20 11 20 12 20 13 20 14 20 15 37
Figure 2c: MSCI World Index daily returns (01/01/1996 – 31/12/2015)
This figure displays the evolution of the daily returns of the MSCI World Index over a 20 year period from January 1996 until December 2015, with daily observations.
Figure 2d: S&P GSCI Gold Index daily returns (01/01/1996 – 31/12/2015)
This figure displays the evolution of the daily returns of the S&P GSCI Gold Index over a 20 year period from January 1996 until December 2015, with daily observations.
-0,15 -0,10 -0,05 0,00 0,05 0,10 0,15 19 96 19 97 19 98 19 99 20 00 20 01 20 02 20 03 20 04 20 05 20 06 20 07 20 08 20 09 20 10 20 11 20 12 20 13 20 14 20 15 -0,150000 -0,100000 -0,050000 0,000000 0,050000 0,100000 0,150000 19 96 19 97 19 98 19 99 20 00 20 01 20 02 20 03 20 04 20 05 20 06 20 07 20 08 20 09 20 10 20 11 20 12 20 13 20 14 20 15 38
Figure 3b: Stock indexes and gold index prices, in a linear scale (01/01/2016 – 30/06/2016)
This figure displays the evolution of the S&P 500, the Euro Stoxx 50, the MSCI World Index and the S&P GSCI Gold Index, in a linear scale, over a 6 month period from January 2016 until June 2016, with daily observations.
0 500 1000 1500 2000 2500 3000 01/01/2016 01/02/2016 01/03/2016 01/04/2016 01/05/2016 01/06/2016 S&P 500 Euro Stoxx 50 MSCI World Index S&P GSCI Gold