Mestre
Engineering of Bacterial Exopolysaccharides:
From Synthesis to Properties
Dissertação para obtenção do Grau de Doutor em Engenharia Química e Bioquímica
Orientadora: Professora Doutora Maria d´Ascensão C. F. Miranda Reis Co-orientador: Doutora Maria Filomena Andrade de Freitas
Co-orientador: Doutor Vítor Manuel Delgado Alves
Júri:
Presidente: Professora Doutora Maria Elvira Fortunato Arguentes: Doutor Bruno Sommer Ferreira
Professora Doutora Isabel Maria Nunes de Sousa Vogais: Professor Doutor Arsénio Mendes Fialho
Professora Doutora Margarida Moldão Martins Doutor Christophe François Aimé Roca
iii
Engineering of Bacterial Exopolysaccharides: From Synthesis to Properties
Copyright © Cristiana Andreia Vieira Torres, Faculdade de Ciências e Tecnologia, Universidade Nova de Lisboa.
v Em primeiro lugar, gostaria de agradecer à minha orientadora, Maria Ascensão Reis, por esta oportunidade, pelo entusiasmo transmitido, pelas interessantes discussões e por nos momentos mais difíceis ter tido disponibilidade para me ouvir.
Aos meus co-orientadores Filomena Freitas e Vítor Alves um muito obrigada! Obrigada pela disponibilidade, por todas as discussões motivantes, por toda a partilha de conhecimento e acima de tudo obrigada pela amizade!
À Professora Ana Ramos, uma das principais responsáveis pela minha iniciação no mundo da investigação, um muito obrigado por toda simpatia e toda a disponibilidade demonstrada sempre que precisei de usar o GPC.
À Madalena Cruz, Rodolfo Marques e Sílvia Antunes, quero agradecer por toda a ajuda no trabalho laboratorial e também pela amizade.
À Carla Portugal agradeço a ajuda na diafiltração e também os momentos de boa disposição.
À Professora Maria João Melo agradeço toda a ajuda na utilização do FTIR.
Não posso também deixar de agradecer a simpatia com que todos me receberam ao longo das minhas temporadas no CEER (Centro de Engenharia dos Biossistemas) do Instituto Superior de Agronomia. Tendo que destacar, a Professora Isabel Sousa por toda a disponibilidade demonstrada e também por toda a simpatia.
Agradeço à SGC Energia – Biovegetal – o fornecimento do glicerol (subproduto do biodiesel).
vi anos.
À minha amiga Joana, provavelmente a grande responsável por eu ter enveredado no mundo da investigação, um muito obrigada por todo o interesse, toda a cumplicidade e todo o apoio.
Aos meus pais por um muito obrigada por todo o apoio e motivação!
Ao Filipe um obrigado muito especial por tudo, o interesse demonstrado pelo meu trabalho, a ajuda, o apoio, o carinho e a paciência.
vii O trabalho realizado nesta tese centra-se na produção e caracterização de um novo exopolissacárido (EPS) bacteriano de alto valor acrescentado, denominado por FucoPol. Neste processo utilizou-se como substrato o subproduto da indústria do biodiesel – glicerol. A bactéria produtora de EPS, isolada de uma solução de glicerol contaminada, foi caracterizada morfológica, bioquímica e geneticamente e denominada por Enterobacter
estirpe A47.
A produção do exopolissacárido pela Enterobacter A47 foi realizada em condições controladas de temperatura e pH (30.0 ºC e 6.80). O FucoPol apresenta um elevado peso molecular (~5.0x10⁶) e é rico em fucose, uma característica interessante, uma vez que a fucose é um dos açúcares raros e difíceis de obter na natureza. Tipicamente, o FucoPol é composto por açúcares, nomeadamente, fucose (32 – 36 %mol), galactose (25 – 26 %mol), glucose (28 – 34 %mol) e ácido glucorónico (9 – 10 %mol), e grupos acilo, particularmente acetato (3 – 5 wt.%), piruvato (13 – 14 wt.%) e succinato (3 wt.%).
De modo a optimizar a produção de FucoPol, foi estudado o impacto da temperatura (15.6 – 44.1 ºC) e pH (5.6 – 8.4) no crescimento celular e produção de EPS. Para tal foram utilizadas ferramentas estatísticas, tais como a metodologia de superfície de resposta e o desenho compósito central. Os resultados mostraram que Enterobacter A47 tem a capacidade de sintetizar diferentes heteropolissacáridos em função do pH e temperatura, uma característica que pode ser explorada de modo a obter polímeros com composições em função das aplicações desejadas. Para além disso, a produção de polímeros com elevado conteúdo em fucose foi estável para uma larga gama de valores de pH (6.0 – 8.0) e de temperatura (25 – 35 ºC), o que é importante para o desenvolvimento do processo tendo em vista uma aplicação industrial.
viii
bactéria Enterobacter A47 teve um desempenho semelhante numa vasta gama de concentrações iniciais de glicerol e azoto (25 – 50 e 0.68 – 1.05 g L-1, respectivamente), tanto para a produção (~8 g L-1) como para a composição do EPS (idêntica à composição típica). Utilizando uma solução de alimentação com uma concentração de glicerol (400 g L-1) e de azoto (9 g L-1) obteve-se a maior síntese de EPS (10.16 g L-1), a maior produtividade volumétrica (5.52 g L-1 d-1) e o maior conteúdo em fucose (41 %mol).
Foram estudadas as propriedades do FucoPol em solução, de modo a perceber o seu potencial de aplicação. O FucoPol apresenta uma viscosidade intrínseca de cerca de 8 dL g-1 e as suas soluções aquosas apresentam um comportamento reofluidificante. Verificou-se que, tanto o valor da viscosidade intrínseca como o comportamento reofluidificante se mantêm numa gama alargada de valores de pH e força iónica (3.5 – 8.0 e 0.05-0.50 M NaCl, respectivamente). O FucoPol apresentou uma capacidade de espessamento semelhante à demonstrada pela goma guar. Verificou-se ainda que as soluções de FucoPol mantêm a sua viscosidade aparente e as suas propriedades viscoelásticas à temperatura de 25 ºC, após ciclos consecutivos de aquecimento (até T=80ºC) e arrefecimento, indicando uma boa estabilidade térmica quando sujeitas a flutuações de temperatura. Estas propriedades indiciam que o FucoPol poderá ser utilizado como agente espessante em soluções aquosas que sofram variações de pH, força iónica e temperatura.
Foi também realizado um estudo preliminar sobre a capacidade do FucoPol formar e estabilizar emulsões de compostos hidrofóbicos em água, demonstrando um bom potencial para vários compostos, em particular para óleos alimentares (índice de emulsão, E24 > 60%).
Esta capacidade é similar à de outros polissacáridos comerciais (ex. xantano e pectina). A sua capacidade de floculação foi também avaliada, demonstrando ser semelhante a alguns produtos já comercializados (ex. xantano e carboximetilcelulose)
ix This thesis is focused on the production and characterisation of a novel value added bacterial exopolysaccharide (EPS), named FucoPol, using glycerol byproduct from the biodiesel industry as carbon source. The EPS producing bacterium was isolated from a contaminated glycerol solution. It was morphologically, biochemically and genetically characterized and named Enterobacter A47.
Exopolysaccharide production by Enterobacter A47 was performed under controlled temperature and pH (30.0ºC and 6.80, respectively). FucoPol has a high molecular weight (~5.0x10⁶) and was rich in fucose, which is very interesting, since fucose is one of the rare sugars difficult to obtain in Nature. Typically, FucoPol is composed of sugar monomers, namely, fucose (32 – 36 %mol), galactose (25 – 26 %mol), glucose (28 – 34 %mol) and glucuronic acid (9 – 10 %mol); and acyl group substituents, namely, acetyl (3 – 5 wt.%), pyruvyl (13 – 14 wt.%) and succinyl (3 wt%).
In order to optimize FucoPol production the impact of temperature (15.6 to 44.1 ºC) and pH (5.6 to 8.4) on cellular growth and EPS production was assessed using statistical tools (response surface methodology and central composite design). Enterobacter A47 revealed the ability to synthesize different heteropolysaccharides as a function of pH and temperature, a feature that can be exploited to obtain tailored polymer compositions. Moreover, the synthesis of high fucose content EPS was stable for wide pH (6.0 – 8.0) and temperature (25 – 35 ºC) ranges, which is important for the envisaged industrial development of the bioprocess.
x
volumetric productivity (5.52 g L-1 d-1), and fucose content (41 %mol) were reached when the feeding solution had a higher glycerol concentration (400 g L-1) and a nitrogen concentration of 9 g L-1.
In order to understand the potential for FucoPol’s industrial applicability, its solution properties were studied. FucoPol had an intrinsic viscosity of ~8.00 dL g-1 and produced viscous aqueous solutions with a shear thinning behaviour. Both intrinsic viscosity and shear thinning behaviour were maintained under a wide range of pH and ionic strength values (3.5 – 8.0 and 0.05 – 0.50 M NaCl, respectively). The thickening capacity of FucoPol was similar to that of commercial guar gum. The influence of temperature on steady shear and oscillatory data was also evaluated in the temperature range from 15 to 65 ºC. FucoPol has shown to form high viscosity solutions with a shear-thinning behaviour. Moreover, the viscous and viscoelastic properties at 25 ºC were maintained after consecutive heating (up to 80ºC) and cooling cycles, indicating a good thermal stability under temperature fluctuations. Therefore, the application of FucoPol as thickening agent is foreseen in aqueous solutions with variations of pH, ionic strength as well as temperature.
A preliminary study about the FucoPol´s emulsion forming and stabilizing capacity, as well as flocculating activity were performed. FucoPol has shown a good emulsion forming and stabilizing capacity for hydrophobic compounds, especially for food grade oils (emulsification index, E24 > 60%), similar to some commercial polysaccharides (e.g. xanthan
and pectin). Furthermore, FucoPol has also demonstrated good flocculating capacity (28%), in the same range of some commercially available products (e.g. xanthan and carboxymethilcellulose).
xi
Abbreviations
ANOVA Analysis of Variance
CCRD Central Composite Rotatable Design
CDW Cell Dry Weight
CMC Carboxymethylcellulose
DO Dissolved Oxygen
DSMZ Deutsche Sammlung von Mikroorganismen und Zellkulture EMBL European Molecular Biology Laboratory
EPS Exopolysaccharide
FT-IR Fourier Transform Infra-Red spectroscopy GRAS Generally Recognized As Safe
HMO Human Milk Oligosaccharides
HPLC High Performance Liquid Chromatography
IS Ionic Strength
MLR Multiple Linear Regression
O/W Oil/Water
PCR Polymerase Chain Reaction
PD Polydispersity
xii
SS Sum of Squares
TCA Trichloroacetic Acid TFA Trifluoroacetic Acid
Variables
A Pre-exponential factor
A Optical density of the control in flocculating activity determination Acet Acetyl content (wt.%)
Temperature-dependent shift factor
B Optical density of the sample in flocculating activity determination
b0 Coefficient estimate for interception bi Coefficient estimate for linear correlation bij Coefficient estimate for quadratic correlation
Temperature density ratio
C FucoPol concentration
C:N ratio Carbon to nitrogen ratio (w/w)
D Dilution rate (h-1)
dn/dc Refractive index increment (mL g-1)
xiii
F Inlet feed rate in the fed-batch phase (L h-1)
F Frequency (Hz)
Fuc Fucose content (%mol)
G’ Storage modulus (Pa)
G’’ Loss modulus (Pa)
Gal Galactose content (%mol) Glc Glucose content (%mol)
GlcA Glucoronic acid content (%mol) GlcN Glucosamine content (%mol)
Height of the emulsion layer (mm) Overall height of mixture (mm)
K Consistency index (Pa s-1)
Kd Specific death rate (h-1)
kH Huggins coefficient (dimensionless) kk Kramer coefficient (dimensionless)
KM Martin polymer-polymer interaction parameter (dimensionless) KN Nitrogen half saturation constant (g L-1)
KS Glycerol half saturation constant (g L-1)
M Dimensionless constant related to the exponent of the power law
mS Maintenance coefficient on glycerol (g g-1 h-1)
xiv
N Power law index
N0 Inlet nitrogen concentration (g L-1) P EPS concentration (g L-1)
pH pH (dimensionless)
Pyr Pyruvyl content (wt.%)
qp Specific productivity (gEPS gCDW-1 d-1) R Gas constant (kJ mol-1 K-1)
Rha Rhamnose content (%mol)
rp EPS volumetric productivity (g L-1 d-1)
Succ Succinyl content (wt.%)
S Glycerol concentration (g L-1)
S0 Inlet glycerol concentration (g L-1)
T Time (d)
T Temperature (ºC)
T0 Reference temperature (ºC)
V Volume (L)
vS Specific rate of glycerol uptake (g g-1 h-1) vN Specific rate of nitrogen uptake (g g-1 h-1) vP Specific rate of EPS production (g g-1 h-1) X Biomass concentration (g L-1)
xv
YP/S Yield of EPS on glycerol (g g-1) YX/N Yield of biomass on nitrogen (g g-1) Yp Predicted responses in RSM
Greek letters
Axial level in RSM
Yield of product synthesis per biomass produced (g g-1) Pre-exponential factor of the power law regression
Β Specific rate of non-growth associated product synthesis (g g-1 h-1) Β Exponent in the power law regression
Shear rate (s-1)
[η] Intrinsic viscosity (dL g-1)
η0 Zero-shear rate viscosity (Pa s)
ηa Apparent viscosity (Pa s)
ηsp Specific viscosity (dimensionless)
ηrel Relative viscosity (dimensionless)
η* Complex viscosity (Pa s) Dynamic viscosity (Pa s) Out-of-phase viscosity (Pa s)
xvi
Τ Shear stress (Pa)
xvii
1. Background and Motivation 1
1.1. Polysaccharides 2
1.2. Fermentative Exopolysaccharides Production 8
1.3. Motivation 11
1.4. Thesis Outline 11
2. FucoPol Standard Bioprocess Operation and Polymer Characterisation 13
2.1. Summary 14
2.2. Introduction 15
2.3. Materials and Methods 18
2.3.1. FucoPol Production 18
2.3.2. Culture Broth Characterization 24
2.3.3. FucoPol Characterization 25
2.4. Results and Discussion 27
2.4.1. Identification and Characterization of the Microorganism 27
2.4.2. FucoPol Production Process 32
2.4.3. Characterization of the Culture Broth 36
2.4.4. FucoPol Characterization 46
2.5. Conclusions 55
xviii
3.1. Summary 58
3.2. Introduction 59
3.3. Material and Methods 60
3.3.1. FucoPol Production 60
3.3.2. FucoPol Characterization 61
3.3.3. Experimental Design 62
3.4. Results and Discussion 63
3.4.1. Standard Conditions for EPS Production 64
3.4.2. Influence of Temperature and pH: Response Analysis 64
3.4.3. RSM Modelling 68
3.5. Conclusions 76
4. FucoPol: Impact of glycerol and nitrogen concentration 77
4.1. Summary 78
4.2. Introduction 79
4.3. Materials and Methods 80
4.3.1. FucoPol Production 80
4.4. Results and Discussion 81
4.4.1. Effect of Initial Glycerol and Nitrogen Concentration 82 4.4.2. Effect of Changing Glycerol and Nitrogen Concentration in the Feeding
Solution
87
4.4.3. EPS Physical-chemical Characterization 90
xix
5.1. Summary 96
5.2. Introduction 96
5.3. Materials and Methods 98
5.3.1. Preparation of FucoPol Aqueous Solutions 98
5.3.2. Rheological Measurements 98
5.3.3. Experimental Design 100
5.4. Results and Discussion 101
5.4.1. Intrinsic Viscosity 101
5.4.2. Rheological Properties under Steady and Dynamic Shear 106
5.4.3. Concentration Regimes 125
5.5. Conclusions 127
6. FucoPol: Emulsifying and Flocculating Capacity 129
6.1. Summary 130
6.2. Introduction 131
6.3. Material and Methods 133
6.3.1. Emulsion forming and stabilizing capacity 133
6.3.2. Flocculating activity 134
6.4. Results and discussion 135
6.4.1. Emulsion forming and stabilizing capacity 135
6.4.2. Flocculating activity 143
6.5. Conclusions 144
xx
7.2. Future Work 150
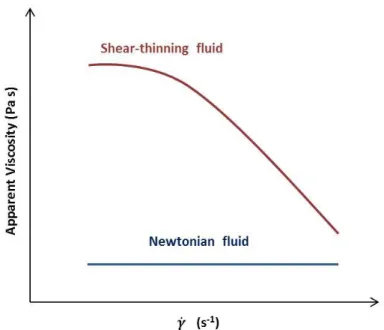
xxi Figure 2.1 Flow behaviour – Newtonian and shear-thinning – at logarithmic scale. 17 Figure 2.2 Phylogenetic analysis based on 16S rRNA gene sequences available from European Molecular Biology Laboratory (EMBL), Ribossomal Database Program (RDP) and DSMZ databases (accession numbers are given in brackets). The scale bar below the dendrograms indicates 1 nucleotide substitutions per 100 nucleotides.
31
Figure 2.3 Time course of the cultivation of Enterobacter A47 on glycerol byproduct: ( ) glycerol, (×) ammonium, (●) CDW and ( ) EPS. (a) Initial glycerol and nitrogen concentration of 25 and 0.7 g L-1, respectively; (b) Initial glycerol and nitrogen concentration of 40 and 1.1 g L-1, respectively.
33
Figure 2.4 Experimental (symbols) and modelling results (continuous lines) showing the ( ) glycerol, (×) ammonia, (●) biomass and ( ) EPS kinetics with time. The mean square errors were 0.194 g L−1, 4.09 g L−1, 0.020 g L−1 and 0.181 g L−1 for biomass, glycerol, ammonia and EPS respectively.
35
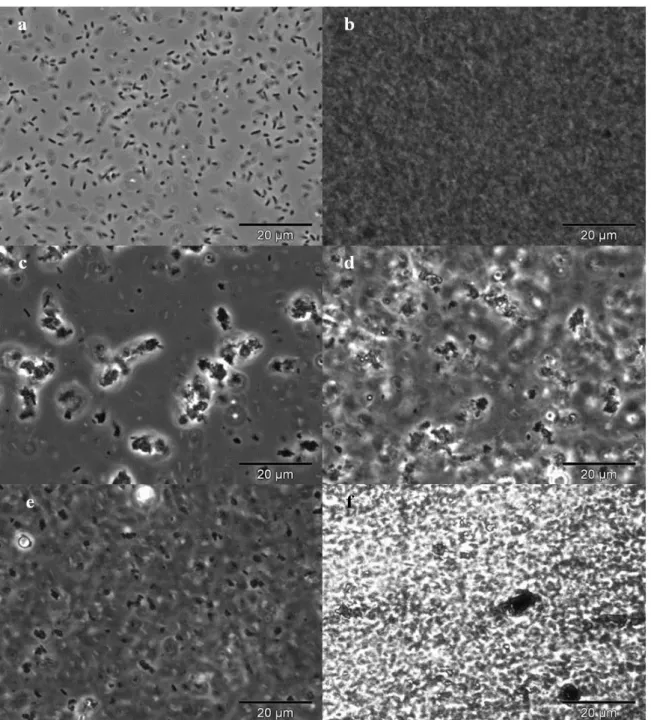
Figure 2.5 Microscopic observations of Enterobacter A47 broth samples at different cultivation times: 1.0 day (upper images: A and B), 3.0 days (middle images: C and D) and end of cultivation run (lower images: E and F), observed in phase contrast (left images) and after staining with China ink (right images).
38
Figure 2.6 Flow curves for culture broth samples at different cultivation times: (Δ) 0 days, (-) 1.0 days, (×) 2.0 days, ( ) 4.0 days, (●) 5.0 days, ( ) 6.0 days and ( ) 7.0 days. The measurements were made at 30 ●C.
40
Figure 2.7 Steady-state (A) and oscillatory data (B) of the culture broth at day 7.0 ( ), and of an aqueous solution in deionised water of the purified EPS taken at day 7.0 ( ), both samples having the same effective polymer concentration (0.81 wt%). G´ (full symbols), G´´ (open symbols).
xxii
cultivation times: (a) 4.0 days; (b) 5.0 days; (c) 6.0 days and (d) 7.0 days.
Figure 2.9 Cox–Merz plots for the broth samples isolated at days 4.0 and 7.0: (-) apparent viscosity; ( ) complex viscosity and ( ) dynamic viscosity.
46
Figure 2.10 Profile of the FucoPol neutral sugar composition (( ) glucose; ( ) galactose; ( ) fucose) (A) and acyl groups (( ) succinyl; ( ) pyruvyl and ( ) acetyl) (B) along the cultivation run.
47
Figure 2.11 Resumed diagram of nucleotide biosynthetic pathway involved in bacterial EPS synthesis by Gram- negative bacteria. NDP, nuclesoside diphosphate; UDP, uridine diphosphate; GDP, guanosine diphosphate (adapted from Freitas et al., 2011a).
48
Figure 2.12 Comparative FT-IR spectra of polysaccharides: (a) FucoPol, (b) Fucogel, (c) alginate and (d) guar gum.
51
Figure 2.13 (a) Evolution of FucoPol´s average molecular weight (Ж) and polydispersity ( ) along the cultivation run. (b) Variation of the intrinsic viscosity over time.
52
Figure 2.14 Mw chromatogram profiles for different cultivation times. 53 Figure 3.1 Response surface of specific growth rate (a); EPS concentration (b) and specific productivity (c) as a function of temperature and pH.
72
Figure 3.2 Response surface of fucose (a); galactose (b) glucose (c); glucuronic acid (d); rhamnose (e) and glucosamine (f) as a function of temperature and pH.
73
Figure 3.3 Response surface of acyl groups total content (% wt.) as a function of temperature and pH.
74
Figure 3.4 Response surface of molecular weight as a function of temperature and pH. 75 Figure 4.1 Impact of initial glycerol and nitrogen concentrations on cell growth and EPS production across the different cultivation runs (a) Run 1; (b) Run 2 and (c) Run
xxiii glycerol (g L ).
Figure 4.2 Impact of nitrogen concentration on biomass ( ) and EPS production ( ), for all the 5 runs (Stdr 1 and 2 and runs 1 to 3).
85
Figure 4.3 Impact of glycerol and nitrogen concentrations in the feeding solution. Time course of the cultivation runs: (a) Run 4, (b) Run 5 and (c) Run6 (( ) EPS (g L-1); (●) CDW (g L-1); ( ) N-NH4+ (g L-1); ( ) glycerol (g L-1)).
89
Figure 5.1 (a) Reduced viscosity as a function of FucoPol concentration in salt free solution; (b) determination of the intrinsic viscosity in 0.1 M NaCl using the Huggins ( ) and ( ) Kraemer equations.
102
Figure 5.2 Response surface plot of intrinsic viscosity [η] as a function of pH and NaCl concentration.
105
Figure 5.3 Shear rate dependence of viscosity for different concentrations of FucoPol. ( ) 0.20 wt.%; ( ) 0.35 wt%; ( ) 0.45 wt.%; ( ) 0.50 wt.%; ( ) 0.60 wt.%; (●) 0.80 wt.%; (×) 0.90 wt.%; ( ) 1.0 wt.%; ( ) 1.2 wt. %. Lines represented the fitted Cross equation.
107
Figure 5.4 Master curve obtained shifting vertically dividing by η0, and horizontally multiplying by relaxation time (τ). Inset: τ as a function of FucoPol concentration.
109
Figure 5.5 Comparative flow curves of polysaccharides (C=1%wt, 0.1M NaCl): ( ) FucoPol; ( ) Fucogel; (×) xanthan; ( ) guar gum; (●) CMC; ( ) pectin and ( ) alginate.
110
Figure 5.6 Mechanical spectra (G´( ); G´´ ( )) of FucoPol aqueous solution at different concentrations in 0.1 M NaCl. (a) 0.6 wt.%; (b) 0.8 wt.%; (c) 1 wt.% and (d) 1.2 wt.%.
111
Figure 5.7 Apparent viscosity and complex viscosity (FucoPol solution 1.0 wt.%) as a function of the shear rate and angular frequency, respectively.
xxiv
dependency on viscosity. ( ) 0.15M NaCl - pH 4.5; ( ) 0.65 M NaCl – pH 4.5; ( ) 0.15 M NaCl – pH 9.5; (×) 0.65 M NaCl – pH 9.5; ( ) 0.40 M NaCl – pH 7.0; (●) 0.40 M NaCl – pH 7.0; ( )0.40 M NaCl – pH 7.0; ( ) 0.05M NaCl – pH 7.00; ( ) 0.75 M NaCl – pH 7.00; ( ) 0.40 M NaCl – pH 3.47; ( ) 0.40 M NaCl – pH 10.54. Lines represent the fitted model.
Figure 5.9 Response surface of zero-shear viscosity (η0) as a function of pH and NaCl concentration.
115
Figure 5.10 Mechanical spectra for FucoPol solutions with different ionic strength and pH values, G´ (full symbols) and G´´ (empty symbols). (a) ( and ) 0.75 M NaCl – pH 7.00; ( and ) 0.05 M NaCl – pH 7.00; (b) ( and ) 0.40 M NaCl – pH 7.00; (c) ( and ) 0.40 M NaCl – pH 3.45; ( and ) 0.40 M NaCl – pH 10.54.
116
Figure 5.11 Flow curves for a 0.81 wt.% FucoPol solution at different temperatures: ( ) 15ºC; ( ) 25ºC; ( ) 30ºC; ( ) 45ºC; ( ) 55ºC; ( ) 65ºC.
117
Figure 5.12 (a) Mechanical spectra of 0.81wt.% FucoPol solution at 15 ºC (squares) and 65 ºC (triangles), G´- full symbols; G´´ - open symbols. (b) Dynamic viscosity η´ (full symbols) and out of phase viscosity η´´ (open symbols) as a function of the applied frequency for 15 ºC (squares), 45 ºC (bullets) and 65 ºC (triangles).
120
Figure 5.13 Frequency and temperature superposition of the loss (G´´) and storage (G´) moduli. The solid line represents the data for the reference temperature (25 ºC) and the symbols correspond to the other temperatures: ( ) 15 ºC; ( ) 30 ºC; ( ) 45 ºC; ( ) 55 ºC; ( ) 65 ºC.
121
Figure 5.14 Temperature dependence of: apparent viscosity at shear rate 5 s-1( ) and 13 s-1 ( ); zero-shear rate viscosity estimated by the Carreau model ( ). The lines correspond to Arrhenius equation.
123
Figure 5.15 Data measured at 25 ºC before (open symbols) and after (full symbols) the temperature cycles: (a) flow curves; (b) dynamic moduli and (c) dynamic (η´) and out
xxv Figure 5.16 Apparent viscosity η (lines), and complex viscosity |η*| (symbols), as a function of the shear rate and angular frequency, respectively.
125
Figure 5.17 Concentration dependence of zero-shear specific viscosity for FucoPol samples. Dotted line: Martin model
126
Figure 6.1 Flow curves of emulsions prepared with different polymer concentrations ((a) 0.50 wt.%; (b) 1.00 wt.% and (c) 1.50 wt.%) and different oil-water proportions: 20/80 (diamonds); 40/60 (bullets); 60/40 (squares); 80/20 (triangles).
139
Figure 6.2 Mechanical spectra showing the frequency dependence of G´ (full symbols) and G´´ (open symbols). (a) 0.50 wt.% (b) 1.00 wt.% (c) 1.50 wt.%. O/W ratios: 20/80 (diamonds); 40/60 (bullets); 60/40 (squares); 80/20 (triangles).
141
Figure 6.3 Mechanical spectra showing the frequency dependence of G´ (full symbols) and G´´ (open symbols). (a) 20/80 (b) 40/60 (c) 60/40 (d) 80/20. FucoPol wt.%: 0.5 (triangles); 1.0 (bullets); 1.5 (diamonds.).
142
Figure 6.4 Flocculating activity of FucoPol in comparison with commercially available flocculants
xxvii Table 2.1 Biochemical and physiological characteristics of Enterobacter A47 in comparison with related species type strains Enterobacter pyrinus KCTC 2520T, E. hormaechei ATCC 49162T and E. asburiae ATCC 35953T
29
Table 2.2 16SrDNAgene sequence of the bacterium Enterobacter A47 (DSM 23139) 30 Table 2.3 Maximum yields and Michaelis-Menten constant for glycerol uptake 36 Table 2.4 Power Law parameters for Enterobacter A47 broth samples taken at different cultivation times
41
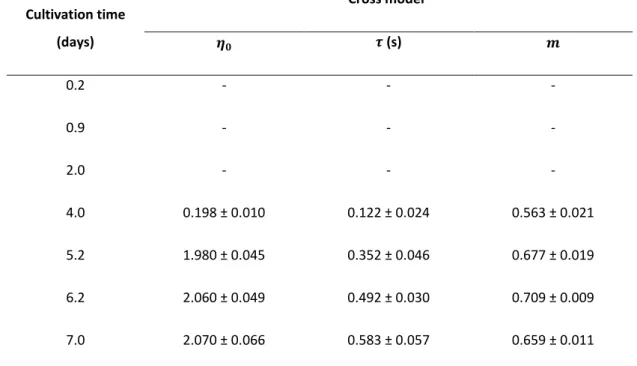
Table 2.5 Cross model parameters for Enterobacter A47 broth samples taken at different cultivation times
44
Table 3.1 Central composite rotatable design (CCRD) with two independent variable,
X1 (Temperature, T) and X2 (pH), and the observed responses studied, Yi (μ, specific
growth rate; EPSmax, maximum EPS concentration; qP, specific productivity; Fuc,
fucose, Gal, galactose; Glc, glucose; Rha, rhamnose; GlcN, glucosamine; Pyr, pyruvyl; Succ; succinyl; Acet, acetyl; Mw, average molecular weight)
67
Table 3.2 Model and lack of fit p-values (significance levels) and R2 values for the analysis of variance (ANOVA) for the responses of the central composite design
69
Table 3.3 Constants and coefficients of polynomial models and p-values for both linear and quadratic effects and interaction of temperature and pH for the several responses (Yn)
71
Table 4.1 Kinetic parameters during batch and fed batch phase, as well as global values for the standard cultivation runs (section 2.4.2 – Chapter 2) and for runs 1 – 6
86
Table 4.2 Physical-chemical EPS characterization: sugar composition (%mol); acyl groups content (wt.%) and average molecular weight
92
xxviii
viscosity, [η]) and Y2 (zero-shear rate viscosity, η0)
Table 5.2 Analysis of variance of the second order model for parameter [η] (intrinsic viscosity)
104
Table 5.3 Cross model parameters estimated for different FucoPol concentrations 108 Table 5.4 Analysis of variance of the second order model for parameter η0 (zero shear viscosity from Cross model fitting)
115
Table 5.5 Parameters of Carreau model for the range of temperatures studied 118 Table 5.6 Shift factors of Time-Temperature Superposition 121 Table 6.1 Emulsification index (E24) for FucoPol and commercially available emulsion forming and stabilizing agents against several hydrophobic compounds. All emulsions were prepared by mixing a 0.5wt% aqueous solution with each of the hydrophobic compound (3:2 v/v ratio) and left at room temperature for 24 h to determine E24
136
Table 6.2 Emulsification index (E24) for FucoPol against sunflower oil and apparent viscosity at a shear rate 1 s-1 for FucoPol solutions and emulsions with different O/W proportions
137
1
Chapter 1
2
Polysaccharides have a wide spectrum of applications due to their functional
properties (e.g. thickening, emulsifying, stabilizing and/or gelling capacity). Indeed,
polysaccharides are currently used in all sectors of human activity, namely food and feed
products, personal care products, medicine, pharmaceuticals, paper, oil drilling and paints,
among others (Elnashar, 2011). Even when present at low concentrations (less than 1%),
polysaccharides may have a significant influence on the products textural properties and on
the efficiency of industrial processes (Phillips and Williams, 2009).
Being materials obtained from living organisms, natural polysaccharides are usually
non-toxic and biodegradable, a feature that turns them into attractive biomaterials for
sustainable development. Polysaccharides are widely distributed in nature: they can be
found in plants, animals, algae and microorganisms, performing different fundamental
biological functions (Reis et al., 2011; Elnashar, 2011).
Microbial polysaccharides often have improved or new properties, comparing to
polysaccharides from other natural sources (e.g. plants and algae). Hence, in the last years,
the demand for novel microbial polysaccharides with interesting properties for industrial
applications has greatly increased.
1.1. Polysaccharides
Polysaccharides are high molecular weight (104– 107) polymeric biomaterials with a large structural diversity, being composed of one or more monosaccharides joined by
glycosidic bonds, often forming repeating units and presenting different degrees of
branching (Sutherland, 2001; Reis et al., 2008). They are mainly composed of
carbohydrates, such as neutral sugars (e.g. galactose, glucose), acidic sugars (e.g. glucuronic
acid, galacturonic acid) and amino sugars (e.g. glucosamine,
3
namely organic acyl groups (e.g. acetyl, succinyl and pyruvyl) and inorganic groups (e.g.
sulphate, phosphate) (Sutherland, 1982). The presence of some acyl groups (e.g. succinyl
and pyruvyl), as well as acidic or amino sugars, confers the polymers a polyelectrolyte
character (Freitas et al., 2011).
Polysaccharides may be composed of a unique sort of monosaccharide
(homopolysaccharides) or comprise two or more different monosaccharides
(heteropolysaccharides). Besides that, in some cases, single polysaccharide chains may
associate with each other through intra or intermolecular non-covalent bonds, conferring to
the macromolecule a certain geometry and rigidity, which will determine the polymer´s
properties both in solid state and in solution (Kumar et al., 2007; Reis et al., 2011).
In Nature, polysaccharides can be obtained from plants (e.g. starch, guar gum,
pectin), animals (e.g. chitin), algae (e.g. carrageenan, alginate, agar) and microorganisms
(e.g. xanthan, gellan, pullulan). They present diverse physiological roles, functioning as
structural elements, maintaining mechanical shape and rigidity of the living cells (e.g.
cellulose and pectin in plant cell wall; chitin in arthropod exoskeletons and yeast and fungi
cell walls), as energy reserve substances (e.g. starch or inulin in plants; glycogen in animals
and microorganisms), or as adhesion and protective barriers (microorganisms) (Kaplan,
1998; Kumar et al., 2007; Elnashar, 2011).
Their ability to change the physical-chemical properties of aqueous solutions (e.g.
thickening, emulsifying and stabilizing capacity), allows their application on several products
and processes, namely in the food, pharmaceutical, cosmetic, paper, paint and oil drilling
sectors. Beyond that, the capacity to form biodegradable films shown by some
polysaccharides (e.g. starch, alginate, pullulan, cellulose derivatives) enables their use in
packaging (e.g. vessels and sheets for several agro-food applications), pharmaceuticals and
other industrial applications. Their biocompatibility also enables their use in medical
applications (e.g. as scaffolds or matrices for tissue engineering, wound dressing and drug
4
Nowadays, the polysaccharides market is still dominated by products obtained from
plants and algae (e.g. starch, galactomannans, pectin, carrageenan and alginate), while
microbial polysaccharides represent only a small fraction of the market (e.g. xanthan)
(Canilha et al., 2005). In 2008, the total market value was > 4 million US$, with xanthan
being the only significant microbial polysaccharide, which accounted for 6% of the total
market value (Imeson, 2010; Freitas et al., 2011).
Microbial polysaccharides can be divided into intracellular (e.g. glycogen), structural
cell wall components (e.g. chitin) and extracellular polysaccharides. Extracellular
polysaccharides or exopolysaccharides (EPS) are polymers secreted by the cells, either as a
capsule that remains associated with the cell surface (e.g. K30 antigens) or as a slime that is
loosely bound to the cell surface (e.g. xanthan, gellan, hyaluronic acid) (Kumar et al., 2007;
Rehm, 2010). Several different EPS (e.g. dextran, xanthan, gellan) have been extensively
studied over the last decades. The research on many exopolysaccharides has relied on their
biological functions, namely as reserve materials or as part of bacterial cell protective
structure, providing an advantage under certain environmental conditions. Although the
factors leading to EPS synthesis are still not clearly elucidate, it is thought to be a response
of the microbial strains to environmental stress conditions (e.g. pH, temperature, light
intensity) (Sutherland, 1998; Kumar et al., 2007; Rehm, 2010; Donot et al., 2012).
Some microbial EPS can replace polysaccharides extracted from plants (e.g. guar
gum or pectin) or algae (e.g. carrageenan or alginate) in traditional applications, due to their
improved physical properties (e.g. xanthan or gellan gum). On the other hand, other
microbial EPS possess unique and superior properties that enable the development of new
commercial opportunities (Freitas et al., 2011). For this reason, in recent years, there has
been an increasing demand for the identification and isolation of new microbial
polysaccharides that can compete with traditional polymers due to their improved physical
and chemical properties: higher emulsifying and flocculating activities; resistance to
solvents; biological activity (e.g. anticarcinogenic and immunoenhancing effects); and
5
greater stability to a wide ranges of temperature, pH and ionic strength) (Kumar et al.,
2007; Sutherland, 2001).
Furthermore, microbial polysaccharides production is advantageous comparing with
that of plant and algae-derived polysaccharides, since it is usually more productive and less
resource intensive, and relies on controlled fermentation processes, with more degrees of
freedom to control product composition, yield and productivity (Moreno et al., 1998). On
the other hand, plants, algae and animals have life cycles of months or years, being the
production cycle usually seasonal. Moreover, they are subjected to climatic and
environmental impact, such as pollution, which causes great variability in the quantity and
quality of the final products.
However, for new microbial polysaccharides to conquer the market as commodity
products, it is crucial to lower their production costs (Rehm, 2010), which can be performed
by: (i) using low cost substrates, (ii) improving product yield by optimizing fermentation
conditions, (iii) developing higher yielding strains (e.g. by mutagenesis or genetic
manipulation), and (iv) optimizing downstream processing. The great opportunity to
bacterial EPS to be developed at industrial scale and commercialized relies on high value
market niches (e.g. cosmetics, pharmaceuticals and biomedicine), since microbial
polysaccharides may present the desired degree of purity and functional properties that the
traditional polysaccharides obtained from plants and algae may not have. In this case, the
potential designed characteristics and quality of the product will exceed production costs
and product yield issues (Freitas et al., 2011).
Table 1 summarizes the main characteristics of some of the microbial
polysaccharides that are currently commercialized. Dextran was the first microbial
polysaccharide to be commercialized and approved for food applications by FDA (US Food
and Drug Administration). Nowadays, xanthan, produced by Xantomonas campestris, is the
most widely accepted microbial polysaccharide. It has been granted a GRAS (Generally
Recognized as Safe) status, and is used in many manufactured foods, as well as in cosmetics
6
high stability under a large range of pH and temperature conditions (Garcia-Ochoa et al.,
2000; Sutherland, 2002; Freitas et al., 2011). Gellan is another GRAS polysaccharide
produced by Sphingomonas paucimobilis. It is mainly used in food applications due to its
great gelling capacity that allows it to be used at a much lower concentration than agar
(Sutherland, 2002; Bajaj et al., 2007; Freitas et al., 2011).
Bacterial cellulose is a high-value product, produced by Acetobacter sp.. Its purity
and fibres orientation makes them very suitable to form audio membranes with great
quality. Bacterial cellulose is also known to be an immune stimulant and tumour
suppressive agent (Sutherland, 2002; Chawla et al., 2009). Other commercial
polysaccharides with interesting properties are hyaluronic acid and succinoglycan, which
have found medical, pharmaceutical and cosmetic applications due to their resemblance to
u n d a n d M o ti vat ion 7 References
Sanford et al. (1984) Garcia-Ochoa et al. (2000) Sutherland (2002) Rehm (2010) Freitas et al, (2011)
Sutherland (2002) Bajaj et al. (2007) Banik et al. (2007) Rehm (2010) Freitas et al. (2011)
Qader et al. (2005) Rehm (2010) Freitas et al. (2011)
Sutherland (2002) Chawla et al. (2009) Rehm (2010) Freitas et al. (2011)
Rinaudo (2008) Liu et al. (2009) Rehm (2010) Freitas et al. (2011)
Sutherland (2002) Rehm (2010) Freitas et al. (2011)
Main applications
Foods
Petroleum Industry Pharmaceuticals Cosmetic and personal care products Drilling muds Foods Pharmaceuticals Pet foods Plant biotechnology Foods Pharmaceutical industry: blood-plasma volume expander Chromatographic media Audio Systems Biomedical: wound healing; tissue engineered blood vessels
Medicine Cosmetic
Solid culture media
Food Oil recovery
Main properties
High viscosity Stability over a wide range of temperatures and pH
Emulsifier
Stability over a wide range of pH Gelling capacity Thermoreversible gels Good stability Newtonian fluid behaviour High crystallinity Insolubility in most solvents
High tensile strength Moldability Biocompatible Biological activity Highly hydrophilic Viscous shear-thinning aqueous solution Stability in acidic condition Composition Glucose Mannose Glucuronic acid Acetate Pyruvate Glucose Rhamnose Glucuronic acid Acetate Glycerate Glucose Glucose Glucuronic acid N-acetyl-glucosamine Glucose Galactose Acetate Pyruvate Succinate Microorganism Xanthomonas campestris Sphingomonas paucimobilis Leuconostoc mesenteriodes Streptococcus sp.
Acetobacter sp.
Pseudomonas aeruginosa Streptococcus sp.
Agrobacterium sp.
8
1.2. Fermentative exopolysaccharides production
In the design of any microbial process it is necessary to take into account the type of
product that is to be produced. Hence, certain EPS are growth associated products (e.g.
bacterial alginate), being synthesized only during the cell growth phase, while others are
growth dissociated products, which are synthesized only in the post-stationary growth
phase (e.g. curdlan). On the other hand, many microorganisms show a partially
growth-associated EPS production trend, with polymer synthesis being initiated during the
exponential growth phase and proceeding with identical production rate when cell growth
is restricted.
Furthermore, there are no standard operational conditions for bacterial EPS
production. In fact, EPS-producing microorganisms differ widely in their carbon and
nitrogen source utilization, oxygen and mineral requirements, optimal temperature and pH.
The amount of EPS produced is strongly influenced by the nutritional and environmental
conditions (Sutherland, 2001; Donot et al., 2011), which may be manipulated to achieve
improved production (Kumar et al., 2007). Usually, polysaccharides production processes
require excess of carbon source, concomitant with limitation of another nutrient (e.g.
nitrogen or phosphate) (Bajaj et al., 2007, Rehm, 2010; Freitas et al., 2011). Most microbial
EPS are produced under aerobic conditions. However, some EPS-producing strains need
maximal aeration (e.g. Xanthamonas sp.), while for others the production is maximized
under microaerophilic conditions (e.g. Azotobacter vinelandii) (Peña et al., 2000; Rehm,
2010). Production is also frequently favoured under sub-optimal incubation temperatures
(Sutherland, 2001) and pH (Kumar et al., 2007). Furthermore, in some cases the production
is stimulated by supplementation of the production medium with surfactants (e.g. Triton
X-100), vitamins and aminoacids (e.g. tryptophan) and cations (e.g. Ca2+ and Mg2+) (Bajaj et al., 2007; Kumar et al., 2007; Freitas et al., 2011).
For most of the EPS-producing microorganisms, the growth conditions do not
9
al., 2011). However, their content in substituent groups can vary extensively, which greatly
affects polymer properties. An exception has to be made for some EPS-producing organisms
(e.g. Rhizobium and Pseudomonas), for which EPS composition may be affected by medium
composition, as well as incubation conditions (Freitas et al., 2011). Thus, bioprocesses
based on those bacteria can be used for the production of tailor made polymers.
Many EPS producers are also able to accumulate variable amounts of intracellular
storage products (e.g. glycogen or polyhydroxyalkanoates), thus reducing their full potential
for EPS production. Xanthomonas sp. is an exception to this, since those bacteria do not
produce significant amounts of other bioproducts, which allows achieving very high
substrate conversion into xanthan (Rehm, 2010).
Most EPS-producing microorganisms use substrates with a high degree of purity,
which increases the production costs. The most common carbon sources used to produce
microbial polysaccharides are sugars, mainly glucose, but also fructose, sucrose, lactose,
maltose, mannitol and sorbitol (Bajaj et al., 2007; Kumar et al., 2007; Reis et al., 2008).
In order to reduce polysaccharide production costs it is desirable to use abundant
and less expensive carbon sources, such as agro-food and industrial wastes and byproducts.
A large amount of wastes/byproducts are generated by several agricultural activities and
industrial processes, such as sugarcane molasses, cheese whey and glycerol from the
biodiesel industry. Several byproducts and wastes (e.g. sugar cane molasses, cheese whey,
waste sugar beet pulp, peach pulp) have been tested as substrates for xanthan production,
achieving competitive results. Nevertheless, the industrial process is still based on glucose
and sucrose due to the higher production yields and product quality they enable
(Kalogiannis et al., 2003; Rosalam and England, 2006; Silva et al., 2009). Cheese whey and
molasses, that have high sugar contents, have also been successfully tested as raw materials
10
In the bio-combustible industry, the biodiesel byproduct, rich in glycerol, has
become a stream for which there is an urgent need of alternative applications, in order to
reduce its industrial stocks and make biodiesel production a more cost effective process.
Biodiesel is made through a chemical catalysed reaction, transesterification, which occurs
between oils or fats and an alcohol, usually methanol, with the production of glycerol as a
byproduct (10% of the total biodiesel produced) (Temudo et al., 2008).
As such, glycerol is being generated in large quantities (~2.1million tons/year), far
beyond current consumption in traditional applications, thus making it a product for which
interesting applications are lacking. Pure glycerol is used for different industrial
applications, such as soaps, paints, foods, pharmaceuticals (Temudo et al., 2008). However,
glycerol byproduct from the biodiesel industry contains residual methanol, NaOH,
carry-over fat/oil, some esters, and low amounts of sulphur compounds, proteins and minerals
(Thompson et al., 2006), which make it inadequate for use in many of the traditional
glycerol applications (e.g. food, pharmaceutical, and cosmetic industries), unless costly
purification steps are performed (Freitas et al., 2009a).
The use of glycerol byproduct as a carbon source in microbial processes is a good
way to increase its consumption and valorisation. It has been tested in fermentation
processes to produce several microbial products, such as lipids (Papanikolau et al., 2002),
pigments (Narayan et al., 2005) and ethanol, succinate, acetate, lactate and hydrogen
(Dharmadi et al., 2006). Furthermore, glycerol is a potential carbon source for protein
production by Pichia pastoris (Çelik et al., 2008) and for the production of polymers, namely
PHA (Ashby et al., 2005), exopolysaccharides (Freitas et al., 2009a) and chitin-glucan
11
1.3. Motivation
Bearing in mind that renewable resources, like industrial wastes/byproducts, may be
regarded as potential alternative substrate sources for biopolymers production, in this PhD
thesis, a process was studied to valorise glycerol byproduct from the biodiesel industry with
the production of a novel value-added bacterial fucose-rich exopolysaccharide (Reis et al.,
2008) that was named FucoPol.
The following main objectives were envisaged:
1. Setting the standard cultivation process and optimization of bioreactor operation, by
studding the effect of environmental conditions (pH and temperature) and nutrient
concentration (nitrogen and glycerol) aiming at maximizing FucoPol productivity.
2. Polymer characterisation, in terms of its chemical composition (sugars and
substituent groups); molecular weight; rheology and functional properties (emulsion
forming and stabilizing ability and flocculating capacity).
1.4. Thesis outline
This thesis is divided into seven chapters, describing the work performed during this
PhD project. The methodology used in each individual chapter is detailed in the context of
the respective subject and, when applicable, is related to that used in previous chapters.
Chapters 2, 3 and 4 are dedicated to FucoPol production and process optimization. Chapters
5 and 6 describe FucoPol’s properties. The work performed during this PhD resulted in five scientific papers, which have been published in international scientific publications, while
12
Chapter 1 introduces the subject of this thesis, by presenting the context and
motivation for this PhD work.
Chapter 2 presents the morphological, physiological and genetic characterisation of
the strain, which was named Enterobacter strain A47 and deposited at DSMZ with accession
number 23139, under the Budapest Treaty. It also describes the standard cultivation for
FucoPol production and its physical-chemical characterisation, as well as the morphological
and rheological characterisation of the fermentation broth.
Chapter 3 and Chapter 4 describe the studies performed for the optimization of
FucoPol production. Chapter 3 focused on the interactive effect of temperature and pH
using multivariate statistical analysis, while in Chapter 4, the effect of glycerol and nitrogen
concentration on FucoPol production was studied.
Chapter 5 describes FucoPol’s behaviour in aqueous solution, in a diluted regime (intrinsic viscosity) and in a concentrated regime: steady shear and viscoelastic properties.
The effect of salt concentration, pH and temperature, on such properties, was assessed by
using statistical tools.
Chapter 6 presents a preliminary study of the emulsion forming and stabilizing ability
of FucoPol, as well as its flocculating capacity, in order to better understand the FucoPol´s
potential applications, namely in the cosmetic, food and pharmaceutical industry.
The main conclusions obtained in this PhD thesis are presented in Chapter 7. Some
13
Chapter 2
FucoPol
Standard Bioprocess Operation
and Polymer Characterisation
The results presented in this chapter were published in three peer reviewed papers.
Alves, V.D., Freitas, F., Torres, C.A.V., Cruz, M., Marques, R., Grandfils, C., Gonçalves,
M.P., Oliveira, R., Reis, M.A.M., 2010. Rheological and morphological characterization of the
culture broth during exopolysaccharide production by Enterobacter sp. Carbohydrate
Polymers, 81, 758-764.
Freitas, F., Alves, V.D., Torres C.A.V., Cruz, M., Sousa, I., Melo, M.J., Ramos, A.M.,
Reis, M.A.M., 2011. Fucose-containing exopolysaccharide produced by the newly isolated
Enterobacter strain A47 DSM 23139. Carbohydrate polymers, 83, 159-165.
Torres, C.A.V., Marques, R., Antunes, S., Alves, V.D., Sousa, I., Ramos, A.M., Oliveira,
R., Freitas, F., Reis, M.A.M., 2011. Kinetics of production and characterization of the
fucose-containing exopolysaccharide from Enterobacter A47. Journal of Biotechnology, 156, 4,
14
2.1 Summary
A fucose-containing exopolysaccharide (EPS) – FucoPol – was produced by the
bacterium Enterobacter A47 using glycerol byproduct from the biodiesel industry. Kinetic
parameter values estimated by a MATLAB model were in agreement with experimental data
and suggested that EPS synthesis was partially growth associated. The culture broth was
characterized in terms of its morphological and rheological properties throughout the
cultivation run. Microscopic observations revealed the formation of cell aggregates
surrounded by the EPS at the beginning of the cultivation run, while, at the end, aggregates
were reduced and an EPS matrix with the cells embedded in it was observed. The apparent
viscosity of the culture broth increased over time, which was attributed to the increase of
the FucoPol concentration in the first period of the cultivation run. However, in the final
stage, the creation of new polymer interactions within the complex culture broth was likely
the reason for the viscosity increase observed, since there was not a significant variation of
the FucoPol concentration, average molecular weight or chemical composition. The broth
presented a Newtonian behavior at the beginning of the run, changing to shear thinning as
the EPS concentration increased, and revealed to follow the Cox–Merz rule.
FucoPol was composed by neutral sugars, namely fucose (32 – 36 %mol), galactose
(25 – 26 %mol) and glucose (28 – 34 %mol), and acidic sugar, glucuronic acid (9 – 10 %mol).
It had also acyl groups substituents, acetyl (3 – 5 wt.%), pyruvyl (13 – 14 wt.%) and succinyl
(2 wt%). The neutral sugars relative proportion was measured throughout the cultivation run
and a considerably variation was observed. At the beginning (1 day), glucose was the main
component (83 %mol), while at the end (4 days) it was composed of 32 % mol fucose, 25
%mol galactose and 34 %mol glucose. The acyl groups content and composition have also
changed.Moreover, the molecular weight has increased linearly during the run (from 8x10⁵
to 5x10⁶). The changes observed in EPS composition and molecular weight had also had an
impact upon the polymer’s intrinsic viscosity, as shown by its linear increase from 3.95 to
10.72 dL g-1. The results suggest that the culture might have synthesized at least two distinct
EPS, with different sugar composition and average molecular weight, which predominated at
15
2.2. Introduction
Although the interesting physical properties that microbial polysaccharides may
presented, certain microbial exopolysaccharide (EPS) have an increased value due to their
content in some rare sugars, such as fucose or rhamnose, which occur rarely in Nature and
are difficult to obtain (Vanhooren and Vandamme, 2000). One of those rare sugars is fucose.
Fucose-containing polymers are particularly interesting due to their biological properties. It
has been reported that preparations with fucose-containing oligo- and polysaccharides, as
well as fucose monomers, have biological properties that potentiate their therapeutic use,
for example, as anti-carcinogenic and anti-inflammatory agents, in the treatment of
rheumatoid arthritis, in age-related pathologies accompanied by tissue loss, in the
acceleration of wound healing and as hydrating and anti-aging additives (Cescutti et al.,
2005; Péterszegi et al., 2003). There is also a growing interest in the use of fucose or
fuco-oligosaccharides for the synthesis of human milk fuco-oligosaccharides (HMO) that are used as
additives in infant formulae. HMOs are important for enhancing the protection of infants
against enteric and other pathogens, especially in early development (Chaturvedi et al.,
2001; Coppa et al., 2006: Romeo et al., 2010).
Oligo- and polysaccharides containing fucose may be found in microorganisms,
plants, seaweeds and animals (Vanhooren & Vandamme, 1999). Microorganisms producing
exopolysaccharides rich in fucose include a wide range of bacteria, fungi and microalgae.
Extensively studied bacterial fucose-containing extracellular polysaccharides include colanic
acid, fucogel and clavan. Colanic acid is a polysaccharide composed of fucose, glucose,
galactose and glucuronic acid, and the acyl groups pyruvyl and acetyl (Grant et al., 1969). It is
commonly produced by many members of the family Enterobacteriaceae, including
Escherichia, Salmonella and Klebsiella strains (Ratto et al., 2006). Fucogel is a polysaccharide
produced by Klebsiella pneumoniae I-1507, composed of galactose, 4-O-acetyl-galacturonic
acid and fucose (Guetta et al., 2003). It has been successfully commercialized by Solabia
BioEurope, France (www.solabia.com), for the cosmetic industry (Paul et al., 1999). Clavan is
composed of glucose, galactose, fucose and pyruvyl, being produced by Clavibacter
16
Among the genus Enterobacter, several species have been reported to secrete
exopolysaccharides containing fucose. Examples include: Enterobacter sp. CNCM 1-2744 that
produces an EPS in which fucose, galactose, glucose and glucuronic acid monomers are
present in a ratio of 2:2:1:1 (Philbe, 2002), Enterobacter sp. SSYL (KCTC 0687BP) that
produces an EPS in which fucose represents 8-10% of the sugar content, being glucuronic
acid the main component (40-70%) (Yang, 2002), Enterobacter sakazakii, strains ATCC 53017,
ATCC 29004 and ATCC 12868 that produce an EPS in which fucose represents 13-22% (Harris
& Oriel, 1989) and Enterobacter amnigenus that produces a heteropolymer containing
glucose, galactose, fucose, mannose, glucuronic acid and pyruvil (Cescutti et al., 2005). More
recently, an E. ludwiggi strain isolated from the Chernobyl exclusion zone has also been
reported to synthesize a fucose-containing EPS (Pawlicki-Julian et al., 2010). This polymer is
composed by neutral sugars and uronic acids in a ratio of 90/10, the neutral sugars are
fucose, galactose and glucose in a molar ratio of 2:1:1.
The maximum possible productivity and product concentration that can be obtained
in any biochemical process are limited by microbial kinetics and by mass transport
phenomena occurring during it. The latter is influenced by the mixing degree and
hydrodynamic conditions in the process. These parameters are related to the fluid flow
characteristics that determine mass (oxygen, carbon source and other nutrients) and heat
transfer rates in bioreactors (Bandaiphet & Prasertsan, 2006). Hence, the study of the
rheological properties of culture broths is one of the keys to improved yield of the desired
microbial products.
Cultivation broths containing unicellular microorganisms of simple shape should
behave as Newtonian fluids. However, in many microbial cultivation the broths are much
more complex and deviations from Newtonian behaviour are significant. The broths may
exhibit different types of behaviour, depending on their stage of development during the
cultivation. In a number of industrially important cultivation processes the broth develops
shear thinning behaviour (Figure 2.1). Examples of such behaviour include industrially
important microbial polysaccharides, such as xanthan gum that is producedby Xanthomonas
campestris (Candia & Deckwer, 1999), pullulan that is produced by Aureobasidium pullulans
(Furuse et al., 2002) and dextran that is produced by Leuconostoc mesenteroides (Landon et
17 characterisation of cellular mass changes and provide a clue to the relationship between
cellular structure and biochemical activity in a microbial cultivation.
Figure 2.1 Flow behaviour – Newtonian and shear-thinning – at logarithmic scale.
The viscosity of microbial culture broths may be influenced by physical, as well as
biological parameters, including the cultivation medium, the size of both cells and cell
aggregates formed, biomass concentration, morphological parameters and the products
being secreted into the solution (Al-Asheh et al., 2002). However, in most cases, the change
in flow behaviour in such microbial processes is attributed to the increasing extracellular
polymer concentration being produced, with negligible contribution from the cells (Landon
et al., 1993).
In this chapter, a newly isolated EPS-producing microorganism, was identified and
named Enterobacter A47. This culture was grown on glycerol byproduct from the biodiesel
industry as the sole carbon source for EPS production. A kinetic model has been developed
with the objective of describing the behaviour of the culture during its growth on glycerol
and EPS synthesis. Furthermore, the polymer was characterized in terms of its chemical
composition and average molecular weight and intrinsic viscosity along the cultivation run.
The culture broth was characterized regarding its rheological and morphological properties
throughout the cultivation run. A special attention was driven to evaluate the changes
18
In addition, the culture broth rheology was related to polymer concentration, composition
and average molecular weight, as well as to the cell concentration and morphology.
2.3. Material and Methods
2.3.1. FucoPol Production
Microorganism
The strain used in this work was isolated from a contaminated glycerol byproduct
aqueous solution. Enterobacter A47 (DSM 23139) was characterised morphologically and
biochemically (biochemical and physiological tests - Table 2.1). The 16S rRNA gene sequence
was determined by direct sequencing of PCR-amplified 16S rDNA. Gemonic DNA extraction,
PCR (Polymerase Chain Reaction) mediated amplification of the 16S rDNA and purification of
the PCR product was carried out as described by Rainey et al. (1996). Purified PCR products
were sequenced using the CEQTMDTCS-Quick Start Kit (Beckman Coulter) as directed in the
manufacturer´s protocol. Sequence reactions were electrophoresed using the CEQTM8000
Genetic Analysis System. The resulting sequence data was put into alignment editor ae2
(Maidak et al., 1999). For comparison 16S sequences were obtained from the EMBL, RDP or
DSMZ dtabases.
The phylogenetic dendogram of the bacteria Enterobacter A47 was constructed using
the ARB package (Pruesse et al., 2007). Based on the evolutionary distance values, the
phylogenetic tree was constructed by neighbor-joining method (Jukes and Cantor, 1969),
using the correlations of Saitou and Nei (1987). The root of the tree was determined by
including the 16S rRNA gene sequence of Klebsiella pneumoniae into the analysis.
19
Media
In all experiments, Enterobacter A47 was grown on a slightly modified Medium E*
(pH 7.0) (Brandl et al., 1988), with the following composition (per liter): (NH4)2HPO4, 3.3 g;
K2HPO4, 5.8 g; KH2PO4, 3.7 g; 10 mL of a 100 mM MgSO4 solution and 1 mL of a
micronutrient solution. The micronutrient solution had the following composition (per liter
of 1N HCl): FeSO4·7H2O, 2.78 g; MnCl2·4H2O, 1.98 g; CoSO4·7H2O, 2.81 g; CaCl2·2H2O, 1.67 g;
CuCl2·2H2O, 0.17 g; ZnSO4·7H2O, 0.29 g. (pH 7.0). Glycerol byproduct was added to give a
concentration between 25 and 50 g L-1. Glycerol byproduct (with a glycerol content ca. 89%)
was supplied by SGC Energia, SGPS, SA, Portugal.
Bioreactor Operation
EPS production was performed in a 2 and 10 L bioreactors (BioStat Bplus, Sartorius),
with initial working volumes of 1.8 or 8 L, respectively. Inocula for bioreactor experiments
(20%, v/v) were prepared by incubating the culture in Medium E* supplemented with
glycerol byproduct, in shake flasks, for 72 h at 30 ºC, in an incubator shaker (150 rpm).
The temperature and the pH were controlled at 30.0±0.1 ºC and 6.80±0.05,
respectively. The initial glycerol and ammonium concentration were 25 – 40 and 0.7 – 1.1 g
L-1, corresponding to a C:N ratio of 14:1 (w/w). After initial nitrogen depletion, a feeding
solution composed of Medium E* supplemented with 200 g L-1 of glycerol byproduct was fed
to the bioreactor at a constant rate (5 and 20 mL h−1 for the 2 and 10 L bioreactors,
respectively). The aeration rate (0.4 and 1.0 L/min, in the 2 and 10 L bioreactors,
respectively) was kept constant throughout the cultivation, and the dissolved oxygen
concentration (DO) was controlled by the automatic variation of the stirrer speed (300–800
rpm) provided by two six-blade impellers. During the fed-batch phase, the DO was
maintained below 10%.
Culture broth samples taken periodically during the cultivation runs were centrifuged
at 13 000 × g, for 15 min, for cell separation. The cell-free supernatant was stored at – 20 ºC
for the determination of glycerol and ammonium concentrations, and for the quantification
of the EPS produced, while the cell pellet was used for the determination of the cell dry
20
Analytical Techniques
The CDW was determined by gravimetry, after washing the cell pellet with deionized
water (resuspension in water, centrifugation at 13 000 × g, for 15 min, and, finally,
resuspension in water and filtration through 0.20 µm filters) and dried at 100 ºC, for 24 h.
Glycerol concentration in the cell-free supernatant was determined by high
performance liquid chromatography (HPLC) with an Aminex HPX-87H column (BioRad),
coupled to a refractometer. The cell-free supernatant samples were diluted in H2SO4 0.01 N
and filtered with Vectra Spin Micro Polysulphone filters (0.2 μm), at 10 000 rpm, for 10 min.
The analysis was performed at 50°C, with sulphuric acid (H2SO4 0.01N) as eluent, at a flow
rate of 0.6 mL min−1. An external standard calibration curve was constructed using glycerol
(Sigma – Aldrich 99%) solutions in concentrations within 1000 and 10 ppm.
Ammonium concentration was determined with a potentiometric sensor (Thermo
Electron Corporation, Orion 9512). Cell-free supernatant samples (1 mL) were mixed with 20
μL of ISA (Ionic Strength Adjuster) reagent, and the electric potential was measured within 5 minutes. An external standard calibration curve was constructed using NH4Cl (Panreac)
solutions (50 – 0.02 mM).
EPS Extraction
Culture broth samples were diluted with deionised water for viscosity reduction and
centrifuged at 13 000 × g for 1 h. Two methods were used for the recovery of the EPS from
the cell-free supernatant, namely:
1- Solvent precipitation with acetone
The cell-free supernatant was subjected to protein denaturation by the addition of
trichloroacetic acid (TCA) at a final concentration of 10% (reaction at 4 ºC for 15 min),
followed by their separation by centrifugation (13 000 x g, 1 h). The polymer was then
precipitated from the supernatant by the addition of cold acetone (3:1) and separated by
centrifugation (10 000 x g, 15 min). The pellet was dissolved in deionised water and freeze
21 2- Dialysis
The cell-free supernatant was subjected to thermal treatment (70 ºC, 1 h) to inactivate
bacterial enzymes that might cause polymer degradation during the subsequent purification
steps. The treated supernatant was centrifuged (13 000 × g, 1 h) to remove any remaining
cell debris and denatured proteins. Finally, it was dialyzed with a 10 000 MWCO membrane
(SnakeSkin™ Pleated Dialysis Tubing, Thermo Scientific), against deionized water (48 h, 4 ºC) and freeze dried.
Calculus
The specific growth rate (μ, h-1) was determined using the follow equation:
( ) Eq. 2.1
where (g L-1) is the cell concentration in the beginning of the run.
The yields of biomass on substrate ( , g.g-1) and EPS on substrate (( , g.g-1)
were determined by using the following equations:
Eq. 2.2
Eq. 2.3
where and are the biomass and EPS produced, respectively, and is the substrate
uptake.
The EPS volumetric productivity ( , g L-1d-1) was determined as following: