MEASURING PERCEIVED SERVICE QUALITY AND
HEALTH-RELATED QUALITY OF LIFE IN A LONG-TERM
CARE INSTITUTION
Raquel Maria Fernandes Mendes
Project submitted as partial requirement for the conferral of Master in Management of Services and Technology
Supervisor:
Prof. Teresa Sofia Grilo, Assistant Professor, ISCTE Business School, Department of Marketing, Operations and Management
Co-supervisor:
Prof. Ana Lúcia Martins, Assistant Professor, ISCTE Business School, Department of Marketing, Operations and Management
i Acknowledgments
This project represents the end of a very wanted and important phase of my life – the master degree. For that reason, there are some people who helped me throughout this project that really deserve my special thanks.
First, I want to thank everyone from the long-term care institution, where the study was conducted, that received me very well and helped me anytime I needed. A special thanks to the participants that answered my questionnaire and treated me with a lot of kindness. I also want to thank my supervisor and co-supervisor for the constant support and motivation, extreme dedication, and availability to help me whenever it was necessary. I thank my boyfriend for the motivation and patience during this year.
Finally, I must thank my mother for being my big inspiration and for encouranging me to always do better and to never give up. I want to thank for always believing in me and for showing me that I am capable of doing anything that I want to.
iii Abstract
The long-term care institutions provide both health and social care services, which help patients with dependencies perform their activities of daily life. Additionally, these institutions provide treatment, rehabilitation, and clinical supervision to the patients. With the aging population, chronic diseases, and dementia increasing, the demand for this type of care is expected to increase. Under this context, the principal aim of this research is to analyse if there is an association between the patients’ perceptions of the overall perceived service quality of the long-term care institution in study and the health-related quality of life of the patients. For that, it was used a questionnaire composed by 3 sections (relating to the personal characteristics; the assessment of health-related quality of life by QALYs through EQ-5D-3L; and the assessment of perceived service quality by SERVPERF and additional dimension and items) that was administered to 35 patients in two different moments (initial and approximately 30 days after). The statistical procedures used for data analysis were: descriptive statistics, multiple linear regression, hypothesis testing, and correlation coefficients. The findings suggest that the tools used are both reliable, and that in fact there is no association between the overall perceived service quality and the health-related quality of life in this long-term care institution. In general, the personal and service characteristics do not influence neither the perceived service quality or the health-related quality of life. This study presents some limitations, so the results cannot be generalized.
Keywords: Healthcare, Long-term care, Perceived service quality, HRQoL
JEL classification: I9 – Health: Other
iv
Resumo
As instituições de cuidados continuados prestam serviços de cuidados de saúde e apoio social, que ajudam os pacientes com dependências a realizar as suas atividades diárias. Além disso, estas instituições oferecem tratamento, reabilitação e supervisão clínica aos pacientes. Com o aumento do envelhecimento da população, das doenças crónicas e de demência, é esperado que a procura por este tipo de serviços também aumente. Assim, o principal objetivo deste estudo é analisar a existência ou não de uma associação entre a qualidade de vida dos pacientes e a sua perceção da qualidade do serviço da instituição de cuidados continuados em estudo. Para tal foi utilizado um questionário composto por 3 secções (referentes às características pessoais; à avaliação da qualidade de vida pelos QALYs através do EQ-5D-3L; e à avaliação da perceção da qualidade do serviço através do SERVPERF mais uma dimensão e dois itens adicionais) que foi aplicado a 35 pacientes em dois momentos diferentes (inicial e aproximadamente 30 dias depois). Os procedimentos estatísticos utilizados para análise dos dados foram: estatística descritiva, regressão linear múltipla, teste de hipóteses e coeficientes de correlação. Os resultados sugerem que as ferramentas utilizadas apresentam consistência interna e que, de fato, não há associação entre a perceção da qualidade do serviço e a qualidade de vida dos pacientes. Em geral, as características pessoais e as características do serviço não influenciam, nem a qualidade do serviço percebido, nem a qualidade de vida dos pacientes. Este estudo apresenta algumas limitações, logo os resultados não podem ser generalizados.
Palavras-chave: Cuidados de saúde, Cuidados continuados integrados, Qualidade
percebida do serviço, Qualidade de vida
Classificação JEL: I9 – Health: Other
v Table of Contents Acknowledgments ... i Abstract ... iii Resumo ... iv List of Tables ... ix List of Figures ... x List of Graphs ... x
List of Tables in Appendixes ... x
List of Graphs in Appendixes ... xi
1. Introduction ... 1 1.1. Context ... 1 1.2. Objectives ... 4 1.3. Research question ... 4 1.4. Research methodology ... 5 1.5. Scope ... 5 1.6. Structure ... 5 2. Literature Review ... 7 2.1. Introduction ... 7 2.2. Services ... 7 2.3. Service Quality ... 8
2.3.1. Service Quality Dimensions ... 9
2.3.2. Measurement of Service Quality... 11
2.3.2.1. The SERVQUAL Model ... 12
2.3.2.2. The SERVPERF Model ... 14
2.4. Healthcare services ... 15
2.4.1. Healthcare service quality ... 15
vi
2.5. Quality of life ... 17
2.5.1. General quality of life tools ... 19
2.5.2. Social care-related quality of life tools ... 20
2.5.3. Health-related quality of life tools ... 21
2.5.4. Comparison of the tools ... 24
2.6. Conclusion ... 25
3. Methodology ... 27
3.1. Introduction ... 27
3.2. Case study approach ... 27
3.3. Investigation hypotheses ... 27
3.4. Data collection tool ... 32
3.5. Data collection methodology ... 33
3.6. Data analysis tools ... 34
3.6.1. Multiple linear regression ... 34
3.6.2. Hypotheses testing ... 35 3.6.3. Measures of association ... 36 3.7. Sequence of steps ... 37 3.8. Conclusion ... 38 4. Case Study ... 39 4.1. Introduction ... 39
4.2. Long-term care institution’s description ... 39
4.3. Sample characterization ... 40
4.4. Reliability of the measures ... 42
4.5. Global analysis ... 44
4.5.1. Global analysis of perceived service quality... 44
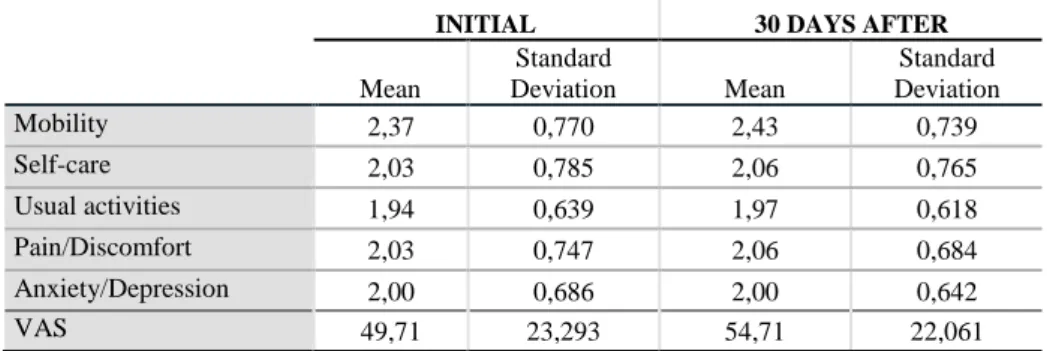
4.5.2. Global analysis of health-related quality of life ... 45
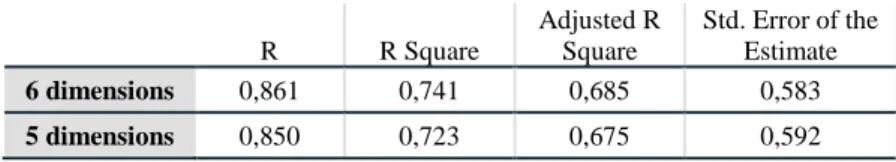
vii 4.6.1. Explanatory power of the 5 dimensions of SERVPERF and the Food dimension
in the overall perceived service quality ... 47
4.6.2. Contribution of the 5 dimensions of SERVPERF and the Food dimension in the overall perceived service quality ... 49
4.6.3. Influence of the price in the overall perceived service quality ... 51
4.6.4. Influence of both personal and service characteristics... 51
4.6.5. Association between HRQoL Improvement and Self-Rated Health Improvement ... 56
4.6.6. Association between overall perceived service quality and HRQoL Improvement ... 57 4.6.7. Summary ... 59 4.7. Discussion ... 59 4.8. Managerial recommendations ... 67 4.9. Conclusion ... 68 5. Conclusion ... 69 References ... 71
Appendix 1 – Questionnaire in Portuguese ... 83
Appendix 2 – Questionnaire in English ... 87
Appendix 3 – Descriptive statistics of personal characteristics ... 91
Appendix 4 – Descriptive statistics of personal characteristics recoded ... 92
Appendix 5 – Descriptive statistics of service quality items ... 93
Appendix 6 – Descriptive statistics of health-related quality of life variables ... 95
Appendix 7 – Multiple Linear Regression ... 96
Appendix 8 – Hypotheses testing Normality Test ... 98
Appendix 9 – Hypotheses testing Levene’s Test... 104
Appendix 10 – Hypotheses testing Parametric Tests ... 105
ix List of Tables
Table 1 - Studies about healthcare service quality ... 17
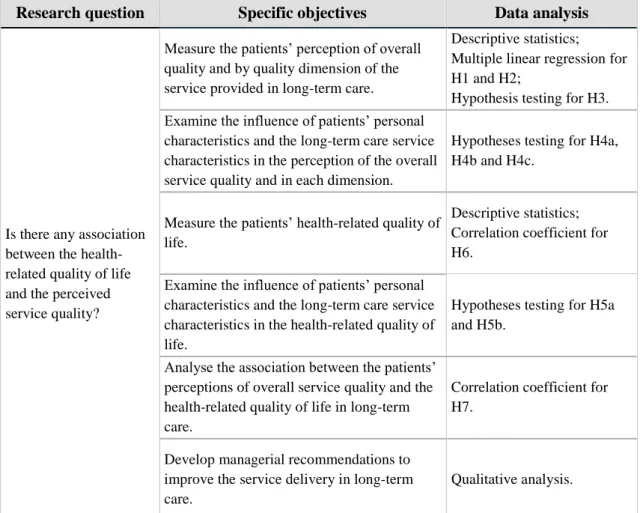
Table 2 - Summary of goals, research question and data analysis methods ... 38
Table 3 – Frequency distribution of service characteristics... 41
Table 4 - Cronbach’s alpha for the global measure of perceived service quality ... 42
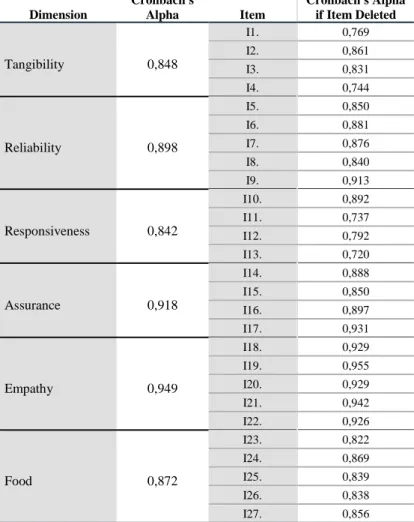
Table 5 - Cronbach’s alpha for each dimension of perceived service quality ... 43
Table 6 - Cronbach’s alpha for the measure of HRQoL ... 43
Table 7 – Descriptive statistics of perceived service quality by dimension ... 44
Table 8 - Descriptive statistics of EQ-5D dimensions ... 46
Table 9 - Coefficients of determination of the multiple linear regressions ... 49
Table 10 - Coefficients of 6 dimensions multiple linear regression ... 50
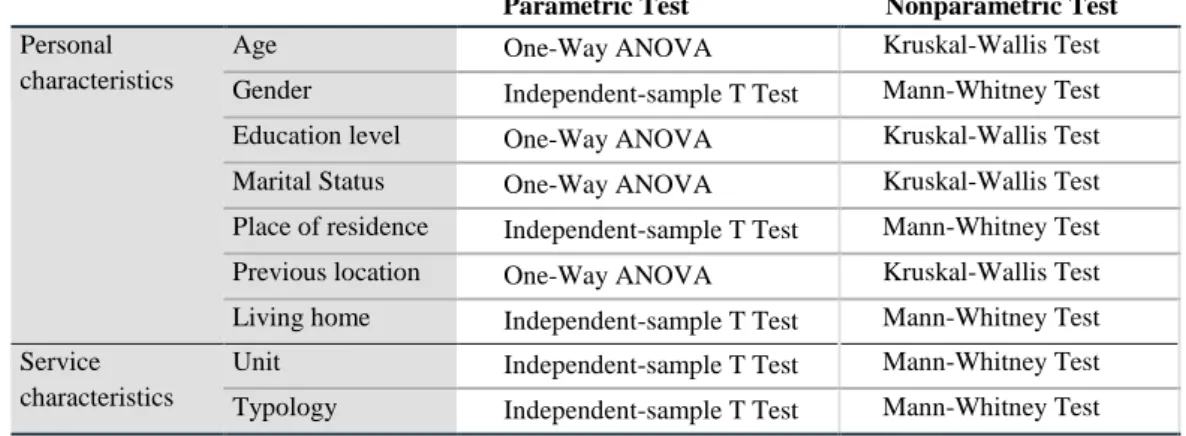
Table 11 - Summary of the independent variables and respective parametric and nonparametric tests to be conducted ... 52
Table 12 - Summary of the p-values from the parametric (in black) and nonparametric (in white) tests conducted to the dependent variables for each independent variable .... 53
Table 13 - Multiple comparison analysis of the LSD method of Fischer ... 54
Table 14 - Median and interquartile range of groups per dependent variable ... 55
Table 15 - Normality test of the variables HRQoL Improvement and Self-Rated Health Improvement ... 56
Table 16 - Spearman’s correlation coefficient for HRQoL Improvement and Self-Rated Health Improvement ... 57
Table 17 - Normality test of the variables Overall Perceived Quality and HRQoL Improvement ... 57
Table 18- Spearman’s correlation coefficient for Overall Perceived Quality and HRQoL Improvement ... 58
x
List of Figures
Figure 1 - Parasuraman et al. (1985) Gap Model ... 10
Figure 2 - Investigation hypotheses' model ... 31
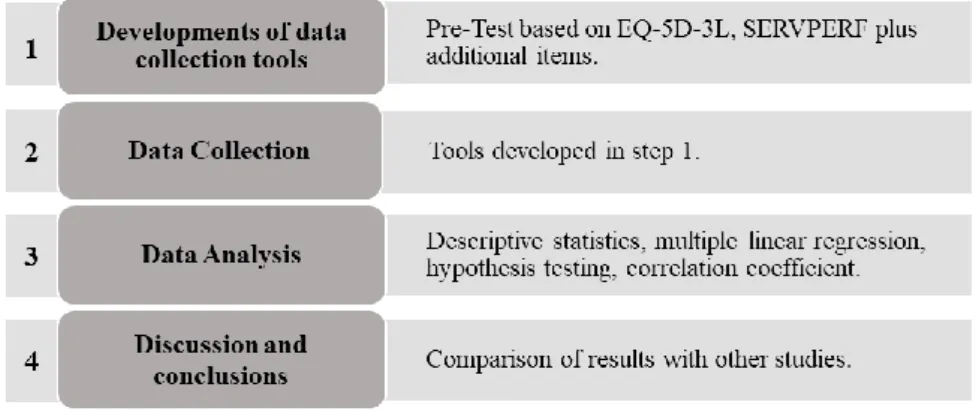
Figure 3 - Sequence of steps ... 37
Figure 4 - Representation of hypotheses testing possibilities (Source: Marôco, 2014) . 52 List of Graphs Graph 1- Relative frequencies of the recoded variable Age ... 40
Graph 2 - Relation between the variables Global Health Improvement and HRQoL Improvement ... 56
Graph 3 - Relation between the variables Overall Perceived Quality and HRQoL Improvement ... 58
List of Tables in Appendixes Table A3.1 - Frequency distribution of personal characteristics ... 91
Table A4.1 - Frequency distribution of personal characteristics recoded ... 92
Table A5.1 - Descriptive statistics of service quality items ... 93
Table A5.2 - Frequency distribution of the 7-point Likert scale per service quality item ... 94
Table A6.1 - Frequency distribution of EQ-5D-3L descriptive system ... 95
Table A6.2 - Frequency distribution of HRQoL improvement ... 95
Table A6.3 - Frequency distribution of self-rated health improvement ... 95
Table A7.1 – Residual statistics ... 96
Table A7.2 – Durbin-Watson Test ... 96
Table A7.3 – Collinearity diagnostics for 6 dimensions model ... 97
Table A7.4 – Collinearity diagnostics for 5 dimensions model ... 97
Table A7.5 – ANOVA Test ... 97
xi
Table A8.2 – Shapiro-Wilk test for Gender ... 99
Table A8.3 – Shapiro-Wilk test for Place of Residence ... 99
Table A8.4 – Shapiro-Wilk test for Education Level ... 100
Table A8.5 – Shapiro-Wilk test for Marital Status ... 101
Table A8.6 – Shapiro-Wilk test for Previous Location ... 102
Table A8.7 – Shapiro-Wilk test for Living Home ... 102
Table A8.8 – Shapiro-Wilk test for Unit ... 103
Table A8.9 – Shapiro-Wilk test for Typology ... 103
Table A9.1 – Levene’s Test ... 104
Table A10.1 – Parametric tests outputs ... 105
Table A11.1 – Nonparametric tests outputs regarding personal characteristics ... 106
Table A11.2 – Nonparametric tests outputs regarding service characteristics ... 107
List of Graphs in Appendixes Graph A7.1 - Histogram for 6 dimensions model ... 96
Graph A7.2 - Histogram for 5 dimensions model ... 96
Graph A7.3 - Normal P-P Plot for 6 dimensions model ... 96
Graph A7.4 - Normal P-P Plot for 5 dimensions model ... 96
Graph A7.5 - Scatter plot for 6 dimensions model ... 97
1 1. Introduction
This chapter starts with the identification of the problem that leads to the present research and denotes the relevance to study such topic. Next, it is defined the general and specific objectives, and consequently the research question to be answered. Afterwards, the research methodology is briefly explained, as well as the scope and structure of the study.
1.1. Context
Everyday many people trust their lives to health systems, which have a crucial role during one’s lifetime. Health systems, which core goal is to continually improve health, include all the institutions, organizations and resources that provide health care services (WHO, 2000a).
According to the World Health Organization (2000b), long-term care is the set of structured activities conducted to ensure that a person who is not completely capable of self-care can still have the best quality of life possible (considering the person preferences) with the highest degree of independence possible, autonomy, personal fulfilment, and dignity.
Shugarman et al. (2010) add that the self-care incapability of people who need long-term care services is caused by a physical, cognitive, or chronic health condition. “These care needs may arise from 1) an underlying health condition as is most common among older adults, 2) an inherited or acquired disabling condition among younger adults, and/or 3) a condition present at birth” (Shugarman et al., 2010:1).
Long-term care can be provided either by formal or informal support systems. The former includes health professionals, social services, and others, while the latter includes family, friends, and/or neighbours (WHO, 2000b). So, it “can be provided in home, institutional, or day-care settings, from public, not-for-profit or for-profit providers, with services varying from alarm systems to 24h/7 days personal care” (Colombo et al., 2011:39). In Portugal, long-term care concerns both health and social care services. The social care services (which include laundry services, meals, bathing, among others) are mostly provided by family (informal care), the Misericórdias, and other independent charitable organizations (formal care) – such as day centres, nursing homes or residences for the elderly (Nogueira, 2009; Simões et al., 2017). Health care services are provided only by
2
formal care, which include both private and public hospitals and primary healthcare centres (Nogueira, 2009; Simões et al., 2017).
Formal care in Portugal can be provided both by organizations that are part of the National Network for Integrated Continuous Care (Rede Nacional de Cuidados Continuados Integrados – RNCCI) and by organizations that are outside such network - such as nursing homes and day centres (Nogueira, 2009).
The RNCCI was created in 2006 from a partnership between the Ministry of Health and the Ministry of Labour and Social Solidarity as a response to the increase of the elderly population and the increase of disabling chronic diseases and the consequent need for more services (Ministry of Health, 2006; Simões et al., 2017). This network gathers teams that provide long-term care, social support, and palliative care within covering hospitals, primary healthcare centres, community services, local social security services, Solidarity Network, municipalities, and non-profit organizations of social services (Simões et al., 2017).
According to Decree-law nº101 (Ministry of Health, 2006), this network is composed of four types of services: inpatient units, outpatient units, hospital teams and home teams. The inpatient units provide treatment and clinical supervision to inpatients during and right after the disease. Depending on the needs and time of recovery, this unit can be divided in: convalescence (short-term recovery), medium-term care and rehabilitation, long-term care and maintenance, and palliative care – which nowadays have its own national programme (Ministry of Health, 2006; Simões et al., 2017). The outpatient units concern the services of day care and promotion of autonomy to patient who do not require being inpatients. The hospital teams include both team of hospital discharge and intra-hospital team of support in palliative care. Finally, the home teams consist of teams of long-term care and community teams of support in palliative care that provide their service at the home of the patient (Ministry of Health, 2006; Simões et al., 2017).
Under this context, it is important to understand how the health of the population is nowadays and the consequent need for healthcare services. Reports published by Deloitte (2017) and OECD (2017) reveal that chronic diseases keep rising all over the world, and the elderly population will grow 8% from 559 million in 2015 to 604 million in 2020 as a consequence of the growth of the life expectancy together with the decrease of natality rates. Also, the prevalence of dementia is estimated to rise everywhere in the world
3 between 2015 and 2050 since it is related with the pace of growth of the older population (Deloitte, 2017; OPSS, 2017).
Portugal is not an exception of the aging population, and the proportion of the Portuguese population aged over 65 years is expected to double from 20% in 2015 to 40% in 2050 (OECD, 2017). The same is expected to happen to the percentage of the Portuguese population aged over 80 years, as it is expected to increase from 6% in 2015 to more than 12% in 2050 (OECD, 2017).
OECD (2017) also reveals that, in Portugal, life expectancy at the age 65 was 19,9 years in 2015. But they also disclose that of those years, only 6,2 years are expected to be of healthy life, which indicate that the remaining years are not lived in good health and free of disability and activity limitation, requiring some type of support.
Regarding this, in 2015 it was estimated that 22,5% of the Portuguese adults aged 65 years and over had some limitations in their daily activities, while 45,5% had severe limitations (OECD, 2017).
Concerning the Portuguese population who received long-term care in 2015, 48% of them were aged over 80, 37% were aged between 65 and 79, and only 15% of them was aged 64 years old or less, which shows that the Portuguese long-term care receivers are mostly elderly people (OECD, 2017).
According to OPSS (2017), in 2017, there was a very high occupation rate (close to 100%) of all the inpatient units of the RNCCI – for example, the units of long-term care and maintenance had an occupancy rate of 99% in Algarve and 97% in the Centre of the country. As the population aged over 65 is expected to constantly grow, there will be an increase of demand for this type of care (OECD, 2017). According to the same source, this expected increase of demand requires that existing units find the service areas that need to be improved, so that they can provide the most efficient service delivery and be able to serve more patients.
However, the efficiency of the service provided should not focus only on the quantity of patients. Considering that long-term care institutions provide treatment, recovery, and clinical supervision to patients, the efficiency of the service provided should also consider the improvement of the quality of life of the patient - how they can perform their daily activities (Muragundi et al., 2012; Simões et al., 2017). Another point to consider in the
4
efficiency of the service is the impact it has on the patients’ perception of the service quality, as through its measurement it is possible to identify the areas that are most fundamental for the patients, the ones that need the most to be improved, and also the ones to focus first (Muragundi et al., 2012).
1.2. Objectives
Based on the challenge identified in the previous section, the general objective of this research is:
• Assess if the health-related quality of life is associated to the perceived service quality in long-term care institutions.
Having this in consideration, the specific objectives are:
• Measure the patients’ perception of overall quality and by quality dimension of the service provided in long-term care.
• Examine the influence of patients’ personal characteristics and the long-term care service characteristics in the perception of the overall service quality and in each dimension.
• Measure the patients’ health-related quality of life.
• Examine the influence of patients’ personal characteristics and the long-term care service characteristics in the health-related quality of life.
• Analyse the association between the patients’ perceptions of overall service quality and the health-related quality of life in long-term care.
• Develop managerial recommendations to improve the service delivery in long-term care.
1.3. Research question
Concerning the objectives identified previously, the research question to answer with this study is: Is there any association between the health-related quality of life and the perceived service quality?
5 1.4. Research methodology
The association between perceived service quality and health-related quality of life, to the best of the author’s knowledge, is a topic that has not yet been explored. According to Yin (2014), this setting should be addressed with an exploratory approach under a case study perspective.
Yin (2014) notes that there are various research methods. One of those methods is case study, which according to the same author, “is an empirical inquiry that investigates a contemporary phenomenon in depth and within its real-world context” (Yin, 2014:16). As seen in the previous topics the present study focuses in an existent organization, more precisely a long-term care institution, and its context.
Under this context, and in order to address the proposed objective and research question, a case study analysis will be conducted.
1.5. Scope
The case study will be conducted in a long-term care institution that has a private and a public unit, the latter being part of RNCCI. Both units are divided in temporary services (called medium-term care and rehabilitation in RNCCI) and long-lasting services (called long-term care and maintenance in RNCCI). The two inpatient units have a total of 120 beds. For confidentiality reasons, the name of the institution will not be disclosed.
1.6. Structure
The present study is organized in 5 chapters, which are as follow:
• Introduction: it is explained the problem that is to be studied and the context in which it arises. With this, it is defined the general and specific objectives and the various research questions which are intended to be answered with this study. Following this, the research methodology, the scope of the case study and the project structure are described.
• Literature review: it is presented the theoretical foundation regarding service quality (in general and in healthcare services), quality of life, and the existing tools to measure both.
6
• Methodology: it is identified and explained the research methodology and the data collection tools to be used. It is formulated the hypotheses to be tested, as well as described the data collection and data analysis to be performed. Finally, it is defined the steps to be taken to achieve the objectives defined previously and answer the research question.
• Case Study: it is described the long-term care institution and the sample of the research. It is performed the data analysis to after developing the discussion, managerial recommendations, and conclusions.
• Conclusion: it is summarized the findings of the study, its contribution, and its limitations, as well as recommendations for future research.
7 2. Literature Review
2.1. Introduction
In this chapter, it is presented the theoretical framework of this research. It is examined relevant existing literature about service quality and how to measure it in general and then, more specifically to the healthcare sector. Similarly, it is explored the existing literature about the quality of life concept and how to measure it.
2.2. Services
According to Eurostat (2017), in 2016 the services sector accounted for 73,9% of the total gross value added of the European Union 28 countries. In the same year, the Portuguese services sector reported to 75,4%, representing about three quarters of the total gross value added (Eurostat, 2017).
The concept of services does not have a consensual definition, although it has been discussed for many years. Grönroos (2001) defines services as a process where production and consumption occur at the same time and causes a certain outcome. Johnston et al. (2012: 6) argue that “a service is an activity – a process or a set of steps – which involves the treatment of a customer (or user) or something belonging to them, where the customer is also involved, and performs some role in the service process.” Vargo and Lusch (2004) suggest a different approach, one that does not consider the traditional difference between goods and services. These authors argue that there is only service and define it as actions, performances, and processes in which skills and knowledge are applied for the benefit of an entity.
There is no universal definition of services, but among the authors that state that services differ from goods on many levels, it was identified the main unique characteristics of services as intangibility, inseparability, heterogeneity, and perishability (Zeithaml et al., 1985). Later, Fitzsimmons and Fitzsimmons (2010) complemented the list with the following characteristics: customer participation and lack of ownership.
The intangibility feature comes from the fact that services are performances and actions, so they cannot be touched, smelled, or tasted like goods are (Parasuraman et al., 1985; Zeithaml et al., 1985). Also, a service is provided and consumed at the same time, what
8
explains the inseparability (Parasuraman et al., 1985). Likewise, the transformed resources of services are ideas, concepts, and information, so there is heterogeneity since the service performance depends on the customer, provider, and time (Parasuraman et al., 1985; Zeithaml et al., 1985). A service is perishable, because it is not possible to produce in advance and store it (Zeithaml et al., 1985). The customer participation feature is explained by the fact that a customer is always a participant in the service delivery process (Fitzsimmons and Fitzsimmons, 2010). Finally, the customers do not receive the ownership of service, since they are not purchasing a good, but an asset (human labour, technology, etc.) during a specific period of time (Fitzsimmons and Fitzsimmons, 2010).
2.3. Service Quality
Quality is an ambiguous and illusory concept (Parasuraman et al., 1985). When related to services, it becomes more difficult to understand how customers evaluate and perceive it due to the services’ unique characteristics (Parasuraman et al., 1985; Zeithaml, 1981). Service quality cannot be tested in advance since services are intangible, so service quality is established only on the customers’ expectations and feelings (Parasuraman et al., 1985; Zeithaml et al., 1985). Also, it is not possible to provide a consistent and standardized quality level as it depends on the customer, provider, and time – services’ heterogeneity (Booms and Bitner, 1981; Parasuraman et al., 1985; Zeithaml et al., 1985). Because of the services’ inseparability characteristic, the service quality occurs during the service delivery, which makes it very hard to control and measure as it mostly depends on the customer participation (Lehtinen and Lehtinen, 1982). The stronger the customer interaction is, the harder it is to control the quality – for example, in a hospital appointment, the explanation of the symptoms by the customer will impact the service provision and, consequently, the service quality (Lehtinen and Lehtinen, 1982; Parasuraman et al., 1985).
Thus, it is possible to conclude that the definition and assessment of the service quality is a challenge for the providers (Cronin Jr. & Taylor, 1992).
Grönroos (1984), Lehtinen and Lehtinen (1982), Lewis and Booms (1983), and Parasuraman et al. (1988) define service quality as the perception of the customer of the service received, which results from a comparison between the service provided and the
9 customer expectations. On the other hand, Bitner and Hubbert (1994) define it as the customer’s global judgement of superiority or inferiority of the service and the provider. Additionally, it is important to understand that service quality is not based solely on the outcome of the service, it also includes the way the service is delivered (Grönroos, 1982; Sasser et al., 1978).
More recently, Johnston et al. (2012) combined all definitions into one: the perceived service quality is the client’s judgement of both outcomes and experience during the service delivery, where they compare the benefits they got with the expectations and needs they had.
Hence, most of authors in the academic literature agree that service quality depends also on the customer expectations. As stated by Parasuraman et al. (1985), expectations are established by factors such as past experiences, customers’ needs, word of mouth, and the company’s communication.
To summarize, Parasuraman et al. (1985) notes that there are three fundamental topics about service quality: it is harder for the customers to evaluate the services’ quality than the quality of goods; the perception of the service quality is the result of the analogy between the customers expectations and the real performance of the service; the assessment of the service quality includes the service outcome and the way the service is provided.
2.3.1. Service Quality Dimensions
Many authors have explored and discussed the service quality possible dimensions. Sasser et al. (1978) remarked that service delivery is divided in three levels: material, facilities, and personnel, which are all associated with the way the service is provided. Grönroos (1982) stated that service quality is the combination of two dimensions: technical and functional quality. Grassing and Hessick (1988) identified six different quality dimensions: accuracy, timeliness, simplicity, consistency, employee attitudes, and cost. On the other hand, Parasuraman et al. (1988) argued towards five service quality dimensions: tangibles, reliability, responsiveness, assurance, and empathy.
In turn, Hedvall and Paltschik (1989) suggest the two following dimensions: willingness and ability to serve, and physical and psychological access. Alternatively, Gummesson
10
(1993) developed a model for quality assessment known as the 4Q Model, which considers both services and goods and consists of four dimensions: design quality, production and delivery quality, relational quality, and technical quality. Following these models, Rust and Oliver (1994) developed the three-component model, where they identify three dimensions of the service quality: service product, service delivery, and service environment.
From all the suggested dimensions, two perspectives stand out – the Nordic and the American one (Grönroos,1982; Parasuraman et al., 1988).
The Nordic perspective was mainly developed by Grönroos (1984), who was mentioned before, and divides the service quality in two dimensions – technical and functional quality. The first dimension is related to what the customer receives from the service, and the latter refers to the way the service is delivered. The author states that both dimensions are extremely important in the assessment of service quality. However, the perception of quality is not defined based only on these two dimensions, it is also influenced by the customer expectations (Grönroos, 1988).
The American perspective was mainly presented by Parasuraman et al. (1985) and Parasuraman et al. (1988), who structure the service quality in the five dimensions also previously identified – tangibles, reliability, responsiveness, assurance, and empathy.
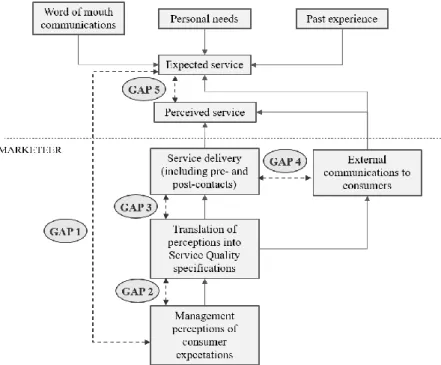
11 The mentioned authors developed theirs model based on their previous study, where they identify the gaps (Figure 1), which, according to them, are the origin of the lack of quality in the service delivery.
Parasuraman et al. (1985) define each gap as follows: Gap 1 is the company’s misinterpretation of the customers’ expectations regarding the service to be delivered. It shows the managers lack of insight about the customers’ expectations; Gap 2 is the discrepancy between the company's perception of customers’ expectations and the transformation of these into specifications of service quality; Gap 3 emerges when the service actually delivered does not correspond to the service quality specifications; Gap 4 occurs when the service promised by the company’s communication does not match the actual service delivered; Finally, gap 5 is the difference between the expectations regarding the service quality and the perception of the actual service quality provided. The authors remark that gap 5 is a consequence of the other four gaps and that it is the only one that can measure the service quality from the customers’ perspective.
In the same study, Parasuraman et al. (1985), in addition to the five gaps, also identified 10 dimensions, which they call determinants of service quality: reliability, responsiveness, competence, access, courtesy, communication, credibility, security, understanding/ knowing the customer, and tangibles.
Later, Parasuraman et al. (1988) conducted a study where they developed an instrument to measure the customers’ perceptions of service quality, where the 10 dimensions of the previous study converged into the 5 dimensions mentioned earlier.
2.3.2. Measurement of Service Quality
It is fundamental that managers understand service quality in the customers’ perspective, how it can affect the business and its success, and in what way it can be enhanced (Cronin and Taylor, 1992).
Regardless the many service quality models available, such as the ones presented previously, there are just a few that were operationalized, being the two more used and analysed the SERVQUAL and SERVPERF scales (Jain and Gupta, 2004).
12
2.3.2.1. The SERVQUAL Model
Parasuraman et al. (1988) conceptualized the multi-item scale SERVQUAL to measure the quality of the service by comparing the expectations the customers have regarding the service with the perception of quality of the service that really was provided.
Its operationalization is done with a questionnaire that is separated in two halves, each with 22- items – the first half is to assess the expectations before the service is delivered and the second one to assess the perceptions after the service is delivered (Parasuraman et al., 1988). The items in the questionnaire are divided in five quality dimensions: tangibles, reliability, responsiveness, assurance, and empathy (Parasuraman et al., 1988). Parasuraman et al. (1988:23) describe each dimension as detailed below:
• “Tangibles: physical facilities, equipment, and appearance of personnel; • Reliability: ability to perform the promised service dependably and accurately; • Responsiveness: willingness to help customers and to provide prompt service; • Assurance: knowledge and courtesy of employees and their ability to inspire trust
and confidence;
• Empathy: caring, individualized attention the firm provides its customers.” To evaluate each item, the authors proposed to use a Likert-like scale of 7 points, where 1 is "Strongly Disagree", 7 is "Totally Agree", and the points between 2 and 6 do not have any description.
The SERVQUAL scale has items and dimensions that are not industry specific, so the instrument serves as a base that can be adapted to the characteristics of a particular company or sector(Parasuraman et al., 1988).
Parasuraman et al. (1988) affirm that SERVQUAL is a concise model and it has reliability and validity, so it should be used to understand the expectations and perceptions of the customers and identify the areas that need the most to be improved.
However, since the authors presented this model it received some criticisms, both at conceptual and operational level (Buttle, 1996).
To start with, various authors state that service quality should be measured only in terms of the customers’ perceptions (Cronin and Taylor, 1992; Babakus and Boller, 1992; Boulding et al., 1993; Buttle, 1996). Babakus and Boller (1992) add that the difference
13 between the perceptions and expectations does not give any additional information to the already given by the perceptions part. Accordingly, Teas (1993) complement affirming that the definition of expectations by Parasuraman et al. (1985) is ambiguous and the corresponding part of the questionnaire can be differently interpreted by respondents. Regarding the dimensions of the instrument, Carman (1990), Babakus and Boller (1992) and Buttle (1996) agree that both dimensions and items should be adapted to each particular service. However, that is exactly what Parasuraman et al. (1988) remark in their study, that the SERVQUAL scale is just a base, that when necessary should be adapted to the specificities of each company and context. Buttle (1996) adds that some studies have shown that the use of adapted SERVQUAL leads to higher levels of explained variance and, consequently, better validity.
Still regarding the items, Buttle (1996) notes that some are positive sentences, while others are negative sentences, and that this reverse polarity can cause errors in the answers affecting the validity of the scale. Taking this into consideration, Parasuraman et al. (1991) reformulated the items that were negative sentences into positive ones.
Cronin and Taylor (1992) and Buttle (1996) also agree that SERVQUAL focus only in the process of service delivery and does not include the outcome of the service.
Lastly, Carman (1990) argues that it is not practical for the respondents to answer to two questionnaires, one before the service is delivered and one right after.
Despite the criticisms, the SERVQUAL scale has been used to measure the service quality in many services, such as banking services (Angur et al., 1999; Jabnoun and Al-Tamimi, 2003; Untaru et al., 2015), higher education services (Smith et al., 2007; Đonlagić and Fazlić, 2015; Leonnard, 2018), healthcare services (Babakus and Mangold, 1992; Kalaja et al., 2016), airline services (Chikwendu et al., 2012;Hussain et al., 2015), among many others.
Besides this, there are some operationalized models that are based on the SERVQUAL approach but modified and adapted it to specific types of services. Some of these models are: E-S-QUAL for websites that provide shopping online (Parasuraman et al., 2005); ARCHSECRET for voluntary organizations (Vaughan and Shiu, 2001); M-S-QUAL for mobile services of shopping both virtual and physical products (Huang et al., 2015).
14
HEALTHQUAL for healthcare services (Lee, 2016); or TOURQUAL for tourist attractions (Mondo and Fiates, 2017).
2.3.2.2. The SERVPERF Model
Cronin and Taylor (1992) were among the critics of SERVQUAL. The authors alleged that the instrument was confusing and that they did not agree with its conceptual base. They were part of the authors who argued that only the perceptions part of the instrument should be used, thereby removing the expectations component. Based on these reviews, these authors proposed the SERVPERF scale, which measures the quality of services focusing solely on the perceptions of the customers regarding the performance of the service.
This scale is composed by the 22 items of SERVQUAL that are related to the service performance and use the same 5 quality dimensions (Cronin and Taylor, 1992). The authors explained that they kept these items since they found them well justified, both with the methods used to develop them and the report of its use in the literature. Likewise, the scale considered to evaluate each item is also the Likert-like scale of 7 points (Cronin and Taylor, 1992).
Cronin and Taylor (1992) conducted a study where they found that the use of SERVPERF leads to better results than SERVQUAL, with more reliability, better validity, and better explained variance.
Since Cronin and Taylor (1992) presented their research, many studies were conducted in different areas using the scale SERVPERF, such as in banking services (Mustafa, 2015; Fragoso and Espinoza, 2017), in healthcare services (Tan Le and Fitzgerald, 2014), in fast food services (Qin and Prybutok. 2008; Ibarra et al., 2015), in hospitality services (Yilmaz, 2009; Zhihui, 2010), among others.
Similar to SERVQUAL, the SERVPERF scale also has adapted versions, such as Hedperf for higher education services (Abdullah, 2006).
The SERVPERF model has been compared to SERVQUAL since it was developed by Cronin and Taylor (1992). Brady et al. (2002) and Jain and Gupta (2004) confirmed through their study the superiority of SERVPERF over SERVQUAL. However,
15 SERVQUAL is better than SERVPERF when it comes to identify the areas that need intervention (Jain and Gupta, 2004).
Salomi et al. (2005) concluded that the SERVPERF presented slightly better results regarding validity and reliability. Most authors agree that SERVPERF is more advantageous as it has half of the questions of SERVQUAL, which makes it easier and more convenient to apply, as well as more motivating for the respondents (Brady et al., 2002; Jain and Gupta, 2004; Salomi et al., 2005).
2.4. Healthcare services
The healthcare service industry is constantly growing and evolving all over the world (Lee and Kim, 2017). Hospitals and other healthcare units concern more and more with service quality, so it is important to understand how it is defined in healthcare (Lee and Kim, 2017).
2.4.1. Healthcare service quality
In healthcare, quality is a complex and abstract concept which definition varies according to the interests and views of each person (Mosadeghrad, 2013).
To Donabedian (1980), healthcare service quality is the medical care that uses the knowledge and technology with the purpose of reaching the most benefits to health with the less risk. The main factor when providing health care services is the well-being of the patients (Donabedian, 1980).
According to Schuster et al. (1998), a good healthcare service quality implies that services delivered to the patient are technically adequate, done with great communication, the provider shares with the patient the decision making, and respects the different cultures. To Leebov et al. (2003), healthcare care service quality is to do the right thing, to continuously try to improve, get the best outcome possible, have all patients satisfied, preserve the best staff, and, lastly, keep a good financial performance.
Mosadeghrad (2013) presents a more comprehensive definition that combines the view of various stakeholders – patients, relatives, providers, managers, policy makers, payers, accreditation staff, and suppliers. This author states that healthcare service quality can be defined as meeting the patients’ needs and making the providers satisfied by delivering
16
healthcare services that are efficient and effective, and that agree with the most recent standards and guidelines.
The patients are increasingly demanding because of the improvement and evolution of the way of living, education and consciousness (Swain and Kar, 2017). That is why hospitals are investing in the management of service quality, that results in better understanding of the customers’ expectations and needs and, consequently, better perceived quality (Lee, 2016; Swain and Kar, 2017).
2.4.2. Measurement of healthcare service quality
The research by Donabedian (1988) suggested that the perceptions of the patients should be included in the evaluation of the healthcare services quality. Since then, managers integrate the perceptions and opinions of the patients as a focal point of its assessment (Serapioni, 2009).
Similar to the measurement of services quality in general, SERVQUAL and SERVPERF are the most applied tools in healthcare (Lee, 2017). Besides those tools, some authors created surveys of their own where they identify their own dimensions (Reidenbach and Sandifer-Smallwood, 1990; Vandamme and Leunis, 1993; Tomes and Peng, 1995; Mejabi and Olujide, 2008; Singh and Prasher, 2017; Swain and Kar, 2017).
There are many suggestions of dimensions of healthcare service quality and, depending on the goal of the researcher, they can have different uses (Lee, 2016). This variety occurs because there is a huge diversity of healthcare services, they differ according to different diseases, and they deal not only with people but also with their life (Lee, 2016). Regarding this, Table 1 identifies healthcare service quality dimensions proposed in some studies. Focusing on long-term care services, Lin et al. (2012) applied the SERVPERF scale in 14 long-term care institutions to understand the perceived service quality. They concluded that the perceived service quality was relatively high and did not mention any disadvantage in the use of the SERVPERF scale (Lin et al., 2012). A thorough search of the relevant literature yielded only this article regarding long-term care.
17
Study Dimensions
Reidenbach and Sandifer-Smallwood (1990)
Patients confidence, business competence, treatment quality, support services, physical appearance, waiting time, and empathy.
Vandamme and Leunis (1993)
Tangibles, medical responsiveness, assurance I, assurance II, nursing staff, and personal beliefs and values.
Tomes and Peng (1995) Empathy, relationship of mutual respect, dignity, understanding of illness, religious needs, food, and physical environment.
Mejabi and Olujide (2008) Waiting time for service, resource availability, condition of clinic or ward, attitude of doctors and nurses, condition of facility, quality of food, quality of care and attitude of non-medical staff.
Singh and Prasher (2017) Tangibles, responsiveness, reliability, assurance, empathy, and trustworthiness. Swain and Kar (2017) Infrastructure, personalized attention, staff attitude, trustworthiness, quality of
outcomes, clinical procedures, resource availability, information availability, administrative procedures, waiting time for services, patient safety and privacy, price, food, continuity, and religious needs.
Table 1 - Studies about healthcare service quality
2.5. Quality of life
WHO (1995:1405) defines quality of life as “individuals' perception of their position in life in the context of the culture and value systems in which they live and in relation to their goals, expectations, standards, and concerns”. According to the same source, the quality of life concept embraces the physical health, the psychological state, the level of independence, the individual’s social relationships, the relations with the environment elements, and religion and personal beliefs. This definition suggests that the concept is subjective and multidimensional and that its dimensions can include both negative (such as fatigue and pain) and positive aspects (such as mobility and contentment) (WHO, 1995).
However, throughout history, quality of life has not been studied and defined only as a general and comprehensive concept, but also as more specific to several areas such as politics, economics, sociology, psychology, and health (Holmes, 2005). The definition differs according to the scientific area, for example, in sociology and psychology the concept concerns happiness and satisfaction with life, which is influenced by each person goals, financial situation, socio-economic status, and so on (Holmes, 2005).
With this said, it is important to address both social care-related quality of life (SCRQoL) and health-related quality of life (HRQoL) considering that long-term care consists of both health and social situations.
18
Regarding the social care area, the quality of life concept is usually mentioned as SCRQoL and consists mostly on aspects of people’s life that are considered as personal daily activities, such as dressing, feeding, hygiene, shopping, etc. (Malley et al., 2012; Netten et al., 2012a).
In health, the concept tends to focus only on health-related factors, ignoring the non-related factors, such as economic and political (Holmes, 2005; Karimi and Brazier, 2016). HRQoL concept is closely connected to the definition of health present in the constitution of WHO, which declares that health is not just the nonexistence of disease or feebleness or frailty, but the total well-being in the physical, mental, and social domains (WHO, 2006). Most authors define HRQoL with a similar definition (Karimi and Brazier, 2016). According to Bowling (2005), the focus of researchers in both health and social care is in the assessment of the outcomes of interventions and treatments. In healthcare, an extensively used measure of the health outcomes is quality-adjusted life years (QALY), which is a summary measure that allows performing comparisons between distinct patients and areas (Whitehead and Ali, 2010). According to the same source, there are other measures of health outcomes, such as disability-adjusted life years (DALY) and healthy years equivalent (HYE), but QALYs are the most used and validated measure. QALY is a comprehensive instrument that assesses the health outcomes by associating quantity and quality of life into a single index (Prieto and Sacristán, 2003). The quality of life corresponds to a health state that is measured by health utilities and the quantity of life corresponds to the number of years spent with that certain health state (Neumann et al., 2000; Romero et al., 2013). The health utilities are preference weights which are measured using a scale from 0 (dead) to 1 (“perfect” health) (Whitehead and Ali, 2010). A QALY is obtained by calculating the product between the health utility and the number of years with that health utility (Whitehead and Ali, 2010; Beresniak and Dupont, 2016). According to both Neumann and Cohen (2018) and Beresniak and Dupont (2016), QALYs are valuable as shows individual preferences and enables to assess health gains and compare them across various diseases and treatments. The health gains are calculated by subtracting two different QALYs, for example, when comparing a treatment with no treatment, the health gain is calculated by subtracting the QALYs of the patient with no treatment from the QALYs of the patient with the treatment (Detels et al., 2015).
19 Despite the principal usage of QALY being economic evaluations, it has been suggested as an indicator to expose changes in the health state (Romero et al., 2013). However, no researches with the same purpose of this study were found, so the examples used from now on are related to economic evaluations.
In order to measure the quality of life, it is not only necessary to have a metric, but there is also the need to have an instrument that assess the health state of the patients. Next it will be revised the relevant literature regarding the instruments that may be used to measure the quality of life as a proxy for QALYs, which can be about general quality of life, SCRQoL, and HRQoL.
2.5.1. General quality of life tools
It was not found empirical evidence about application of broad measures of quality of life and well-being in long-term care. Knowing that Portuguese long-term care patients are mostly elderly people, it is relevant to take into consideration measures used specially for them.
Makai et al. (2014) conducted a review of quality of life measures for older people. In that study, the authors identified the four broad measures of quality of life or well-being that are most used on elderly, which include Ferrans and Powers QLI (Ferrans and Powers, 1985), WHOQol OLD (Power et al., 2005), ICECAP-O (Coast et al., 2008) and ASCOT (Netten et al., 2012b). However, according to Malley et al. (2012), ASCOT was developed specifically for social care-related quality of life, so it will be addressed later. In the same line of argument, Bulamu et al. (2015) point both WHOQol OLD and ICECAP-O as comprehensive instruments used in residential aged care.
Nevertheless, according to Makai et al. (2014), neither Ferrans and Powers QLI or WHOQol OLD have preference-weights, so they are not suitable to calculate QALYs. In contrast, there are preference-weights available for ICECAP-O (Makai et al., 2014). ICECAP-O is an instrument to measure general quality of life based on the theory of capabilities, which consists of five attributes: attachment (love and friendship), role (having a purpose), enjoyment (pleasure and joy), security, and control (being independent) (Flynn et al., 2011). The authors state that each attribute has a response with four different choices. Its original purpose was for economic evaluation of both health
20
and social care, however the interest in its usage to identify differences in quality of life has been rising (Flynn et al., 2011).
An advantage of this instrument is that it has adequate number of items and incorporates dimensions that older people usually find important (Makai et al., 2014; Bulamu et al., 2015). A limitation is the fact that is more recent, so needs more validation (Makai et al., 2014).
2.5.2. Social care-related quality of life tools
Forder and Caiels (2011) conducted a study which goal was to measure the value and outcomes of social care of long-term care services using the tool ASCOT. The authors concluded that this tool is able to measure the impact of social care in long-term care institutions and performs better than a HRQoL tool – more specifically EQ-5D, which will be addressed later.
ASCOT is the Adult Social Care Outcomes Toolkit, the only instrument that focuses specifically on the aspects of quality of life that are mostly provided by social care services (Towers et al., 2016). This tool is composed by eight domains – personal cleanliness and comfort, food and drink, control over daily life, personal safety, accommodation cleanliness and comfort, social participation and involvement, occupation, and dignity – which encompasses both the basic and the higher order aspects of SCRQoL (Towers et al., 2016; Malley et al., 2012). Each domain comprehends one item that can be answered with four different options which express distinct outcome states (Malley et al., 2012).
In order to demonstrate the impact of the social care provided in person’s SCRQoL, the tool measures both current and expected SCRQoL (Netten et al., 2012a; Towers et al., 2016). As stated by the same sources, the current SCRQoL corresponds to the achieved SCRQoL, while the expected corresponds to the expected SCRQoL in the absence of any intervention.
In relation to long-term care, that was the only study found, however it was found two researches concerning SCRQoL of elderly receiving social care services at institutions, which also use the tool ASCOT (Netten et al., 2012a; Towers et al., 2016).
21 Netten et al. (2012a) concluded that the institutions provided considerable gains in residents’ SCRQoL, but more on the basic aspects compared to the higher order aspects. Contrariwise, Towers et al. (2016) applied the tool in two moments with a 3 months interval to understand if any improvement existed. They concluded that the residents’ ability to do daily activities and their expected needs in the absence of services worsened expressively, and the residents’ current SCRQoL also worsened but only lightly.
According to Malley et al. (2012) and Makai et al. (2014), the ASCOT can be used to generate QALYs as it has preference-weights.
2.5.3. Health-related quality of life tools
Measures of HRQoL are gaining more and more importance to healthcare professionals and researchers (Lam, 1997; Guyatt et al., 1993). Its assessment is crucial to measure the self-perceived well-being and overall health of a patient (Tu et al., 2017).
Tu et al. (2017) suggests that HRQoL tools are more valuable when: assessing aspects that are important to the patients and expected to be affected by treatment; are responsive and valid; its outcomes are relevant and useful to determine if the treatment resulted or not.
The instruments to measure HRQoL can be divided in two types: disease-specific and generic (Lam, 1997; Guyatt et al., 1993; Tu et al., 2017).
Disease-specific instruments focus mostly on a specific disease but can also focus on a certain group of patients or a function and the problems that are associated to them (Guyatt et al., 1993; Tu et al., 2017). Some examples of instruments that concentrate on diseases are: PDQ-39 for Parkinson disease, CLDQ for chronic liver disease, and QLQ-C30 and FACT-G for cancer (Luckett et al., 2011; Orr et al., 2014; Tu et al., 2017). These instruments are more specific as they include only important aspects related to the particular disease, group of patients or function, which increases sensitivity and responsiveness (Guyatt et al., 1993; Lam, 1997). They are important to assess the effects of a disease and improvements of the treatment, which helps to guide the treatment plans (Tu et al., 2017). However, they are not suitable for persons with more than one disease and to make comparison between distinct patient groups (Lam, 1997).
22
Generic instruments summarize various health dimensions broadly, so it can be applied to every patient regardless their disease and even if the patient has multiple diseases (Lam, 1997; Tu et al., 2017). The most used generic instruments are: 36-Item Short-Form Health Survey (SF-36) and EuroQol 5 dimensions instrument (EQ-5D) (Haywood et al., 2005). Regarding long-term care, Kanwar et al. (2013) assessed the association between HRQoL and frailty of the residents in two long-term care institutions. These authors used the SF-36 tool to measure the HRQoL, which, as mentioned, is a generic instrument to evaluate health status. The instrument is composed by 36 questions grouped into 8 dimensions – physical functioning, role-physical, bodily pain, general health, vitality, social functioning, role-emotional, and mental health (Ware and Gandek, 1998; Kanwar et al., 2013). In addition to the scores per item and dimension, it can be divided into physical and mental component score, where the first four dimensions mentioned belong to the physical component, and the latter four belong to the mental component (Ware and Gandek, 1998). Each item has different response options that then are converted into scores from 0 to 100 (Ware and Gandek, 1998; Kanwar et al., 2013).
According to Kanwar et al. (2013), this tool has great validity, prognostic value and it is easy to reproduce. However, Bowling (1998) mentions that both this instrument and its short version (SF-12) are not suitable for residents of long-term care institutions as they include items that do not fit daily life in this type of institutions. The same author affirms that an item about walking long distances or lifting and carrying groceries is not appropriate since it is not just about the patient being capable to do it or not, it is about not having the opportunity to do it in such environment.
Kerse et al. (2008) also conducted a study in long-term care facilities where they assessed if an activity programme with the purpose of improving function had an impact over time in the quality of life of the residents and probability of falling. These authors used the EQ-5D visual analogue scale to measure the overall perceived quality of life. They concluded that existed minimal or none improvement over time and no disadvantages or problems are stated regarding the tool used.
Still regarding long-term care, it was not found more empirical evidence of measurements of HRQoL. Nevertheless, Bulamu et al. (2015) review the literature concerning measures of aged care, where the most used HRQoL instrument is EQ-5D with 6 studies being about its application in residential care.
23 The EQ-5D is a generic and standardized health status instrument, which comprises a descriptive system and an overall index, called EQ VAS (Euroqol, 2018; Devlin and Brooks, 2017). The descriptive system consists of five dimensions (mobility, self-care, usual activities, Pain/Discomfort, and Anxiety/Depression), which can have 3 or 5 types of responses depending on the version of the instrument – EQ-5D-3L or EQ-5D-5L respectively (Euroqol, 2018). The same source explains that the descriptive system can have 243 different combinations of answers, which scores can be shown as health profile or transformed into a single utility index which translates preferability in comparison to other health profiles. To complement, the EQ VAS captures the respondent’s self-rated health status with a vertical visual analogue scale from 0 to 100, where 0 signifies worst imaginable health state and 100 signifies best imaginable health state (Euroqol, 2018). In order to convert the responses of the descriptive system into a single utility index, it is needed a value set, which is a group of preference weights to each level of each dimension (Euroqol, 2018). According to the same source, this value set is specific for each country. In the case of Portugal, the EQ-5D-3L is the only version that has a valid value set (Euroqol, 2018). It was generated by Ferreira et al. (2013), who provided a Portuguese population-based predicted preference weights for all the 243 health states.
EQ-5D can be used to obtain QALYs as it is a preference-based instrument (Bulamu et al., 2015). This tool has been extensively used due to its high reliability, responsiveness, good validity, and short completion time (Euroqol, 2018). Bulamu et al. (2015) note that EQ-5D presents practical benefits as it has only 5 dimensions, so it is shorter when compared to other generic instruments, which make it easy to apply. Haywood et al. (2005) state that this instrument should be used when a briefer assessment is needed, especially when is expected a considerable change in health.
Lastly, it is crucial to understand which version (3L or 5L) of the EQ-5D is the most appropriate for the group in study. EQ-5D-5L has more levels of response, which, according to Janssen et al. (2013), allows to reduce the ceiling effect, increase reliability, and increase the discrimination between health states. However, this version has not been validated as much as EQ-5D-3L has (Euroqol, 2018). Likewise, as Leeuwen et al. (2015b) note, for elderly is better the version with less response levels as it is simpler and easier to understand and distinguish the options. Finally, a fundamental point to decide which version is better is the need to have a value set valid to use in Portugal, which as mentioned previously, currently only the EQ-5D-3L has (Euroqol, 2018).
24
2.5.4. Comparison of the tools
As identified previously, the most used and most appropriate instruments for elders living in an institution that enable the calculation of QALYs are ICECAP-O for general quality of life, ASCOT for SCRQoL, and EQ-5D-3L for HRQoL. There are a few studies that compare these three tools, but no study was found regarding long-term care.
Leeuwen et al. (2015a) conducted a study within the context of frail elderly receiving home care. The authors remarked minor differences in reliability between the three instruments. They also observed by analysing responsiveness and validity that EQ-5D-3L concentrates more on health, while the other two concentrate more on comprehensive areas of quality of life, not measuring health directly.
Malley et al. (2012) state that EQ-5D-3L focus more on functional abilities, overlooking the impact that the social support provided may have in quality of life. The authors affirm that, on the contrary, ASCOT is more sensitive to capture the impact of social care services. Bulamu et al. (2015) and Leeuwen et al. (2015a) agree that both ASCOT and ICECAP-O are relevant when measuring quality of life regarding broad aspects beyond healthcare, such as innovations in care for elderly. The two same sources add that EQ-5D-3L is better for interventions which goal is to preserve or improve health.
According to Leeuwen et al. (2015a:), “ASCOT is the most responsive to changes in quality of life from a broad perspective, ICECAP-O to changes in the impact of mental health and in ADL limitations, and the EQ-5D-3L to changes in the impact of physical limitations”.
Leeuwen et al. (2015b) lead a research with community-dwelling frail older adults, and it is not mentioned if they receive any type of care. However, being the sample in study frail elderlies, it is pertinent to understand how they interpreted the three instruments in comparison. Leeuwen et al. (2015b) state that EQ-5D-3L was the easiest tool for the elderly to answer as the response options are easily differentiated and well understood. The authors observed that more response options lead to more issues of interpretation– unlike EQ-5D-3L, both ICECAP-O and ASCOT contained questions and respective answers options that were misunderstood by the elderly.
Concerning the calculation of QALYs, Makai et al. (2014) state that ICECAP-O and ASCOT lack validation. Leeuwen et al. (2015a) note that despite the health not being the
25 only relevant area for elders, it is a very important one, and more researches are needed to understand if ICECAP-O and ASCOT can capture changes in health.
2.6. Conclusion
Services (including healthcare services) have some unique characteristics. Consequently, it is not possible to find an agreement on the definition and dimensions that compose both services in general and healthcare services in particular.
However, it is possible to agree that in both cases the two most used instruments in the assessment of service quality are SERVQUAL and SERVPERF.
In long-term care, the patients are mostly elderly that are frail and adults of any age with chronic diseases. Both aging and chronic diseases cause functional and mental disabilities, as well as affect the psychological state of the person. These disabilities are what cause the person’s dependency, and the goal of long-term care is to reverse and recover from these disabilities.
With this said, the most appropriate tool to use to measure the long-term care institution’s perceived service quality is SERVPERF. As stated previously, when compared to SERVQUAL, it is superior, presents better results regarding validity and reliability, and since it is smaller it is easier to apply and less frustrating. Also, in the only study found concerning long-term care it is applied the SERVPERF tool.
Regarding the assessment of quality of life, the most adequate instrument is QALYs, where it is calculated the improvement in health caused by an intervention, which in this study is the rehabilitation provided to the patients at the long-term care institution. In this specific context, the improvement is calculated without the quantity of life aspect, as in long-term care the purpose of the treatment is only to increase the quality of life, it does not influence the length of life as it is not a medical intervention.
To measure the quality of life aspect of the QALYs, the most appropriate tool is EQ-5D-3L, because as explained before it has been widely validated and it is the easiest tool for the elders to understand and answer. Furthermore, it focuses on health-related factors of quality of life, which concern physical disabilities that cause dependency and the psychological state of the respondents.
26
Between the two versions of EQ-5D, the 3L is the better to apply as it has been more validated, and it has less response options what makes it easier for the elders to understand. Also, EQ-5D-3L is the only version that has a Portuguese value set, which is needed to convert the responses.