UNIVERSIDADE DE LISBOA
FACULDADE DE CIÊNCIAS
DEPARTAMENTO DE ENGENHARIA GEOGRÁFICA, GEOFÍSICA E ENERGIA
Dynamic triggering of seismic activity in rifting and volcanic
settings
Miguel João Góis Ferreira Gaspar Neves
Mestrado em Ciências Geofísicas
Geofísica Interna
Dissertação orientada por:
First and foremost I would like to express my gratitude to Prof. Dr. Susana Custódio for giving me the opportunity to work with such interesting and intriguing theme. Her guidance, encouragement and time to hear all my doubts made this work possible.
I would also like to thank Prof. Zhigang Peng for is availability to review some of the results, an-swering some doubts that came up during the work and making available online the essential tools for the processing made. I would also like to acknowledge Prof. Graça Silveira for looking into some of the results and her suggestions and tips.
To everyone who was at the laboratory throughout this year thank you for the tips, opinions and the great work environment. Special thanks to Joana Carvalho for reviewing the geophysical and geological setting.
The most important acknowledge of all goes to my family. To my parents, brother, sister and grand-parents for believing in me and making possible for me to study what I like, for the encouragement and the incessant curiosity for what I was doing in this work and its status. To my father special thanks for helping me review the dissertation.
I cannot go without mentioning all the friends for their friendship and encouragement that made my path at the university easier. A special mention goes to Maria, Carolina and Lima whose support was very important in the final stages of this work.
As interações entre sismos são importantes objetos de estudo em sismologia. O exemplo mais óbvio destas interações é o despoletar de réplicas que podem ocorrer após um sismo perto da fonte. Pensa-se que estas réplicas são despoletadas pela tensão estática que deforma o solo até uma distância de um a dois comprimentos de falha. Outro tipo destas interações é o despoletar de sismicidade a grandes distân-cias devido à tensão dinâmica imposta pela passagem das ondas sísmicas. Este fenómeno chamado de
Dynamic Triggering (sismicidade despoletada pela tensão dinâmica) foi reportado pela primeira vez por Hill et al. [1993] que observaram um aumento na sismicidade no Oeste do Estados Unidos após o sismo
de magnitude 7.3 de 28 de Junho de 1992 em Landers. O aumento da sismicidade verificou-se até mais de 1250 km e iniciou-se na sua maioria durante a passagem das ondas de superfície. Dynamic Triggering é atualmente um fenómeno bem documentado, mas os mecanismos para sua ocorrência não são ainda completamente percebidos, existindo vários modelos propostos. É também habitualmente aceite devido a várias observações que estruturas vulcânicas podem ser afetadas pela passagem de ondas sísmicas. Este fenómeno pode ser uma importante ferramenta para perceber os processos que despoletam o movimento de uma falha, a nucleação de sismos e medir as tensões necessárias para uma falha movimentar-se e as-sim aumentar o conhecimento da mecânica dos sismos e melhorar os estudos de risco sísmico. Novas observações do fenómeno em diferentes ambientes são por isso essenciais para perceber os mecanismos que levam ao dynamic triggering e em que condições o fenómeno ocorre. De forma a fortalecer a re-lação causal entre o aumento da sismicidade e a passagem das ondas sísmicas vários testes estatísticos podem ser utilizados, sendo o mais utilizado a estatística β [Matthews and Reasenberg, 1988; Aron and
Hardebeck, 2009].
O dynamic triggering foi amplamente observado em regimes vulcânicos e distensivos. Este trabalho tem como objetivo procurar evidências de sismicidade despoletada pelas tensões dinâmicas impostas pelas ondas de superfície (instantaneous dynamic triggering) em quatro regiões onde este fenómeno não foi anteriormente estudado detalhadamente: Arquipélago de Cabo Verde, Moçambique e na Dorsal Mesoatlântica no vulcão submarino Lucky Strike e no Arquipélago dos Açores. Estes são ambientes vulcânicos e de rifting (regime distensivo).
Na região de Cabo Verde foram utilizados dados de duas redes sísmicas temporárias, uma composta por 7 estações de banda larga com três componentes instaladas entre 2002 e 2004 [Helffrich et al., 2010] e outra instalada entre 2007 e 2008 no âmbito do projeto CV-Plume composta por 40 estações de banda larga com três componentes [Vales et al., 2014]. A estes dados foram ainda adicionados os registos da estação SACV da rede sísmica global. Em Moçambique foram utilizados dados de uma rede temporária de 30 estações de banda larga com três componentes instalada no âmbito do projeto MOZART entre 2011 e 2013 [Fonseca et al., 2014]. No vulcão Lucky Strike foram utilizados dados OBS (Ocean Bottom Seismometer) obtidos no âmbito do projecto MOMAR [Crawford et al., 2013]. No Arquipélago dos
Açores foram utilizados os dados das estações permanentes CMLA, da rede sísmica global, e ROSA, da rede sísmica portuguesa, localizadas em São Miguel e São Jorge, respetivamente.
epicentral≥100 km e tensão dinâmica estimada ≥1 kPa para a onda de Rayleigh de 20 segundos. Em Cabo Verde foram ainda analisados eventos adicionais com magnitude ≥7, profundidade ≤100 km e distância epicentral≥100 km. Para cada evento foram analisados os dados para as 6 horas antes e depois do tempo de origem do evento. Foi retirada a resposta instrumental aos dados e foram rodados para as componentes radial, transversal e vertical (nos dados de OBS esta rotação não foi feita). Os dados foram depois filtrados com um filtro passa-alto (>5 Hz), ou outro filtro no caso de existência de ruído local, e obtida a função envelope. Com a função envelope das três componentes foi calculada uma função envelope média das três componentes que foi utilizada na deteção dos sinais de alta frequência. A deteção de sinais de alta frequência e avaliação do seu aumento através da estatística β foram feitas utilizando um algoritmo de deteção automática STA/LTA (short-term average/long-term average) feito porPeng et al. [2014], baseado em Earle and Shearer [1994]. Foram utilizadas janelas STA e LTA de 2 e 10
segundos, respetivamente, para detetar sinais de alta frequência de curta duração e de 10 e 50 segundos, respetivamente, para detetar sinais de alta frequência de duração mais longa. Foi utilizada uma razão STA/LTA de 1.5 como threshold. β foi calculado comparando os sinais detetados na janela de triggering, entre a chegada das ondas com 5 e 2 km/s, com os sinais detetados antes da chegada da onda P. Valores de β≥ 2 indicam um aumento estatisticamente significativo da atividade de alta frequência. Todos os resultados foram depois inspecionados visualmente de forma a evitar falsos positivos.
Foram analisados 52 eventos sísmicos diferentes e foram utilizados dados de 88 estações sísmicas diferentes em 4 áreas de estudo diferentes. Nas 4 áreas de estudo foram detetados 6 possíveis casos positivos de dynamic triggering. Foi detetado um caso positivo de triggering em Cabo Verde, 2 casos em Moçambique e 3 casos no Arquipélago dos Açores. A sismicidade detetada é na sua maioria emergente e os sinais não foram detetados em mais de duas estações. Não foi por isso possível determinar as fontes dos sinais observados.
Na maioria dos dados de Cabo Verde é identificado um forte ruído cultural de alta frequência que pode estar a afetar os resultados. Apenas se detetou um resultado claro de aumento significativo em sinais de alta frequência na estação MLOS, na ilha do Fogo, durante a passagem das ondas sísmicas do sismo de 2002 de Denali, Mw7.9. Esta é uma estação que não apresenta o forte ruído cultural. Os sinais possivelmente despoletados pelo sismo estão numa banda de frequência também ocupada pelo ruído cultural observado nas outras estações. Outros dois casos onde foi identificado um aumento significativo generalizado nas ilhas noroeste e sudoeste durante a passagem das ondas de superfície ocorreram no período de aumento do ruído cultural. Uma análise mais aprofundada que permita determinar a origem dos sinais e distinguir os sinais despoletados pela tensão dinâmica do ruído cultural é necessária para melhor interpretar estes resultados.
Em Moçambique foi observado um claro aumento da atividade de alta frequência em quatro estações durante a passagem das ondas de superfície do sismo de 6 de Fevereiro de 2013 das ilhas Salomão, Mw8.0. Estas quatro estações estavam na área das estruturas tectónicas ativas identificadas em Moçambique. Nenhum sinal coerente foi observado entre as quatro estações e não foi possível uma localização e ligar claramente o aumento da atividade de alta frequência às estruturas tectónicas. Foi ainda identificado um aumento significativo na atividade de alta frequência numa estação no Cratão do Kapvaal, zona onde não estão identificadas estruturas ativas, durante a passagem das ondas sísmicas do sismo de 16 de Abril de 2013 de Saravan, Mw7.7.
Nenhuma evidência clara de dynamic triggering foi identificada no vulcão submarino Lucky Strike. Foram detetados problemas instrumentais nos dados que afetaram os resultados obtidos.
de Macela, na ilha de São Miguel foram registados vários casos de aumento de atividade significativos. Os sinais detetados são emergentes e parecem ser tremor. As ondas sísmicas podem estar a ativar as estruturas vulcânicas na ilha.
Estes resultados mostram que as regiões dos Açores, Cabo Verde e Moçambique são regiões onde podem ocorrer eventos despoletados pelas tensões dinâmicas impostas pelas ondas sísmicas (dynamic
triggering).
Os resultados também sugerem que a sismicidade triggered pelas ondas sísmicas não tão frequente e comum como proposto por estudos anteriores.
Dados de estações mais protegidas de fontes de ruído cultural ou um método para melhor determi-nar quais os sinais do ruído cultural podiam melhorar as observações e a compreensão deste fenómeno nestas regiões. Nos Açores um estudo mais detalhado com dados de uma rede mais extensa e com maior cobertura ajudaria a confirmar as evidências detetadas na estação de Chã de Macela.
Earthquake-earthquake interactions are still important questions of study in earthquake seismology. One of the most obvious example of these interactions are the aftershock sequence that can occur in the af-termath of mainshocks near the source. Since observations of the seismicity rate increase in Western United States at distances up to more than 1250 km after the Landers (Mw7.3) earthquake in California, 1992 [Hill et al., 1993], widespread evidences for a new mode of interaction at remote distances has been
recorded. This mode, called remote Dynamic Triggering, is now considered a robustly observed phe-nomenon. It is also widely recognized that volcanic structures can be affected by the passage of seismic waves from remote large earthquakes. The understanding of dynamic earthquake triggering could help improve the understanding of earthquake mechanics and therefore better assess seismic hazard by being a possible tool to study the processes that trigger slip on a fault, earthquake nucleation and to measure the stresses needed for a fault to fail. For this, a better understanding of the triggering mechanisms and the conditions for it to occur is necessary. More observations of the phenomenon could help address this questions.
The objective of this study is to search for evidence of dynamic triggering in four regions not thor-oughly searched before for this phenomenon: Cape Verde, Mozambique and in the Mid-Atlantic Ridge in the Lucky Strike volcano and the Azores archipelago. These are volcanic and rifting (extensive regime) settings where the majority of remote dynamic triggering observations have been made. Events studied were chosen with the following criteria: epicentral distance≥100 km, depth ≤100 km and magnitude
≥5.5, with an estimated dynamic stress of the 20 second Rayleigh wave ≥1 kPa. For Cape Verde
addi-tional events with an epicentral distance≥100 km, depth ≤100 km and a magnitude ≥7 were studied. With a STA/LTA automatic detection algorithm [Peng et al., 2014] we assessed the statistical significance of the increase of high-frequency seismic energy during the passage of surface waves using a β statistics [Aron and Hardebeck, 2009]. β≥2 indicates a statistically significant increase. All results were visually inspected to avoid false positives.
A total of data from 52 different mainshocks was analysed and data from 88 different seismic stations was used in this study in 4 different study regions. In the 4 regions of study 6 cases of possible positive dynamic triggering were detected. One positive case was detected in Cape Verde, 2 cases in Mozambique and 3 cases in Azores. The observed seismicity is in its majority emergent and signals were not detected in more than two stations. Determination of the sources of the observed signals was therefore not possible. In Cape Verde, a strong cultural noise with diurnal variation was identified. Only one clear case of significant increase in high-frequency seismic energy bursts was identified in the Fogo island in the Fogo volcano during the passage of the 2002 Mw7.9 Denali earthquake. The triggered signals identified in this case had frequencies in the same band of the cultural noise and so this noise could be masking triggered signals. Other two cases of increased high-frequency energy bursts with the passage of the seismic waves in the southwestern and northwestern islands were identified but these occurred in the period where the increase in cultural noise starts.
Solomon islands earthquake. No coherent signals between the four stations were identified. During the passage of the April 16th, 2013 Mw7.7 Saravan earthquake a significant increase was identified in a single station in the Kapvaal craton.
No evidences of dynamic triggering were detected in the Lucky Strike volcano. Data had instrumental problems that afected the results.
In Azores, no evidence of dynamic triggering was found in the island of São Jorge a known seismic gap. Chã de Macela in São Miguel appears to be a location of repeated triggering. Signals detected are emergent and appear to be tremor-like. The seismic waves could be activating the volcanic structures in the area. A study with network with better coverage of the archipelago would help to better understand these results.
This results show that Azores, Cape Verde and Mozambique are areas where dynamic triggered seis-mic events may possibly occur.
The results also suggest that dynamic triggering is not so frequent and common as proposed by pre-vious studies, particularly in the regions of study.
Data from stations deployed in locations better sheltered from cultural noise sources or a method to better constraint cultural noise signals would probably greatly improve the observations and the compre-hension of the phenomenon in these regions.
Acknowledgments i
Resumo iii
Abstract vii
Contents ix
List of Figures xiii
List of Tables xxi
1 Introduction 1
2 Dynamic Triggering 3
2.1 Seismic waves and their propagation through Earth . . . 4
2.2 Triggering by dynamic stress changes . . . 6
2.2.1 Microearthquakes . . . 9
2.2.2 Tremor . . . 9
2.3 Proposed models for the generation of dynamic triggering . . . 11
2.4 Interaction between earthquakes and volcanoes . . . 12
2.5 Triggering statistics . . . 13
3 Geophysical and Geological Setting 15 3.1 Cape Verde . . . 15
3.1.1 Tectonics and geology of the archipelago . . . 15
3.1.2 Seismicity of Cape Verde . . . 17
3.2 Mozambique . . . 20
3.2.1 Geology and tectonics of Mozambique . . . 20
3.2.2 Seismicity of Mozambique . . . 23
3.3 Mid-Atlantic Ocean Ridge . . . 25
3.3.1 Azores . . . 25
3.3.2 Lucky Strike . . . 27
4 Data 31 4.1 Deployments in Cape Verde . . . 31
4.2 Mozambique - project MOZART . . . 31
4.4 Permanent stations in the Azores Archipelago . . . 35
5 Methods 37 5.1 Selection of distant mainshocks . . . 37
5.2 Data processing . . . 38
5.3 Burst detection and triggering statistics . . . 39
6 Cape Verde 41 6.1 Results . . . 41
6.1.1 Cultural Noise . . . 45
6.1.2 The May 12th, 2008, Mw7.9 Eastern Sichuan and the June 30th, 2008, Mw7.0 South Sandwich Islands Region earthquakes (Mainshocks L and O) . . . . 47
6.1.3 Mainshocks with epicenter in the Mid-Atlantic Ridge (C, D, E and F) . . . 49
6.1.4 The November 3rd, 2002, Mw7.9 Denali earthquake (Mainshock H) . . . . 51
6.2 Discussion . . . 53
7 Mozambique 55 7.1 Results . . . 55
7.1.1 February 6th, 2013 Mw8.0 Solomon islands earthquake (mainshock D) . . . . . 57
7.1.2 April 16th, 2013 Mw7.7 Saravan earthquake (mainshock C) . . . . 57
7.2 Discussion . . . 61
8 Mid-Atlantic Ocean Ridge 63 8.1 Lucky Strike volcano . . . 63
8.1.1 Data problems . . . 63 8.1.2 Results . . . 65 8.1.3 Discussion . . . 66 8.2 Azores archipelago . . . 67 8.2.1 Results . . . 67 8.2.2 Discussion . . . 74 9 Conclusions 77 Bibliography 79 Appendices 85
A Determined β-values for all stations and mainshocks in Cape Verde 87
B Determined β-values for all stations and mainshocks in Mozambique 91
C Determined β-values for all stations and mainshocks in Lucky Strike volcano 95
D Determined β-values for all stations and mainshocks in Azores 97
E Maps of β for all events analyzed in more than one station in Cape Verde not present in
main text 99
2.1 Diagram from Kilb et al. [2000] illustrating differences between static and dynamic stresses with distance in terms of idealized time histories for peak changes in dynamic (CFF(t)) and static (CFF) Coulomb stress. CFF(t) is the time dependent version of CFF (eqn 2.3). The double arrows show peak values for CFF(t) and CFF.[Adapted from Hill and
Pre-jean, 2007]. . . . 4 2.2 Global seismic ray paths and phase names, computed for the PREM velocity model. P
waves are shown as solid lines, S waves as wiggly lines.The different shades indicate the inner core, the outer core, and the mantle. [From Shearer, 2009] . . . . 5 2.3 Three-component seismograms of the Mw6.0 Kyrgyzstan earthquake on the 19th of July
2011 recorded at station SUR in South Africa. The data have been rotated to the great circle path and Butterworth band-pass filtered between 0.0125-0.035 Hz. Seismograms are identified with P- and S-phases, as well as the surface waves (Love and Rayleigh). [From Domingues, 2016] . . . . 6 2.4 Examples of triggered seismicity detected within the surface wave coda from the Denali
Fault earthquake at Mammoth Mountain. The top trace is a broadband seismogram, and the middle trace is a high-pass filtered version of the broadband record revealing the locally triggered activity as a spasmodic burst consisting of rapid-fire earthquakes. The bottom panel is a spectrogram of the broadband seismogram from station OMM located 4km southeast of Mammoth Mountain. Note the utility of the spectrogram display in revealing local earthquakes within the low-frequency coda as narrow vertical bands rich in high-frequency energy. Modified from Prejean et al. [2004]. [Adapted from Hill and
Prejean, 2007] . . . 7 2.5 Coulomb stress changes caused by the Joshua Tree, Landers, and Big Bear earthquakes
mapped at a depth of 6.25km (halfway down the fault) and (M1) aftershock distribution during the 25 days following the Landers main shock. Source parameters are those used by King et al. [1994]. The location (open star) and the surface rupture (solid black line) of the M 7.1, 1999, Hector Mine earthquake epicenter is shown on the map. The Coulomb stress changes are plotted with a reduced amplitude (color) scale with respect to those of the previous figures. Redrawn from King et al. [1994] . [Adapted from Hill and Prejean, 2007] . . . 8
2.6 Examples of triggered tremor during the surface waves of the 2001 November 14 Mw 7.8 Kunlun earthquake. (a) Broad-band transverse component seismogram recorded at station TPUB. The time is relative to the origin time of the Kunlun earthquake. The two arrows mark the approximate arrival time of the P and S waves. (b) 2–8 Hz bandpass-filtered transverse-component seismogram showing the high-frequency P waves and the triggered tremor during the passage of the Love waves. (c) The spectrogram of the transverse-component seismogram at station TPUB. The triggered tremor signals are shown as narrow vertical bands rich in high-frequency energy as compared with the tele-seismic P and surface waves. [Adapted from Peng and Chao, 2008] . . . . 10
3.1 Cape Verde archipelago major islands with elevation. Location of the archipelago in the North Atlantic off the coast of africa . . . 16 3.2 (a) Oblique 3-D image of Fogo and Brava, viewed from the southeast, based on swath
bathymetry offshore and SRTM data onshore. (b) Plan (map) view of Fogo and the sur-rounding seafloor. Contours are at 200 m intervals with thousand meter contours in bold (orange, 1000 m; green, 2000 m; blue, 3000 m). The volcanic cones on the right of the image are on the lower slope of Santiago island. [Adapted from Masson et al., 2014] . . 18 3.3 Hypocentres of all locatable events registered between Nov. 2007–Sep. 2008 in the Cape
Verde archipelago (red); final area selected for derivation of the 1D model and events complying with the selection criteria (black). To the bottom and left of the epicentral map are W–E and S–N vertical cross-sections. [From Vales et al., 2014] . . . . 19 3.4 Map with the location of Mozambique (MOZ) in Southeast Africa. Tanz - Tanzania;
Zimb - Zimbabwe; SA - South Africa. . . 20 3.5 Hypsographic DEM of the East African rift system. Black lines: main faults; white
surfaces: lakes; grey levels from dark (low elevations) to light (high elevations). The East African rift system is a series of several thousand kilometers long aligned succes-sions of adjacent individual tectonic basins (rift valleys), separated from each other by relative shoals and generally bordered by uplifted shoulders. It can be regarded as an intra-continental ridge system comprising an axial rift. [Adapted from Chorowicz, 2005] 21 3.6 Simplified map of Mozambique with the main geological and tectonic units. ZC—Zimbabwe
craton; LB—Limpopo; KC—Kaapvaal craton. [From Domingues et al., 2016, and ref-erences therein] . . . 22 3.7 Preliminary locations of the earthquakes recorded during the first half of the MOZART
deployment (April 2011 to July 2012). The map view of all the epicenters with horizontal uncertainty below 10 km (307 events). A joint focal mechanism solution is shown for four earthquakes with ML >2:4 located in the Urema graben, inside the outlined rectangle (P-wave first motions, 21 polarities, 3 violations). [Adapted from Fonseca et al., 2014] . 24 3.8 Location of the Azores archipelago and the Lucky Strike volcano (black box) in the North
3.9 Azores region main tectonic structures. The shaded area represents the sheared west-ern segment of the Eu–Nu plate boundary. Lithospheric plates: NA, North America; Eu, Eurasia; Nu, Nubia. Tectonic structures: MAR, Mid-Atlantic Ridge; NAFZ, North Azores Fracture Zone; WAFZ, West Azores Fracture Zone; TR, Terceira Rift; EAFZ, East Azores Fracture Zone; GF, Gloria Fault; EAVTS, East Azores Volcano-tectonic System. Islands: C, Corvo; Fl, Flores; F, Faial; P, Pico; SJ, São Jorge; G, Graciosa; T, Terceira; SM, São Miguel; Fo, Formigas islets; ST, Santa Maria. Azores bathymetry adapted from
Lourenço et al. [1997] and world topography and bathymetry from GEBCO_08 database
2010. [From Gaspar et al., 2015] . . . . 26 3.10 Historical seismicity and volcanism in the Azores archipelago. a) Epicentral locations
of destructive earthquakes during historical times. b) Location of historical eruptions. [Adapted from Gaspar et al., 2015, and references therein] . . . . 28 3.11 Maps of the Lucky Strike volcano. (A) The solid contour outlines Lucky Strike volcano.
(B) Volcano scale. Solid contours are isodepths outlining the volcano base (1900 m be-neath sea level (mbsl)), the western volcanic ridge (1660 mbsl), the summit depression (1710 mbsl) and its three surrounding peaks (1660 mbsl). Red dashed line marks the bounds of the Axial Magma Chamber (AMC) reflector. Black dashed lines mark signif-icant surface faults. Black crosses mark hydrothermal vents. Circles mark OBS sites de-ployed in the MOMAR project cruises (blue (outer) 2007–2008, red (inner) 2008–2009) (section 4.3). [Adapted from Crawford et al., 2013, and references therein] . . . 29 3.12 Across-axis cross-sections of seismic events located by Crawford et al. [2013] and
sub-surface structure. Solid lines=faults imaged using seismic reflection data, dashed lines=faults extrapolated from seafloor observations. Dashedgrey line=AMC reflector. (A)Cross-section across the central graben north of the hydrothermal field. (B) Cross-(A)Cross-section across the hydrothermal field, with seafloor hydrothermal discharge zones indicated in grey.(C) Cross-section across the south peak. [Adapted from Crawford et al., 2013] . . . . 30
4.1 Locations of the stations from the two temporary deployments and the permanent SACV station. A) 2002-2004 deployment and SACV station from the Global Seismological Network. B) 2007-2008 deployment. Coordinates of stations are given in appendix F. . . 32 4.2 Locations of the stations from the MOZART deployment between 2011 and 2013. Red
triangles - Taurus stations; Blue squares - Guralp stations; Green circles - stations of Africa Array. Coordinates of stations are given in appendix F. . . 32 4.3 Locations of the OBSs deployed as part of the MOMAR project. A) BBMOMAR I;
B) BBMOMAR II; C) BATHYLUCK09; D) MomarSat2010. Coordinates of OBSs are given in appendix F. . . 34 4.4 Abrupt jump in data observed in several OBS stations. This was recorded in station D1
before the arrival of mainshock C that will be analyzed in section 8.1 . . . . 35 4.5 Locations of the permanent stations in Azores. ROSA station is located in São Jorge
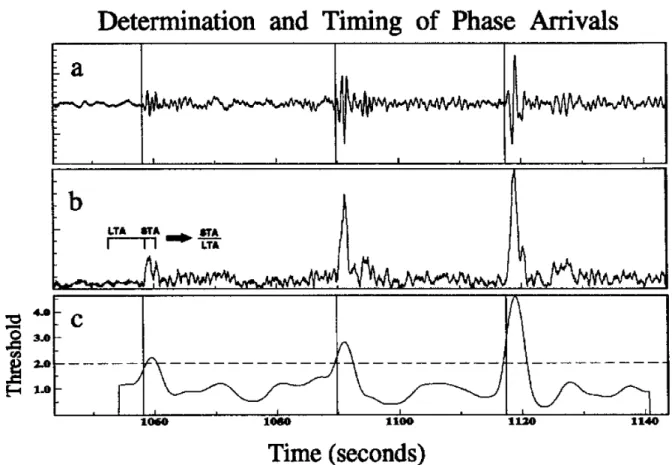
5.1 Example of a STA/LTA automatic detection algorithm to determine phase arrivals. (a) Short-period seismogram with autopicks plotted as vertical lines. (b) Envelope function and STA-LTA windows. The LTA and STA windows have been enlarged for visual-ization. (c) STA/LTA ratio (solid) and threshold (dashed). The trigger points are the intersections of the increasing STA/LTA ratio and the threshold. The pick times (vertical lines) are defined by the inflection point that precedes the local maximum immediately following the trigger point. [Adapted from Earle and Shearer, 1994] . . . . 39 6.1 Map of 20 mainshocks (tables 6.1 and 6.2) analyzed in Cape Verde (CV - green
trian-gle). The epicenters are marked by the yellow stars. Mainshocks have Mw≥5.5 and hypocentral depths≤100. . . 41 6.2 Data analyzed for mainshock L in station CVFG4. a) Raw vertical component; b) 5 Hz
high-pass filtered vertical component; c) Vertical component spectrogram. An increase in high-frequency energy bursts occurs during the passage of the surface waves that is sustained after the surface wave train end. . . 43 6.3 Data analyzed from station CVFG3 for mainshock Q. a) Three-component average
en-velope; b) STA/LTA ratio; c) Raw transverse component; d) Raw vertical component; e) 5 Hz high-pass filtered vertical component. Green line marks the manual picked P-wave arrival; Red lines delimit the triggering window. An increase in detected high-frequency signals occurs during the passage of the seismic waves. . . 45 6.4 Data analyzed from station MLOS for mainshock H. a) Three-component average
enve-lope; b) STA/LTA ratio; c) Raw transverse component; d) Raw vertical component; e) 5 Hz high-pass filtered vertical component. Green line marks the manual picked P-wave arrival; Red lines delimit the triggering window. An increase in detected high-frequency signals occurs during the passage of the seismic waves. . . 46 6.5 Dayplot of the 5 Hz high-pass filtered vertical component envelope from station CVFG4,
from 2008/05/02 to 2008/05/12 (day of mainshock L) . . . . 46 6.6 Maps with the registered β’s during the passage of the mainshocks L (figure A) and O
(figure B) surface waves. Red circles represent stations with a significant increase in high-frequency activity and blue a significant decrease. A generalised increase is observed in the more western islands. . . 47 6.7 Example of a case where the increase in high-frequency activity during the passage of
mainshock O seismic waves appears to start with the arrival of the S-wave. a) Three-component >5 Hz average envelope; b) Raw transverse Three-component; c) Raw vertical com-ponent; d) 5 Hz high-pass filtered vertical component. Detections are marked by the red and yellow circles. The first vertical line (green) corresponds to the picked P-wave arrival and the next two red lines delimit the triggering window. . . 48 6.8 Surface waves from mainshock L recorded at station CVFG4. a) Transverse (top) and
vertical (bottom) 0.01-1.0 band-pass filtered components; b) 3-component >5 Hz average envelop; c) 5 Hz high-pass filtered vertical componente. Yellow lines mark the start of some of the high-frequency detected signals. These appear to start near a surface wave velocity maximum. . . 48
6.9 Surface waves from mainshock O recorded at station CVSN2. a) Transverse (top) and vertical (bottom) 0.01-1.0 band-pass filtered components; b) 3-component >5 Hz average envelope; c) 5 Hz high-pass filtered vertical component. Yellow lines mark the start of some of the high-frequency detected signals. These appear to start near a surface wave velocity maximum. . . 49 6.10 Two high-frequency bursts observed during the passage of mainshock J in MAIO station
(blue circles). These bursts were observed in all the stations. The thin blue dashed lines mark the theoretical arrivals of the S, SS and sS waves, using the iasp91 model. a) Three-component average envelope; b) Raw transverse Three-component; c) Raw vertical Three-component; d) 5 Hz high-pass filtered vertical component. Green vertical line corresponds to the manual picked P-wave and the red lines delimit the triggering window. . . 50 6.11 Nonlinear least-squares Marquardt-Levenberg fitting of r = vt linear function (green line)
to the distance of the stations to the epicenter (r) and the determined arrival times (t) of the observed second burst (in purple) for mainshock E. The fitting parameter corresponds to the average propagation speed with a result of 1.560± 0.002 km/s equal to the observed approximate propagation speed of the T-wave. . . 50 6.12 Mainshock H recorded in station MLOS. a) Raw vertical component; b) 5 Hz high-pass
filtered vertical component; c) Vertical component spectrogram. High-frequency energy bursts are detected during the passage of the surface waves and similar signals occur after the surface wave train end. This result does not appear to be affected by the strong cultural noise. . . 52 6.13 Surface waves from mainshock H recorded at station MLOS. a) Transverse (top) and
ver-tical (bottom) 0.01-1.0 band-pass components; b) 3-component >5 Hz average envelope; c) 5 Hz high-pass filtered vertical component. Yellow lines mark the start of some of the high-frequency detected signals. These appear to start near a surface wave velocity maximum. . . 52 7.1 Map of mainshocks (table 7.1) analyzed in Mozambique (green triangle). The epicenters
are marked by the yellow stars. Mainshocks have Mw≥5.5 and hypocentral depths ≤100. 56 7.2 Clipped records of the vertical components during the passage of the Rayleigh waves
of mainshock A in stations 3901 (A) and 3A16 (B). In high-passed >5 Hz seismograms several impulsive bursts followed by periods of absence of movement are recorded. . . . 57 7.3 A significant increase in high-frequency activity is recorded in 4 stations in the northern
part of the study area in Mozambique (Red circles). . . 58 7.4 Data analyzed from station A0302 for mainshock D. a) Three-component average
enve-lope; b) STA/LTA ratio; c) Raw transverse component; d) Raw vertical component; e) 5 Hz high-pass filtered vertical component. Green line marks the manual picked P-wave arrival; Red lines delimit the triggering window. An increase in detected high-frequency signals starts with the arrival of the Love wave. . . 58 7.5 Mainshock D recorded in station A0302. a) Raw vertical component; b) 5 Hz high-pass
filtered vertical component; c) Vertical component spectrogram. An increase in high-frequency energy bursts with a tremor-like signal is detected during the passage of the surface waves. . . 59
7.6 Zoom of figure 7.5, from the mainshock origin time to the end of the surface train. a) Raw vertical component; b) 5 Hz high-pass filtered vertical component; c) Vertical component spectrogram. . . 59 7.7 Surface waves from mainshock D recorded at station A0302. a) Transverse (top) and
vertical (bottom) 0.01-1.0 band-pass filtered components; b) 3-component >5 Hz average envelope; c) 3-5 Hz band-pass filtered vertical component.Yellow lines mark the start of some of the high-frequency detected signals. These appear to start near a surface wave velocity maximum. . . 60 7.8 Data analyzed for mainshock D recorded in station 3A16. a) Raw vertical component; b)
5 Hz high-pass filtered vertical component; c) Vertical component spectrogram. frequency noise with frequencies higher than 10 Hz is present in the records. High-frequency energy bursts with a larger High-frequency band than the noise bursts are detected during the passage of the seismic waves. . . 60
8.1 Map of mainshocks (table 8.1) analyzed in the Lucky Strike volcano (LS - green trian-gle). The epicenters are marked by the yellow stars. Mainshocks have Mw≥5.5 and hypocentral depths≤100. . . 63 8.2 Data analyzed from station C1 for mainshock D in the Lucky Strike volcano. The increase
in high-frequency seismic energy signals starts before the arrival of the seismic waves. a) Three-component average envelope; b) STA/LTA ratio; c) Raw vertical component; d) 5 Hz high-pass filtered vertical component. Green line marks the theoretical arrival of the P-wave with model iasp91; Red lines delimit the triggering window. . . . 66 8.3 Data analyzed from station D1 for mainshock C in the Lucky Strike volcano. A
signif-icant decrease in high-frequency activity is detected during the passage of the surface waves. a) Three-component average envelope; b) STA/LTA ratio; c) Raw vertical com-ponent; d) 5 Hz high-pass filtered vertical component. Green line marks the theoretical arrival of the P-wave with model iasp91; Red lines delimit the triggering window. . . . . 67 8.4 Map of mainshocks (table 8.3 and 8.4) analyzed in Azores (AZ - red triangle). The
epicen-ters are marked by the yellow stars. Mainshocks have Mw≥5.5 and hypocentral depths
≤100. . . 67
8.5 Mainshock J recorded in Azores archipelago in station CMLA. a) Raw vertical compo-nent; b) 5 Hz high-pass filtered vertical compocompo-nent; c) Vertical component spectrogram. An increase in high-frequency energy bursts is detected during the passage of the surface waves. . . 70 8.6 Mainshock AA recorded in Azores archipelago in station CMLA. A significant decrease
in high-frquency activity appears to start with the passage of the seismic. a) Three-component >5 Hz average envelope; b) Raw transverse Three-component; c) Raw vertical component; d) Raw transverse component; e) 5 Hz high-pass filtered vertical compo-nent. Detections are marked by the red and yellow circles. The first vertical line (green) corresponds to the picked P-wave arrival and the next two red lines delimit the triggering window. . . 71
8.7 Data analyzed from station CMLA for mainshock A in Azores archipelago. A clear in-crease in activity is observed after the passage of the seismic waves. The calculated β is due to the detection of what appear to be the sesimic waves higher frequencies, this could not be filtered. a) Three-component average envelope; b) STA/LTA ratio; c) Raw transverse component; d) Raw vertical component; e) 5 Hz high-pass filtered vertical component. Green line marks the theoretical arrival of the P-wave with model iasp91; Red lines delimit the triggering window. . . 72 8.8 Mainshock A recorded in Azores archipelago in station CMLA. a) Raw vertical
compo-nent; b) 5 Hz high-pass filtered vertical compocompo-nent; c) Vertical component spectrogram. 72 8.9 Signal detected after the passage of mainshock A surface waves in Azores archipelago.
It has two impulsive phases. . . 73 8.10 A) Stem plot with the events located close to mainshock A epicenter in Azores archipelago
between 1st June and 31st August, 1997, from the International Seismological Centre cat-alog. An increase occurs in the day of the mainshock and the days after. B) Histogram with the determined intervals between P and S phases of the 35 impulsive signals detected after mainshock A. . . . 73 8.11 Mainshock J recorded in Azores archipelago in station CMLA. During the passage of
the seismic waves two groups of high-frequency energy bursts were detected. One occurs with the arrival of the Love waves and the other during the passage of the Rayleigh waves. Signals have emergent onsets and are tremor-like. a) Three-component >5 Hz average envelope; b) Raw transverse component; c) Raw vertical component; d) 5 Hz high-pass filtered vertical component. Detections are marked by the red and yellow circles. The first vertical line (green) corresponds to the picked P-wave arrival and the next two red lines delimit the triggering window. . . 74 8.12 Surface waves from mainshock J recorded in Azores archipelago at station CMLA. a)
Transverse (top) and vertical (bottom) 0.01-1.0 band-pass filtered components; b) 3-component >5 Hz average envelope; c) 3-5 Hz band-pass filtered vertical 3-component.Yellow lines mark the start of some of the high-frequency detected signals. These appear to start near a surface wave velocity maximum. . . 75 8.13 Plot of determined β-values vs calculated σ from the recorded peak ground velocities
from equation 5.1. A clear relation between the two variables does not appear to exist. . 75 G.1 Nonlinear least-squares Marquardt-Levenberg fitting of r = vt linear function (green line)
to the distance of the stations to the epicenter (r) and the determined arrival times (t) of the observed second burst (in purple) for mainshock J (A) and mainshock K (B) (section 6.1.3). The fitting parameter corresponds average propagation speed with a result of 1.508± 0.027 km/s for mainshock J and 1.513 ± 0.026 km/s for mainshock K. . . 110 G.2 Nonlinear least-squares Marquardt-Levenberg fitting of r = vt linear function (green line)
to the distance of the stations to the epicenter (r) and the determined arrival times (t) of the observed second burst (in purple) for mainshock I. The fitting parameter corresponds average propagation speed with a result of 1.550± 0.030 km/s. . . 110
6.1 Events analyzed in Cape Verde, selected with the criteria including a limitation in ex-pected dynamic stress . . . 42 6.2 Additional events with magnitudes≥ 7 analyzed in Cape Verde for the 2007-2008
de-ployment . . . 42 6.3 Cases with |β| ≥ 2 for the stations of the 2002-2004 deployment and the permanent
SACV station in Cape Verde . . . 43 6.4 Cases with|β| ≥ 2 for the stations of the 2007-2008 deployment in Cape Verde . . . 44 6.5 Determined β-values for the 7 days before mainshock L in the same time period of the
passage of the surface waves, for all stations analyzed in this mainshock . . . 51 6.6 Results of the fitting to the the second bursts identified with a a nonlinear least-squares
Marquardt-Levenberg algorithm . . . 52 7.1 Events analyzed in Mozambique . . . 55 7.2 Cases with|β| ≥ 2 in Mozambique, using a 5 Hz high-pass filter . . . 56 7.3 Cases with|β| ≥ 2 in Mozambique for mainshocks C and D, using a 3-5 Hz band-pass
filter . . . 57 8.1 Events analyzed in the Lucky Strike volcano . . . 64 8.2 Cases with|β| ≥ 2 in the Lucky Strike volcano . . . 65 8.3 18 of the 34 events analyzed in the Azores archipelago. . . 68 8.4 16 of the 34 events analyzed in the Azores archipelago . . . 69 8.5 Cases with|β| ≥ 2 in Azores and the respective dynamic stress determined by the record
peak ground velocity with equation 5.1. Only CMLA station had significant variations. . 70 A.1 Determined βś for all mainshocks for station SACV and stations from the 2002-2004
deployment. . . 88 A.2 Determined βś for all mainshocks for stations from the 2007-2008 deployment. . . . 89 B.1 Determined βś for all mainshocks for the 5 Hz high-pass filtered data in Mozambique. . 92 B.2 Determined βś for all mainshocks for the 3-5 Hz band-pass filtered data in Mozambique. 93 C.1 Determined βś for all mainshocks for all the OBS deployments. . . . 96 D.1 Determined βś for all mainshocks in Azores. . . . 98 F.1 Coordinates of the stations in Cape Verde. . . 106 F.2 Coordinates of the stations in Mozambique. . . 107 F.3 Coordinates of the OBS stations deployed in Lucky Strike volcano. . . 108
Introduction
Earthquake-earthquake interactions are still important questions of study in earthquake seismology. One of the most obvious examples of this interactions are the aftershock sequence that can occur in the af-termath of a mainshock near its source. Since observations of the seismicity rate increase in Western United States at distances up to more than 1250 km after the Landers (7.3 Mw) earthquake in California, 1992, widespread evidences for a new mode of interaction at remote distances have been recorded. This mode called Dynamic Triggering is now considered a robustly observed phenomenon. It is also widely recognize that volcanic structures can be affected by the passage of remote large earthquakes seismic waves.
The understanding of the dynamic earthquake triggering could help improve the understanding of earthquake mechanics and therefore better assess seismic hazard by being a possible tool to study the processes that trigger slip on a fault, earthquake nucleation and to measure the stresses needed for a fault to fail. For this a better understanding of the triggering mechanisms and the conditions for it to occur is necessary. More observations of the phenomenon could help address this questions.
This study is based in previous studies, Peng et al. [2014] and Aiken and Peng [2014], and its objective is to search for evidences of dynamic triggering in four regions not thoroughly searched before for this phenomenon: Cape Verde, Mozambique and in the Mid-Atlantic Ridge in the Lucky Strike volcano and the Azores archipelago. These are volcanic and rifting (extensive regime) settings where the majority of remote dynamic triggering observations have been made.
A detailed introduction to the phenomenon of dynamic triggering is made in chapter 2 where the fundamentals of seismic waves propagation and dynamic stress are presented as well as the previous observations of dynamic triggering, the proposed mechanisms for the phenomenon and the mathematical tools used to link observations of increased seismicity to the passage of seismic waves. In chapter 3 the main geophysical and geological features of the studied regions are briefly outlined and a summary of reported seismic events in the regions is made. Data used in the study is presented in chapter 4. Chapter 5 describes the methods and tools used to assess seismicity changes during the passage of remote earthquakes surface waves. In each of chapters 6, 7 and 8 the results from the study are reported and discussed for each of the study regions. Chapter 9 presents the main conclusions of this work and propose further work that can improve the complete understanding of the results.
Dynamic Triggering
The Earth’s crust is brittle and many faults occur along its extent. These faults slowly accumulate the long wave length stresses due to the motions of the tectonic plates for decades, centuries or longer, remaining below their frictional strength. The accumulated stress is mainly released by brittle failure when the local failure threshold is exceeded and two sides of a fault move in relation to each other. This movement can be a sudden slip generating an earthquake or a continuous slow slip that generates tremor-like seismic events that have durations between days to years. Faults are also affected by short to mid-term short-wavelength stresses that provoke fluctuations in the stress field possibly exceeding the failure threshold and triggering a seismic event. Hill and Prejean [2007] list the most likely significant sources of these short to mid-term short-wavelength stresses as: shallow earthquakes, magmatic intrusions, anthropogenic activities, solid earth tides and ocean loading and seasonal meteorogical factors.
It is commonly assumed that the relationship between changes in the stress field and the occurrence of an earthquake on a fault can be expressed by a change in the Coulomb failure function (CFF), equations 2.1 to 2.3 [Hill and Prejean, 2007]. τ and σn represent, respectively, the shear and the normal stress
components acting on a fault and µsand C are the static coefficient of friction and the cohesive strength,
respectively. CFF is by convention ≤0 and according to Byerlee’s law for frictional failure CFF = 0 corresponds to Coulomb failure. A ∆C F F > 0 means the stress state is closer to failure.
C F F =|τ| − µsσn− C (2.1)
C F F = C F Fi+ ∆C F F (2.2)
∆C F F = ∆τ − µs∆σn (2.3)
Triggering is the term used to describe the process by which stress changes resulting from an earth-quake induce or retard seismic activity. It can be caused by three stress transfer modes: static, quasi-static or dynamic.
Static and quasi-static triggering occur due to the permanent stress changes produced by the main-shock that alter the stress field in the vicinity of the source (near field or aftermain-shock zone), within one or two fault lengths, decaying with distance approximately as ∆−3 and ∆−2, respectively (∆ is the dis-tance from the epicenter). In zones of stress shadow, zones where the stress field is relieved by the near earthquake, is also thought to occur an inhibition of earthquake activity.
Figure 2.1: Diagram from Kilb et al. [2000] illustrating differences between static and dynamic stresses
with distance in terms of idealized time histories for peak changes in dynamic (CFF(t)) and static (CFF) Coulomb stress. CFF(t) is the time dependent version of CFF (eqn 2.3). The double arrows show peak values for CFF(t) and CFF.[Adapted from Hill and Prejean, 2007].
stresses that propagate as seismic waves and temporary alter the stress field. These stresses can act in the far-field as they decay slower than static stresses (∼ ∆−2 for the body waves and∼ ∆−3/2 for the surface waves). Figure 2.1 illustrates the changes in stress with distance to epicenter representing the changes of dynamic (∆C F F (t)) and static (∆C F F ) Coulomb stress.
2.1
Seismic waves and their propagation through Earth
To comprehend the phenomena of dynamic triggering it is necessary to understand the basics of seismic waves and how they propagate through the Earth.
When considering the three-dimensional homogeneous vector equation of motion for a uniform, isotropic, linear elastic medium (Equation 2.4, Shearer [2009]) two solutions are possible: the com-pressional, P, waves and the shear, S, waves, called body waves. In equation 2.4 u is the displacement vector and λ and µ are the Lamé parameters.
ρ¨u = (λ + 2 µ)∇∇ · u − µ∇ × ∇ × u (2.4)
P waves travel faster than S waves and their particle motion is perpendicular to the wavefront in the direction of wave propagation. Therefore the P wave produces motion only in the vertical and radial directions. The S waves have a particle motion perpendicular to the direction of wave propagation and cannot propagate in mediums where rigidity disappears, as fluids.
Figure 2.2: Global seismic ray paths and phase names, computed for the PREM velocity model. P waves
are shown as solid lines, S waves as wiggly lines.The different shades indicate the inner core, the outer core, and the mantle. [FromShearer, 2009]
they interact with the discontinuities giving rise to different seismic phases, due to the change of seismic velocities and conversions between compressional and shear waves. These seismic phases have different travel times and amplitudes than the direct waves and some can be identified in seismograms. Figure 2.2 shows an example of the ray paths of these seismic phases.
When body waves reach the free surface other solutions are possible, the surface waves. These can be of two types: Rayleigh waves and Love waves. These propagate parallel to the Earth’s surface. Sur-face waves travel slower and, as stated above, have a slower decay than body waves. Their velocity depends strongly on the wave frequency and at teleseismic distances they generally are the strongest ar-rivals recorded. Love waves are formed through constructive interferences of multiples of the S wave horizontal motion component in a surface layer with increasing velocity with depth and are transversely polarized. The Rayleigh waves are formed by the interaction of the P wave and S wave vertical motion component, are radially polarized and can exist at any free surface. Rayleigh waves involve shearing and compressional and dilational particle motion and Love waves involve only shearing.
Figure 2.3 shows an example of the identified P, S, Love and Rayleigh waves in a three-component seismogram with the radial, transverse and vertical components.
At solid-liquid interfaces the seismic waves can be converted to acoustic waves. In the ocean these acoustic waves can propagate in the SOFAR (Sound Fixing and Ranging channel) channel, a water layer where sound velocity is minimum and acts like a waveguide. The acoustic wave is converted to seismic waves at the shore or at islands and can then be recorded by seismometers. These waves are called Tertiary (T) waves as they travel slower than the P and S waves, at the speed of sound∼ 1500 m/s. T waves have emergent onsets and are also identified in hydrophones at the ocean. Since T waves have a decay∼ ∆10−1 they can be used to detect small earthquakes in marine environments. The physical mechanism that leads the waves into propagating in the SOFAR channel and where the acoustic-seismic
Figure 2.3: Three-component seismograms of the Mw6.0 Kyrgyzstan earthquake on the 19th of July
2011 recorded at station SUR in South Africa. The data have been rotated to the great circle path and Butterworth band-pass filtered between 0.0125-0.035 Hz. Seismograms are identified with P- and S-phases, as well as the surface waves (Love and Rayleigh). [From Domingues, 2016]
conversion occurs is still not understood [Okal, 2008; Dziak et al., 2004].
2.2
Triggering by dynamic stress changes
Remote triggering after major earthquakes was first reported by Hill et al. [1993] that observed an increase in seismicity across the western United States after the magnitude 7.3 Landers earthquake of 28 June 1992. Activity was observed over 1250 km from the mainshock and most of it started during the passage of the large amplitude Love and Rayleigh waves trains, with some delayed increase in seismicity also observed in some areas. The distance of this triggered seismicity could not be explain by static or quasi-static stress that decay quickly with distance neither by viscous deformation that acts in the scale of years. The coincidence with the passage of the surface waves led to the hypothesis that the triggered activity was associated with the dynamic stresses imposed during the passage of the seismic waves. Dynamic Triggering is now a well documented phenomenon. Brodsky and van der Elst [2014] review reports
observations in more than 30 major earthquakes. However, the mechanisms of dynamic triggering are still unknown. The observation of cases of delayed activity increase and of prolonged activity increase also pose a challenge to understanding the mechanisms of dynamic triggering [van der Elst and Brodsky, 2010].
Most of the observed onsets of the remote increased seismicity occur during the passage of the sur-face waves train (figure 2.4), called instantaneous dynamic triggering, with the Rayleigh waves being the most effective waves at triggering in most cases. Remote triggering coinciding with the arrival of the S wave was also observed in one occasion by Prejean et al. [2004]. Triggered seismicity can continue after the passage of the seismic waves and some cases of increase seismicity beginning hours or days after the passage of the waves have also been observed, this is called delayed dynamic triggering [Brodsky and
Figure 2.4: Examples of triggered seismicity detected within the surface wave coda from the Denali
Fault earthquake at Mammoth Mountain. The top trace is a broadband seismogram, and the middle trace is a high-pass filtered version of the broadband record revealing the locally triggered activity as a spasmodic burst consisting of rapid-fire earthquakes. The bottom panel is a spectrogram of the broadband seismogram from station OMM located 4km southeast of Mammoth Mountain. Note the utility of the spectrogram display in revealing local earthquakes within the low-frequency coda as narrow vertical bands rich in high-frequency energy. Modified from Prejean et al. [2004]. [Adapted from Hill and
Prejean, 2007]
van der Elst, 2014]. Figure 2.4 has an example of triggered seismicity detected during the passage of the
Rayleigh waves, in the surface wave coda and after the surface wave train from the Denali earthquake. Triggering in the near field, aftershock zone, where static and dynamic stresses have similar amplitudes, is ambiguous and different authors attribute it to static, postseismic or dynamic agents. Some attribute the observed aftershocks in shadow zones to dynamic triggering. Figure 2.5 has an example where earth-quakes occurred in zones of stress shadow.Hill and Prejean [2007] and van der Elst and Brodsky [2010]
found that a portion of aftershocks in the near field can be related to dynamic stresses but there must be additional triggering components.
Dynamic triggering of seismicity has been observed in various tectonic settings. The majority of observations were made at extensional regimes and geothermal and volcanic systems but observations have also been made in subduction zones, convergent regimes and at transform faults [e.g. Gomberg et al., 2008]. Velasco et al. [2008] in a global search for dynamic triggered seismicity found that its occurence is independent of the mainshock mechanism and its found in all tectonic regimes. Velasco et al. [2008] using open data from IRIS found cases of increased seismicity in Azores and no case was reported in the SACV station in Cape Verde. In East Africa positive clear cases of dynamic triggering were reported in
Figure 2.5: Coulomb stress changes caused by the Joshua Tree, Landers, and Big Bear earthquakes
mapped at a depth of 6.25km (halfway down the fault) and (M1) aftershock distribution during the 25 days following the Landers main shock. Source parameters are those used by King et al. [1994]. The
location (open star) and the surface rupture (solid black line) of the M 7.1, 1999, Hector Mine earthquake epicenter is shown on the map. The Coulomb stress changes are plotted with a reduced amplitude (color) scale with respect to those of the previous figures. Redrawn from King et al. [1994] . [Adapted from Hill
the region of the Main Ethiopian rift and in East South Africa. Earthquakes with strong directivity also affect the characteristics of the dynamically triggered seismicity by enhancing the amplitudes of dynamic stresses in specific quadrants.
Most observed cases of dynamic triggering are due to mainshocks with magnitudes > 6.5, and bigger magnitude events seem to be more effective at triggering. Brodsky and Prejean [2005] studied triggered
seismicity at the Long Valley Caldera and found that longer-period seismic waves are more effective at triggering in this region. As to the dynamic stresses necessary for triggering there does not seem to exist a global threshold [Aiken and Peng, 2014] and cases with dynamic stresses < 1 kPa (below solid Earth tides stresses) have been reported [Wang et al., 2015]. Sites with repetitive dynamic triggered seismicity have been observed, although do not always respond to similar distanced large earthquakes, this could mean each site has a specific recharge time to return to a near-critical state after the passage of dynamic stresses [Hill and Prejean, 2007].
Types of dynamic triggered seismicity include earthquakes (mostly microearthquakes) and tremor.
2.2.1 Microearthquakes
Triggering of microearthquakes has been observed mostly at extensional and transtensional stress regimes and at geothermal and volcanic areas. The few observed examples of remotely triggered earthquakes in transpressional regimes are in volcanic regions where earthquakes in or below the volcanic edifice show dominantly normal faulting. One reason for this observations might be that faults in extensional regimes tend to be weaker than those found in compressional regimes. Some evidences for dynamic triggering in the near-field in compressional and transpressional regimes seem to exist based on pre-instrumental descriptions in the Ohio River Valley and in Coast Ranges but Hill and Prejean [2007] argue that there is a lack of evidences for dynamic triggering in well-instrumented compressional or stable-intraplate settings. The triggered microearthquakes occur within the brittle crust with depths less than 15-20 km and instantaneous triggering may or may not be in phase with the surface waves.
2.2.2 Tremor
Tremor outside volcanic regions was first observed in a subduction zone southwest of Japan [Obara,
2002] and was described as tectonic or nonvolcanic tremor because it was not related to magma move-ments. Some studies observe that triggered tectonic tremor have similar character to the tremor observed around volcanoes and argue that, although sources may be different, the generative mechanisms may be similar and so describe it only as tremor [Peng et al., 2009]. Triggered tremor is characterized by a noise-like signal with no clear impulsive phase and with a duration that can go up to days. These signals have been associated with slow slip events that occur for periods of time longer than classical earthquakes, events that can also be aseismic.
Triggered tremor has been observed in subduction zones, for example in Japan and Cascadia
[Rubin-stein et al., 2007], in transform fault environments in California [Peng et al., 2009] and in arc-continent
collision environments in Taiwan [Peng and Chao, 2008]. An example of the triggered tremor detected in Taiwan is in figure 2.6
The triggered tremor was observed in zones where ambient tremor is known to occur and seems to be triggered both by Love and Rayleigh waves, Rayleigh waves being the most effective. The events are mostly located below the brittle-ductile transition zone deeper than triggered microearthquakes [Chao
Figure 2.6: Examples of triggered tremor during the surface waves of the 2001 November 14 Mw 7.8
Kunlun earthquake. (a) Broad-band transverse component seismogram recorded at station TPUB. The time is relative to the origin time of the Kunlun earthquake. The two arrows mark the approximate arrival time of the P and S waves. (b) 2–8 Hz bandpass-filtered transverse-component seismogram showing the high-frequency P waves and the triggered tremor during the passage of the Love waves. (c) The spectrogram of the transverse-component seismogram at station TPUB. The triggered tremor signals are shown as narrow vertical bands rich in high-frequency energy as compared with the teleseismic P and surface waves. [Adapted fromPeng and Chao, 2008]
2.3
Proposed models for the generation of dynamic triggering
Several models have been proposed for the mechanism that generate the response to the passing dynamic stresses but none seems to explain all the observed cases and it is possible that different mechanisms exist. Most models have difficulty to explain triggering by small perturbating stresses and the common occurrence of delayed triggering.
Coulomb failure
The most simple explanation is that the seismic wave apply an extra loading in a fault near failure, CFF∼ 0, that leads to shear failure.
This mechanism has difficulty explaining the reason why so small dynamic stresses are necessary for triggering. One explanation considers high pore pressure. According to Brodsky and van der Elst [2014] an increase in pore pressure would have to be extreme, >>99%, if faults were in the beginning of their loading cycle. These extreme levels of pore pressure are possible in geothermal areas but it is also possible that triggering occurs only in areas in late loading cycle.
It agrees with tidal stresses bigger than the dynamic stresses of the seismic waves not leading to widespread regular triggering considering fault orientation. Tidal stresses have fixed orientations and waves can load different orientations. The delayed triggering is explained by considering that a first event can then trigger aftershocks that can lead to a cascade of events.
This model does not explain the observations that the Rayleigh waves seem to be more effective at triggering than Love waves and that extensional regimes seem to be more susceptible to triggering than compressional regimes [Brodsky and van der Elst, 2014].
Rate-state friction
This model considers experimental observations that a fault frictional strength depends on the history of stress, the slip rate (sliding velocity) and an evolving state empirical parameter that indicates if the frictional interface weakens with increasing velocity, described by the Dietrich-Ruina rate-state friction laws. If the frictional interface weakens with increasing velocity it is considered unstable and the stresses of the seismic waves can reduce friction and increase the sliding velocity even more leading to failure. This can explain the delayed triggering.
The shortcomings of this model are that laboratory experiments showed that seismic waves have short periods to be effective at triggering, unlike tidal stresses, and it cannot explain prolonged triggering by itself. This model also permits that seismic waves drive a stable or locked fault to an unstable state [Brodsky and van der Elst, 2014].
Viscous creep
This mechanism explains the prolonged sequence of triggered events as a result of local creep or slow slip events. Slow slip would be triggered by the seismic waves resulting in the sustained deep triggered tremor and low-frequency earthquakes observed in some areas. The mechanism that triggers the slow slip is unclear [Brodsky and van der Elst, 2014].
Permeability enhancement
Seismic waves can affect permeability by uncloging fractures and so enhance permeability inside a fault zone. This mechanism makes possible that small stresses result in large flows.
Earthquakes could be triggered by pore pressure redistribution or drainage. Drainage would lead to a sudden increase in permeability allowing seismic slip. A permeability enhancement would also facilitate fluid flow from high to low-pressure regions changing the strength in lock portions of the fault that can fail leading to earthquakes [Brodsky and van der Elst, 2014].
Granular flow
This mechanism is based in the fact that grains in fault zones do not support uniform stresses. A large distribution of stress may be support by individual grains and most of the grains are only held together by small stresses and so have weak frictional locking. These grains could therefore be affected by small perturbations and have a major effect. This can explain the small stresses necessary for triggering. Gran-ular mediums are also more easily weakened by dilatational strains making possible that Rayleigh waves are more effective at triggering [Brodsky and van der Elst, 2014].
Subcritical crack growth
Cracks in fault zones can grow due to chemical reactions enhanced by hot fluids. The stress transfered due to the passing seismic waves can assist the growth of the cracks to a critical length at which there is a release of elastic energy. It is considered that this mechanism needs more study and laboratory data to be fully assessed [Brodsky and van der Elst, 2014].
2.4
Interaction between earthquakes and volcanoes
It has been observed that distant earthquakes perturb volcanic systems and Linde and Sacks [1998] con-cluded that in one or two days after large earthquakes more eruptions occurred in a radius of 750 km to the epicenter. Manga and Brodsky [2006] however concluded that the stresses related to earthquakes are smaller than those needed to start an eruption since large earthquakes like Sumatra 2004 and Alaska 1964 were followed by an absence of reported eruptions and observations show that only a small fraction of eruptions are triggered immediately by large earthquakes. Nonetheless, as stated before, cases of trig-gered earthquakes have been observed in volcanic regions and these are thought to be a secondary effect of the deformation of the magma bodies triggered by the earthquakes that can explain delayed triggering in volcanic regions.
Various mechanisms for the interaction of the seismic waves with magmatic fluids have been pro-posed.
Bubble excitation
Bubble excitation is considered an obsolete model. This model was based in changes in bubble pressur-ization in a two-phase fluid. This could be done by rectified diffusion where gas in the fluid is pumped into bubbles during the dilatational phase of the passing seismic waves, increasing pressure in bubbles that consequently increases pore pressure in the interstitial fluid and triggers earthquakes. Another hy-pothesis is the advective overpressure model that considers that bubbles in the walls of a magma body
can be loosen by the strains of the seismic waves and start to rise in the magma so increasing its pressure and deforming the chamber triggering earthquakes [Hill and Prejean, 2007].
This mechanism was deemed ineffective as bubbles seem to resorb before the pressurization [Ichihara
and Brodsky, 2006].
Magmatic intrusions
This model proposes that the seismic waves can trigger magmatic intrusions that fracture the shallow crust triggering earthquakes, as a secondary response, by changing the static stress field or increasing pore pressure [Hill and Prejean, 2007].
Relaxing magma body
Partially cristalized magma bodies can accumulate deviatoric stresses that can be released by the dynamic stresses of the seismic waves. The deviatoric stresses change the stress field that can lead to triggered seismicity [Hill and Prejean, 2007]. This model would require a rather long relaxation period and other mechanisms would have to be involved in sites with observed repetitive triggered seismicity.
Sinking crystal plumes
This model considers the effects that the seismic waves can have in crystals in ceilings and walls of magma chambers. This crystals can fall and sink in the magma stimulating convection. This could lead to the formation and growth of bubbles increasing the pressure and deforming the crust. This mechanism can lead to triggered earthquakes and eruptions [Hill and Prejean, 2007].
2.5
Triggering statistics
Various statistical tests are used in order to investigate the causal link between the observations of in-crease in local seismicity and the passing of seismic waves of remote large earthquakes. The most used test for the statistical significance of dynamic triggering is the β-statistic of Matthews and Reasenberg [1988] [Hill and Prejean, 2007]. This statistic calculates the significance of the changes in the seismicity comparing the number of events occurring in the analyzed period of time with the expected number of events in that period assuming a constant seismicity rate, normalized by the standard deviation of the expected number of events [Aron and Hardebeck, 2009]. The expected number of events is assumed by determining a background seismicity of the area of study. The β-statistic is calculated with equations 2.5 and 2.6, where Taand Tbare the time period analyzed and the time period considered for the background
seismicity, respectively, and Na and Nb are the number of events observed during Ta and Tb,
respec-tively. In studies of instant dynamic triggering Ta, also called the triggering window, usually corresponds
to the time between the arrival of seismic energy traveling at 5 and 2 km/s when most of the surface wave energy passes.
β = √ Na− N(Ta/T ) N(Ta/T )(1 − (Ta/T ))
(2.5)
A difference in seismicity rate between the two time periods is significant at 90% confidence for
|β| ≥ 1.64, at 95% for |β| ≥ 1.96 and at 99% for |β| ≥ 2.57. In general, β-statistic absolute values ≥ 2 are considered a significant rate change (with ∼95% confidence).


![Figure 3.12: Across-axis cross-sections of seismic events located by Crawford et al. [2013] and sub- sub-surface structure](https://thumb-eu.123doks.com/thumbv2/123dok_br/19195065.951433/54.892.112.784.110.354/figure-sections-seismic-events-located-crawford-surface-structure.webp)