UNIVERSIDADE DE LISBOA
FACULDADE DE CIÊNCIAS
DEPARTAMENTO DE BIOLOGIA VEGETAL
Dynamics of circulating coelomocytes during starfish
regeneration
Bárbara Xavier Louro de Oliveira
Mestrado em Biologia Molecular e Genética
Dissertação orientada por:
Doutora Ana Varela Coelho
Professora Doutora Rita Zilhão
AGRADECIMENTOS
Gostaria de começar esta dissertação agradecendo às instituições de acolhimento e a várias pessoas que me apoiaram de diferentes formas e que sem elas não seria possível a conclusão deste trabalho.
À Faculdade de Ciências da Universidade de Lisboa por ter sido a instituição da minha formação académica desde a Licenciatura.
Ao Instituto de Tecnologia Química e Biológica António Xavier por ter facultado todas as condições necessárias e fundamentais para a elaboração deste trabalho.
À Doutora Ana Varela Coelho pela orientação, disponibilidade e partilha de conhecimento. Pelo voto de confiança dado há um ano para trabalhar neste projeto fascinante no laboratório de Proteómica de Organismos Não Modelo, ITQB NOVA, muito obrigada.
À Professora Doutora Rita Zilhão, orientadora interna, pela curiosidade neste projeto e por ter sempre acreditado em mim. Obrigada por todo o suporte e dedicação ao longo destes anos desde a minha licenciatura na Faculdade de Ciências UL até aos dias de hoje.
Ao Doutor Rui Gardner, pela oportunidade de trabalhar em citometria de fluxo, por toda a partilha de conhecimentos, curiosidade, disponibilidade e espírito critico.
Ao Aquário Vasco da Gama, pelas excelentes condições para o acolhimento das estrelas-do-mar. Um especial obrigada à Doutora Fátima Gil e Miguel Cadete pela disponibilidade e apoio na manutenção dos animais.
À Cláudia Bispo e Cláudia Andrade (As Cláudias) da Citometria de Fluxo por todo o apoio que me deram sempre que foi preciso. E ao mais recente membro, Andreia Ribeiro.
À Catarina Franco por todos os bons momentos no laboratório e fora dele, por partilhares a tua paixão das estrelas-do-mar comigo. Por toda a tua amizade, um especial obrigada.
Aos meus colegas de laboratório com os quais me cruzei e partilhei caminho: Ricardo, Catarina G., Inês e Silvia, por todos os bons momentos que passámos e pelas apanhas de mexilhão, muito obrigada!
Aos amigos da faculdade com os quais partilhei momentos muito bons de trabalho e também de diversão: André Barateiro e André Carvalho. À Inês Guimarães pela partilha do percurso académico e amizade desde o primeiro dia da faculdade, obrigada!
Aos amigos do coração, Joana, Patrícia V., Patrícia B. , Miguel e Tomás por todo o apoio que sempre me deram nos momentos mais críticos e por todos os momentos de descontração, muito obrigada!
À minha mãe pelo amor incondicional, carinho e palavras sábias Ao meu pai, pela perseverança que sempre me ensinou. À minha avó, por todo o mimo.
RESUMO
A regeneração é um fenómeno regulado com implicações biológicas variadas. No Reino Animal, há diversos exemplos deste processo que envolvem a reparação de tecidos, órgãos e membros. No entanto, a regeneração nos vertebrados é limitada na medida em que não se observa a regeneração completa de todos os órgãos. Nos invertebrados, existe uma maior flexibilidade em termos de reparação e até mesmo de substituição de tecidos e/ou órgãos. Após predação ou autotomia, alguns animais são capazes de substituir o órgão ou a porção perdida e muitas vezes esta pode levar uma vida autónoma podendo ela própria regenerar e até formar um individuo completo, dependendo sempre da perda, mas também da capacidade de regeneração do organismo. Este fenómeno acaba por se sobrepor nos invertebrados com a reprodução assexuada.
Muitos equinodermes têm uma capacidade regenerativa elevada que se mantém ao longo de toda a sua vida, incluindo na fase adulta. A primeira resposta na regeneração é o fecho das feridas pelas contrações musculares e a formação de agregados de celómocitos, as células circulantes do fluído celómico que banha toda a cavidade interna dos equinodermes. Estas células têm um papel reconhecido na primeira linha de defesa do sistema imunitário que inclui várias funções, como coagulação e defesa contra organismos patogénicos por fagocitose.
Os equinodermes têm uma grande proximidade filogenética com os cordados. Contudo o estudo destes organismos ao nível molecular não é muito frequente. Devido à pouca informação relativamente ao seu genoma, transcriptoma, proteoma ou metaboloma e por haver outros organismos com mais informação reportada, estes facilitam as comparações extrapoladas com cordados. Embora o ouriço do mar Strongylcentrotus purpuratus seja o único equinoderme a ter o genoma sequenciado e anotado, e consequentemente vários estudos moleculares tenham sido possíveis, estes organismos têm a menor capacidade de regeneração observada entre as diferentes classes de equinodermes, tendo sido muito reduzida a sua contribuição para o estudo da regeneração.
Para uma maior compreensão dos coelomócitos, este trabalho apresenta a caracterização das populações celulares e a sua variância percentual durante o processo de regeneração.
Embora a classe Asteroidea não tenha sido utilizada extensamente, os organismos desta são uma excelente escolha para o estudo do processo da regeneração. Marthasterias glacialis L. é uma estrela do mar espinhosa, betónica que pode ser encontrada ao longo de toda a costa oeste portuguesa capaz de viver a vários níveis de profundidade (0–200m), podendo atingir até 70 centímetros de diâmetro e com capacidade de regenerar todas as partes do corpo (internas e externas), incluindo o sistema nervoso central. Devido ao facto de haver pouca informação relativa aos equinodermes e mais especificamente às estrelas do mar, é por vezes difícil encontrar correlações na literatura com o estudo aqui apresentado. Efetuar analogias com outras classes de equinodermes é também desafiante, devido às diferenças inter-espécie, na metodologia escolhida para o estudo das células (diferentes tipos de microscopia) ou até no manuseamento dos celomócitos (células vivas ou fixadas, ex vivo ou em cultura). Desta forma, a primeira fase deste estudo foi dedicada à caracterização das populações celulares do fluído celómico através da citometria de fluxo e por microscopia de fluorescência.
De forma a prosseguir com a caracterização do fluído celómico, algumas etapas de otimização tiveram de ser efetuadas para que o manuseamento das células ex vivo se fizesse sem comprometer o estudo ou os seus objetivos. Estas otimizações foram feitas ao nível das condições que reduzissem a agregação dos celomócitos após recolha do fluído celómico com o uso de diferentes tampões anticoagulantes, de diferentes condições de centrifugação, de diversas concentrações de corantes para que a análise de diferentes estudos (viabilidade celular e ciclo celular) fosse possível.
RESUMO
O desafio da optimização do ensaio de viabilidade celular centrou-se na escolha de dois corantes compatíveis, ou seja, que apresentassem comprimentos de onda de emissão e locais de ligação ao DNA distintos para que a análise fosse mais fiável.
Duas populações celulares no fluído celómico (aqui designadas como P3 e P5) foram distinguidas através da citometria de fluxo e analisadas individualmente em termos de abundância no fluído celómico, morfologia, viabilidade celular e ciclo celular. A células da população P3 são as menos abundantes no fluído celómico, têm uma forma arredondada com um diâmetro nunca superior a 4 µm. Quanto à sua caracterização ao nível da viabilidade celular estas incorporam os diferentes corantes de exclusão de viabilidade celular após a recolha do fluído celómico, indicando uma baixa ou até nenhuma viabilidade celular. A população celular P5, que é regularmente 4 vezes mais numerosa que a população P3, apresenta várias morfologias, dependendo da concentração salina do meio ou do substrato que contactam, assim o seu tamanho varia entre 7 µm a 23 µm. Estas têm uma alta viabilidade celular no momento em que abandonam o organismo, observada pela não incorporação dos corantes de exclusão. A sua viabilidade vai diminuindo ao longo do dia da experiência mesmo em condições de escuridão e baixa temperatura (4ºC).
As diferentes fases do ciclo celular variam na quantidade de DNA em cada célula (a fase G2M tem o dobro do conteúdo de DNA da fase G0G1). Para o estudo do ciclo celular, a concentração do corante (iodeto de propídeo) tem de ser saturante para que se possa inferir em que fase do ciclo as células se encontram. Para as células P3 não foi possível detectar eventos para todas as fases do ciclo celular, podendo ser devido à falta de viabilidade que apresentam, tendo uma atividade metabólica ou mitótica reduzida. As células P5 apresentam um ciclo celular bem definido, no qual a maioria das células se encontra na primeira fase do mesmo.
Devido ao aparecimento de gâmetas masculinos, em algumas amostras de fluído celómico, a sua caracterização morfológica e análise citométrica foi também possível.
Os estudos feitos até ao momento envolvendo celomócitos da espécie M. glacialis centraram-se na caracterização do centraram-seu proteoma total, centraram-sem centraram-separação das diferentes populações, e na proteómica diferencial nas diferentes fases da regeneração. Para isso a caracterização do proteoma de cada população, isolada por citometria de fluxo seria o próximo passo. Contudo houve algumas dificuldades na recuperação das células após a sua separação por citometria de fluxo. Sendo este processo provavelmente violento física e osmoticamente para as células. A reprodutibilidade da técnica para estes tipos celulares foi muito baixa, devido à disparidade dos resultados nos diferentes ensaios.
O estudo da proteómica diferencial foi feito para pontos temporais que cobrissem as diferentes fases da regeneração (48 horas, 13 dias e 10 semanas). A maioria dos estudos feitos em celomócitos durante a regeneração sugere que o seu papel é mais determinante na primeira fase do processo regenerativo – cicatrização. Assim optou-se pelo estudo dos celomócitos durante o primeiro dia de regeneração.
Algumas diferenças estatisticamente significativas foram observadas nas percentagens de células P5 nas primeiras horas (2, 8 e 24 horas) após amputação comparando com os valores relativos a um grupo controlo. Antes da indução da regeneração (t=0), a população P5 no grupo de animais posteriormente amputados apresenta uma média de valores percentuais superior à do grupo controlo. Após indução da regeneração, as proporções da população P5 diminuem significativamente. Os principais fatores a contribuírem para esta perda de células será a perda de fluido celómico através das feridas e o seu recrutamento para o processo de coagulação. A variação da proporção da população P3 ao longo do tempo mostrou ser independente do processo de regeneração. Os gâmetas masculinos apareceram durante o estudo dos celomócitos na regeneração apenas nos indivíduos que foram amputados.
RESUMO
A caracterização das populações de celomócitos apresentada nesta dissertação constitui um contributo para o conhecimento das funções fisiológicas dos celomócitos circulantes desta espécie de equinoderme.
ABSTRACT
Regeneration is a phenomenon that occurs throughout the Animal Kingdom and it has wide biological implications. Echinoderms have an outstanding regeneration ability that allows the replacement and regrowth of lost organs or body parts due to injury caused by autotomy or predation. The first response in the regeneration process is to close all the wounds with muscle contraction and coelomocytes clots.
Coelomocytes are free circulating cells in coelomic fluid, which fills the internal cavity of echinoderms. These cells are known to have a role in the first defence by the immune system, with different functions as clotting, and defence against pathogens such as phagocytosis.
Starfishes are excellent organisms to explore organ and tissue regeneration. Marthasterias
glacialis L. belongs to Asteroidea class and it has whole body regeneration ability, including the
central nervous system. Due to a lack of knowledge, it is difficult to find information about coelomocytes characteristics or to compare it with other classes of echinoderms, due to interspecies variability and to the diverse methodical approaches used in the several published studies. Thus the first part of this study was to characterize different coelomocytes population through flow cytometry and fluorescence microscopy.
In order to perform coelomic fluid cells characterization, several optimization steps had to be done so as to know how to handle these cells ex vivo. Two different populations (here named P3 and P5) were found among coelomocytes and they were studied individually in terms of abundance, morphology, cell viability and cell cycle. P5 showed to have morphological similarities with phagocytes population whereas P3 cell populations seemed to have low metabolic or mitotic activity.
Due to male gametes appearance in coelomic fluid samples, its characterization through flow cytometry was possible.
Coelomocytes dynamics during regeneration was also assessed during the first day after amputation. There were a few statistically significant differences only in P5 cell population percentage in the first hours (2h, 8h and 24h) after amputation when compared with values for non-amputated animals.
The work presented in this dissertation will hopefully contribute to an increase on the available cellular and molecular knowledge about circulating coelomocytes in M. glacialis.
TABLE OF CONTENTS
AGRADECIMENTOS I RESUMO II ABSTRACT V LIST OF FIGURES VII LIST OF TABLES VIII LIST OF ABBREVIATTIONS IX 1. INTRODUCTION 1 ECHINODERMS 1 REGENERATION 1 CIRCULATING COELOMOCYTES 2COELOMOCYTES CHARACTERIZATION USING FLOW CYTOMETRY 4
PROTEOMICS DURING REGENERATION 4
MODEL OF STUDY: MARTHASTERIAS GLACIALIS STARFISH 5
AIM OF THE STUDY 5
2. MATERIALS AND METHODS 6
ANIMAL COLLECTION AND HANDLING 6
COELOMIC FLUID COLLECTION 6
SAMPLE HANDLING 6
REGENERATION ASSAYS 6
FLOW CYTOMETRY 6
CELL VIABILITY ASSAY 6
CELL FIXATION AND CELL CYCLE 7
FLUORESCENCE MICROSCOPY 7 CELL SORTING 7 PROTEIN EXTRACTION 7 1D-SDS PAGE 7 STATISTICAL ANALYSIS 7 3. RESULTS AND DISCUSSION 9
COELOMIC FLUID CELLS CHARACTERIZATION 9
CELL VIABILITY 12
CELL CYCLE 13
MALE GAMETES 14
REGENERATION 14
COELOMOCYTES PROTEIN EXTRACTION 20
4. CONCLUSIONS 21
5. FUTURE WORK AND PERSPECTIVES 22
LIST OF FIGURES
Figure 1.1 Cell shape in suspension (A-B) or on glass (C-D). A. petaloid cell; B. filopodial cell. Shape change also occurs when cells are attached to glass substrate; C. petaloid cell; D. filopodial cell. Scale bar=10µm. [1] ... 2
Figure 1.2 Marthastherias glacialis circulating coelomocytes morphotypes under light microscopy. Adapt [16] ... 4
Figure 3.1 Flow cytometric analysis of circulating coelomocytes. Coelomocytes were stained with DRAQ5. A. Representative dot plot of coelomocytes with cell populations gated. B. Overlap of dot plots was created to show representative forward and side scatter properties of P3 (red) and P5 (blue) cell populations. C. Overlap of histograms of P3 (red) and P5 (blue) cell populations was created to show cell populations ploidy. ... 9
Figure 3.2 Flow cytometric analysis of circulating coelomocytes using sodium citrate as anticoagulation solution. Coelomocytes were stained with DRAQ5. Coelomocytes were stained with DRAQ5. A, C. Dot plots representation of (A) coelomocyte populations and (C) its singlets gated without using sodium citrate. B, D. Dot plots representation of sodium citrate effect in (B) coelomocyte populations and (D) its singlets gated. ... 10
Figure 3.3 Flow cytometric analysis of circulating coelomocytes using ACG as anticoaluant solution. Coelomocytes were stained with DRAQ5. Coelomocytes were stained with DRAQ5. A, C. Dot plots representation of (A) coelomocyte populations and (C) its singlets gated without using anticoagulant solution. B, D. Dot plots representation of ACG effect in (B) coelomocyte populations and (D) its singlets gated ... 10
Figure 3.4 Live coelomocytes morphotypes under fluorescence microscopy. Cells were stained with DRAQ5 (red) a.P3 cell b.P5 cells. Scale bar 10 µm. ... 11
Figure 3.5 Sorted coelomocytes microscopic composite images. A. P3 cell. B. P5 cells in filopodial (up) and petaloid (down) morphotypes. C, E. P5 cell population in petaloid morphology. D.Filopodial P5 cell. A-D Cells were stained with DRAQ5. E Cells were stained with DRAQ5 (red) and DAPI(blue). Scale bar 10 µm. ... 11
Figure 3.6 Flow cytometric analysis of circulating coelomocytes viability. Cells were stained with DRAQ5 and DAPI. A. Representative dot plot with P3 and P5 cell populations gated. B. A quadrant plot of coelomocytes showing DAPI+ (dead) and DRAQ5+ DAPI- (live) coelomocytes. C. A dot plot showing that in live cells quadrant, these belong mainly to P5 cell population. D. A dot plot showing that in dead cells quadrant they belong mainly to P3 cell population. ... 13
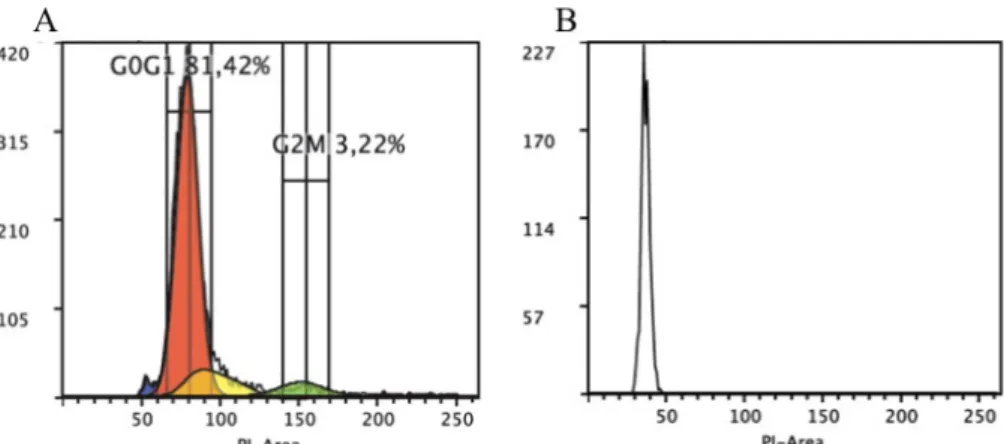
Figure 3.7 Flow cytometric analysis of cell cycle. Cells were fixed with 70% ethanol and stained with PI A. Representative histogram of P5 singlets cell cycle showing different phases: sub- G0/G1 (blue) G0/G1 (red), S (yellow) and G2M (green). B. Representative histogram of P3 cell population. PI fluorescence is proportional to DNA content. ... 14
Figure 3.8 Male gametes. A. Flow cytometric analysis of male gametes. Cells were stained with DRAQ5. B. Microscopic image of male gametes. Arrow indicates gametes flagella. Scale bar 10µm 14
Figure 3.9 Graphical representation of P5 cell population dynamics during the first 24h of regeneration. Dot scatter plot of P5 cell proportion in different time points. Mean (dotted lines). Error bars (±St.Dev). is also represented . * Statistical significance (p-value<0.05). ... 16
Figure 3.10 Graphical representation of P3 cell population dynamics during the first 24h of regeneration. Dot scatter plot of P3 cell proportion in different time points. Mean (dotted lines). Error bars (±St.Dev). is also represented . ... 18
Figure 3.11 Graphical representation of male gametes dynamics during the first 24h of regeneration. Dot scatter plot of male gametes percentage in different time points. Mean (dotted lines). Error bars (±St.Dev). is also represented . ... 19
Figure 3.12 Gel separation of protein extracts by 1D electrophoresis. BSA control (left), total coelomocytes (centre) and P5 sorted cells (right). ... 20
LIST OF TABLES
Table 2.1 Flow cytometers optical configuration ... 6
Table 2.2 Final concentration of different fluorochromes used. ... 7
Table 3.1 Statistical analysis of P5 cell percentage between control starfishes in different days ... 15
Table 3.2 Statistical analysis of P3 cell percentage between control starfishes in different days ... 15
Table 3.3 Descriptive Statistics of P5 cell population relative percentage in different time points ... 16
Table 3.4 Statistical Tests Analysis of P5 cell population during regeneration. Shadowed cells have p-value<0.05 ... 17
Table 3.5 Descriptive Statistics of P3 cell population relative percentage in different time points ... 17
Table 3.6 Statistical Tests Analysis of P3 cell population during regeneration ... 18
Table 3.7 Percentages of male gametes in 4 starfishes during regeneration. Mean and standard deviation are also included. ... 19
LIST OF ABBREVIATTIONS
1D-SDS PAGE One-dimensional SDS Polyacrylamide Gel Electrophoresis 7-AAD 7-Aminoactinomycin D
A.rubens Asterias rubens ACG Anticoagulant
ACM Muscarinic acetylcholine receptor ASW Artificial Sea Water
BSA Bovine Serum Albumin
CF Coelomic Fluid
DAPI 4',6-Diamidino-2-Phenylindole DNA Deoxyribonucleic acid
DRAQ5 Deep Red Fluorescing Anthraquinone 5 DRAQ7 Deep Red Fluorescing Anthraquinone 7
EGTA ethylene glycol-bis(β-aminoethyl ether)-N,N,N',N'-tetraacetic acid
FS Forward Scatter
h.p.a. hours post amputation
HEPES 4-(2-hydroxyethyl)-1-piperazineethanesulfonic acid HSP70 Heat Shock Protein 70
Lin Linear
Log Logarithm
M. glacialis L. Marthastherias glacialis Lineu
mS Micro Siemens
p.a. post amputation
PBS Phospate Buffered Saline
PI Propidium Iodide
RNA Ribonucleic acide
S. droebachiensis Strongylocentrotus droebachiensis
SDS Sodium Dodecyl Sulfate
SS Side Scatter
1. INTRODUCTION Echinoderms
Echinodermata are a phylum of benthic marine invertebrates. They are phylogenetically close to chordates and are the basal group of deuterostomes. Echinodermata comprises five classes: Crinoidea (sea lilies), Asteroidea (starfishes), Ophiuroidea (brittle stars), Echinoidea (sea urchins) and Holothuroidea (sea cucumbers). They lack apparent sensory organs or any kind of head and its locomotion is largely by means of tube feet, which function by means of a water vascular system. All echinoderms have some form of calcified skeleton, which is more or less extensive in the various classes. The coelomic cavity contains the gonads and gut of the animal, bath in coelomic fluid. The composition of coelomic fluid is similar to sea water in terms of minor dissolved salts and other minerals [1].
All echinoderms have the ability to repair and regenerate lost parts of their body either internal or external parts particularly arms, appendages (pedicellariae and spines) and viscera (digestive system and gonads) even to complete re-growth of whole individuals from body fragments[2,3], after injury or autotomy[4,5]. Regeneration seems to be a rapid and effective process when mutilations involve a vital organ or the injury is particularly traumatic[3,6].
Regeneration
Regeneration is an important regulatory phenomenon with wide biological implications. It is common throughout the Animal Kingdom and can involve only limited and circumscribed processes of turnover or repair at the cellular and tissue levels[7]. More extensive processes of replacement or regrowth occur at the level of defined structures and organs lost following self-induced or traumatic amputation, or even when reconstruction of whole individuals from small body fragments takes place (and thus overlapping with typical asexual reproductive processes). It is relevant that in many cases the detached body fragments can survive for a long time and, at least in some cases, undergo phenomena of partial or total regeneration independent of the donor animal[2].
Regeneration processes have been studied in different organisms, planarian and hydra among the invertebrates and amphibians and some fishes among vertebrates[5,7,8]. It is known that invertebrates have more ability to regenerate than vertebrates[9].
Regeneration can occur based on two mechanisms: morphallaxis and epimorphosis[10]. During epimorphosis, the restoration of tissues occurs at the expense of the division of undifferentiated cells (blastemal formation) in the injury zone, whereas morphollaxis implies the transdifferentiation or migration of the cells from the existing cell populations to the regeneration site with cell division playing a negligible role[3,9,11,12]. These processes rely on proliferation transdifferentiation, dedifferentiation and differentiation of coelomocytes[1,13]. Nowadays, it is thought that both mechanisms might orchestrate together in the regeneration of some animals[14,15].
In asteroid arm regeneration, no discrete blastema as a centre of cell proliferation is evident, i.e., substantial contribution of local tissues that were not injured. This appears to apply both to post-traumatic and post-autotomic regenerations[3]. Typical morphallactic processes seem to be employed and most cell cycle activity is concentrated in the epidermal layer and in the epithelium of the coelomic canals. In starfishes, it is thought that regeneration processes occurs only through morphallactic processes and it is a nerve-dependent process[3,16,17]
Regeneration relies on some similar phases for all the animals. After injury, by autotomy or predation, wound healing occurs. This injury response is common to all animals, whether or not they can regenerate[12,18]. After wound healing, if the resulting tissue stump is capable of regeneration, at least three processes can be activated, either independently or together. Animals can (1) remodel
pre-1. INTRODUCTION
existing tissues to regenerate amputated parts, (2) activate and proliferate resident stem cells and also (3) dedifferentiate or transdifferentiate cells that are close to the amputated site[7]. The cells that respond to the stimulus of amputation eventually undergo determination and differentiation, resulting in new tissues that must then functionally integrate with and scale to the size of the pre-existing tissues[7,15]. Starfishes arm regeneration is subdivided in different phases, which are the wound healing phase, the early regenerating phase and the arm growth phase[19].
The primary response to amputation events is a rapid muscular contraction. Then the subsequent healing is mediated by coelomocytes, which migrate to the injured site where they prevent bleeding by clotting and interacting with the extracellular matrix [19].
Starfishes are known for non-limited arm regeneration capability, nevertheless it is necessary a deeper study on the regeneration mechanisms and on its participants as tissues, cells, proteins and metabolites.
Circulating Coelomocytes
The body cavity of echinoderms is filled with coelomic fluid, which bathes the internal organs and forms the fluid medium in which the coelomocytes are suspended.
So far, a few studies on echinoderms coelomocytes have been performed. Therefore, several coelomocytes populations have been identified by different authors, which gave rise to different cellular classifications[3,20–22];. For example, Bossche and Jangoux (1976) state that A. rubens has only one type of coelomocytes named amoebocytes, despite they have different morphotypes[23]. Others authors pointed out the detection of three different populations of A. rubens coelomocytes by flow cytometry[24,25]. It should also be noted that not all types of coelomocytes exist in different species and even for the same specie the coelomocytes classification is not in agreement in the available literature[20,23,26–28]. This is due to morphological differences between cell types, regarding variation in the size, shape, degree of granulation, presence of pigments and cytochemical staining[29]. The variation of these parameters is also due to the properties of the different media used for cell resuspension and on the peculiarities of the different characterization methodologies such as light or electronic microscope, chosen methods of fixation attachment or cell suspension state. It is known that some morphological changes happen within the same coelomocytes type depending ig they are on suspension and on a glass, being possible to induce them with a hypotonic shock (Figure 1.1)[1,30].
Figure 1.1 Cell shape in suspension (A-B) or on glass (C-D). A. petaloid cell; B. filopodial cell. Shape change also occurs
1. INTRODUCTION
As aquatic invertebrates, their open coelom towards the environment continuously exposes them to potential pathogens. All organisms have a primary defence against infections; usually it involves a physical barrier to prevent pathogens entrance. However, sometimes pathogens can enter into the animal bodies. When this happens, cells are activated in this phase to engulf pathogens or foreign particles or to form large aggregates (clots) in case of wounds[6,17,20,31]. In fact starfish coelomocytes have a propensity for cell-cell interactions forming aggregates, which are morphological distinct in different cell culture media and due to the physiological cell state[28]. Moreover it was observed that throughout the infection process, some cells secrete antimicrobial peptides or other substances that induce pathogen death or foreign particles degradation, known as natural antibacterial activity[6,32]. The existence of such activity might explain why there is no bacteria in echinoderms coelomic fluid[32,33].
Thus, echinoderms possess an innate immune system, which shares similarities with the high deuterostomes immune system, i.e. vertebrates[1,29,33,34]. These activities require significant changes in cell shape, which are mediated by changes in the actin cytoskeleton as reported by Smith et. al [35] using sea urchin coelomocytes.
The coelomocytes are the first cellular participants in the regeneration process. After injury or autotomy of starfish body part, coelomocytes rapidly aggregate in the damaged area of the body, in order to restore the isolation of the internal medium of the organism from the environment. Increased numbers of total coelomocytes have also been noted in response to wounding and hypoxic conditions[36]. Regarding to bacterial clearance, the phagocytes in starfish A. rubens are present in a continuum of small to large cells that change relative abundance upon immune stimulation[26]. Coelomocytes also synthetize various biological active substances of protective and regulatory importance such as the heat shock protein 70 (HSP70)[37], nitric oxide, components of the phenol oxidase protective system, reactive oxygen species, homologous complementary system, lectins[1] and ubiquitin[38]. Simultaneously, coelomocytes phagocyte cell debris and microorganisms that may have entered in the internal medium of the organism through the wound[17,20].
It is known that after an animal is wounded, a part of its coelomic fluid and all of its constituents are lost; however, in 5 to 6 hours, A. rubens circulating cells of coelomic fluid reached the same number they had before it was collected or lost[11]. Since this quick restoration of fluid coelomic cannot be achieved only by mitotic division, it should be largely due to the release of coelomocytes from depot organs [11,19,20,23,27,37]. There is a list of candidates for the echinoderm hematopoietic tissue such as Tiedmann’s bodies, axial organ, strands of mesenchyme cells in the connected tissue and hemal vessel and coelomic epithelium[6,19,23,37]. After the wound is sealed, coelomocytes do not stop proliferating, which indicates that renewal of these cells might be designed to support other functions such as to fight invaders, take care of tissue debris, and/or even to have a role in the regenerative process[19].
Thus, a commonly accepted classification of the echinoderm coelomocytes – similar to the classification of vertebrate hematopoietic cells – has not been accomplished yet[22,30]. One possibility to have consensus in coelomocytes classification would be to find specific biomarkers.
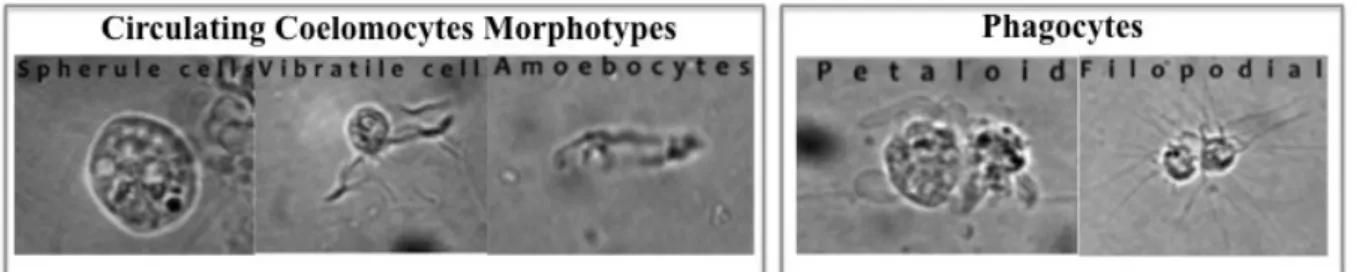
Until now, for M. glacialis were reported four types of coelomocytes: spherule cells, vibratile cells, amoebocytes and phagocytes (Figure 1.2), the latter can appear in two different morphologies (petaloid or filopodial) depending on the activate state[16].
1. INTRODUCTION
Figure 1.2 Marthastherias glacialis circulating coelomocytes morphotypes under light microscopy. Adapt [16] Coelomocytes Characterization Using Flow Cytometry
Flow cytometry is the measurement of cells fluorescence and light scattering in a flow system, which delivers the cells singly past a point of measurement. Flow cytometry can be used to count large number of cells or particles based on size, internal complexity, phenotype, cellular state, cell function, DNA content, gene expression, and to quantify these same cellular properties at a single cell level. It is possible to measure thousands of cells/particles per second, measure multiple parameters simultaneously and detect extremely rare cell populations. Some organisms are inherently fluorescents, but in general the fluorescence arises from different labels. Consequently, the heterogeneity of populations can be revealed and different subsets of cells may be identified or quantified. Selected cell populations can be also physically sorted for further study.
The major disadvantage of flow cytometry is that it requires a suspension of single cells or other particles, with minimum clumps and debris. This means that the tissue architecture and any information about the spatial relationship between different cells are lost when single cells or nuclei are prepared.
Most instruments measure light scattered by the cells at right angles to the laser beam (side scatter, SS) and light scattered in a forward direction (forward scatter, FS). The amount of light scattered is affected by cell surface constitution, shape and granularity. The magnitude of FS is roughly proportional to cell size, while SS is caused by granulosity and structural complexity inside a cell.
DNA analysis is an important application of flow cytometry. By measuring the DNA content of individual cells, it is possible to obtain information about their distribution of cells across the cell cycle and over a cellular population. To measure the DNA content, the cells have to be stained with a fluorescent dye that binds to DNA in a manner that reflects accurately the amount of DNA present. The most widely used is propidium iodide (PI).
Necrotic cells are usually defined by the lack of integrity of the plasma membrane, which can be measured by the flow cytometer, whereas apoptotic cells have an intact plasma membrane. Loss of integrity of the plasma membrane can be demonstrated either by using dyes, such as PI or DAPI, which are excluded by an intact membrane. The dead cells are PI or DAPI positives [39].
Proteomics during Regeneration
Proteins play a role in the majority of cell functions hence its identification and functional characterization is important to understand cell biological processes. Heretofore the only coelomocytes proteomics studies were performed by C.Franco et. al[34] and J.Martins[40].
So far, 358 proteins were identified in the total coelomocytes proteome, several of these shared homology with proteins from other organisms, such as belonging to Chordata. The main functional groups of identified proteins are cytoskeleton regulation, cellular adhesion, signalling cellular regulation and proliferation[16].
Other type of study performed with coelomocytes was a proteomic analysis of differentially expressed proteins in different time points of regeneration (48 hours, 13 days and 10 weeks post
1. INTRODUCTION
associated with cellular proliferation, mobility, cytoskeleton remodelling, membrane receptors and epithelial organization[40].
Model of Study: Marthasterias glacialis starfish
Asteroids occur at all depths from the intertidal to the abyssal and are present throughput all of the world’s oceans[41]. Marthasterias glacialis L. lives in a benthic habitat and it can be found in low water to a depth of 200 meters in different regions. Regarding to sex, M. glacialis L. is susceptible to present cases of hermaphroditism, it is known that 1% of population might be able to change sex during adult life, in one or all of the arms[42].
M.glacialis L. is one of the most seen starfish species in Portugal coast. Although it is not a
model organism it can be potentially used for several types of studies because its ease to maintain in captivity[16,41]. In addiction, M. glacialis L. among other starfishes has the whole-body regeneration ability including the central nervous system[16].
Aim of the study
The aim of this study is to characterize circulating coelomocytes at different levels such as DNA content (ploidy), internal complexity, cell state/viability and cell cycle, and to get a more in-depth understanding of the coelomic fluid cells dynamics during regeneration.
2. MATERIALS AND METHODS Animal Collection And Handling
Specimens of Marthasterias glacialis L. were collected at low tide in Estoril, Portugal. M.
glacialis individuals were kept in open-circuit tanks with re-circulating sea water at 15ºC and 33‰ of
salinity in ‘Vasco da Gama’ Aquarium. They were fed ad libitum with a diet of mussels (Mytilus
edulis) collected in the same site. Coelomic Fluid Collection
Coelomic fluid was collected with a 21-gauge-butterfly needle, to avoid contamination with external biological fluids, into a tube in ice. The needle was insert in the tip of the starfish arm to prevent touching internal organs while coelomic fluid was collected.
Sample Handling
Coelomic fluid samples were transported in ice from ‘Vasco da Gama’ Aquarium to the laboratory in Oeiras. To avoid coelomocytes aggregation, all samples were carefully resuspended with a micropipette with posterior filtration with 30µm mesh before staining.
Regeneration Assays
The specimens (n=12) were transported to the laboratory in Oeiras and kept there during 24 hours in a tank with re-circulating seawater at 13ºC. All specimens were relaxed with 8% MgCl2.6H2O[36,43,44], by emerging the starfishes on the solution during 15 min. Regeneration was induced cutting the five arm tips of each starfish. Control animals were not amputated and kept in the same tank as the amputated animals. Coelomic fluid was collected for all animals at 2h, 5h, 8h, 12h and 24h counted after the amputation process.
Flow Cytometry
Samples were acquired in a CyAn ADP Analyser (Beckman Coulter), a 3-laser flow cytometry analyser, with Summit™ software. Cells were sorted in FACSAria I (BD Biosciences), a 3 laser High Speed Cell Sorter with BD FACSDiva™ (BD Biosciences) software. Flow cytometers optical configuration is presented in Table 2.1. Data were analysed through FlowLogic Software (Inivai Technologies). For cell cycle analysis, the chosen algorithm was Dean Jett Fox.
Table 2.1 Flow cytometers optical configuration
FACSAria I CyAn ADP
Lasers 407 nm 488nm 633nm 405nm 488nm 642nm
Filters 450/40 616/23 660/20 450/50 613/20 665/20
Dyes DAPI PI DRAQ5 DAPI PI DRAQ5
Cell Viability Assay
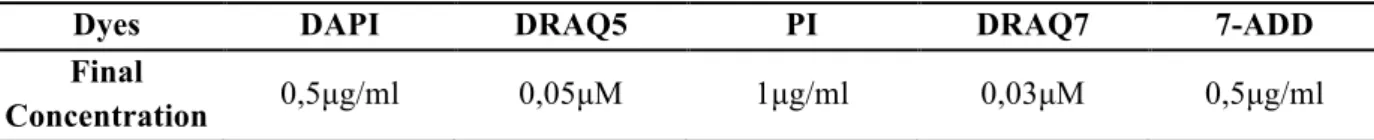
To evaluate cell viability, fresh cells were stained with DAPI and DRAQ5 and analysed through CyAn ADP Analyser. To have robustness other dyes of viability were tested: PI, DRAQ7 and 7-ADD. The respective concentrations used in the experiments are in Table 2.2.
2. MATERIALS AND METHODS
Table 2.2 Final concentration of different fluorochromes used.
Dyes DAPI DRAQ5 PI DRAQ7 7-ADD
Final
Concentration 0,5µg/ml 0,05µM 1µg/ml 0,03µM 0,5µg/ml
Cell Fixation And Cell Cycle
To study cell cycle, cell permeabilization is needed. The protocol was adapted from [45]. Cells were fixated for cell cycle study in 70% (v/v) ethanol. Coelomic fluid cells were washed once during 5 min at 4ºC and resuspended in 3.5% (w/v) Artificial Sea Water (prepared from Sea Salts, Sigma) after centrifugation at 1000 g. Cold 70%(v/v) ethanol was added dropwise to the pellet while slowing vortexing. After at least 24 hours, cells were rinsed twice in ASW at 1000 g for 5 min at 4ºC. The samples were resuspended in 85% ASW, 5% RNAse at 100 µg/ml and 10% PI at 1 mg/ml. No incubation time was necessary. Samples were kept protected from light and acquired by CyAn ADP flow cytometer equipment.
Fluorescence Microscopy
Cells were observed under microscopy to verify cell morphologies in different conditions. Images were acquired on a commercial Leica High Content Screening microscope, based on Leica DMI6000 equipped with a Flash 4.0 LT sCMOS camera (Hamamatsu), using a 100 x 1.44 NA and 20x 0.7 NA objectives, DAPI + CY5 and TRITC fluorescence filter sets and controlled with the LAS X software (Leica). Images were analysed using Fiji software v.2.0.0-rc-53/1.51f.[46,47].
Cell sorting
To perform protein extraction for individual cell population, cells were sorted into a tube with 0.5mL of cocktail of proteases inhibitors 1x per 106 cells (SigmaFast, Sigma), prepared as described in the respective technical bulletin. Before cell sorting, 6 ml of 3.5% (w/v) ASW were added to P5 collector tube to achieve a final concentration of 1:1 with PBS. After cell sorting, cells were pelleted at 1000 g during 5 min and resuspended in 20 µl of 6 M Urea and 50 mM NH4HCO3 buffer, freshly prepared and 10 µl of cocktail of proteases inhibitors 10x (SigmaFast, Sigma) were added for 106 cells Protein Extraction
To lyse cells and solubilize its proteins, 20 µl of 6 M Urea and 50 mM NH4HCO3 buffer, freshly prepared, was used. For protein assessment in different timepoints after regeneration 2 mL of CF were collected in a tube with 5 µl of a cocktail of proteases inhibitors 10x (SigmaFast, Sigma), after pelleting the cells at 1000 g, 5 min, they were lysed and then proteins was solubilized in 20 µl 6 M Urea and 50 mM NH4HCO3 buffer. Protein was quantified using QuantiPro BCA Assay Kit (Sigma) with BSA as standard.
1D-SDS PAGE
For protein separation, 12.5% (w/v) acrylamide 7 cm gels[48] were loaded with 20 µg total protein per lane. Gels were then stained overnight with colloidal Coomassie G-250 (20% (v/v) methanol, 10% (v/v) orthophosphoric acid 85%, 10% (w/v) ammonium sulphate, 0,1%(w/v) Coomassie Brilliant Blue G250) adapted from[49]. The destaining solution used was bidistilled water. Statistical analysis
To statistically analyse the cell percentage during regeneration, SPSS Statistics v.23 (IBM), was used. Descriptive Statistics were performed including mean, standard deviation and test of normality Shapiro-Wilk. Homoscedasticity was tested using Levene’s test. To compare different time
2. MATERIALS AND METHODS
points cell proportions 2-sample independent t-test (2-tailed) was used. All data are presented as mean ± St.Dev. Statistical significance was set at p<0.05. Graphs was performed using GraphPad Prism version 6.00 for Windows, (GraphPad Software, La Jolla California USA), www.graphpad.com
3. RESULTS AND DISCUSSION Coelomic Fluid Cells Characterization
Coelomic fluid fills the entire internal cavity. Marthastherias glacialis L. coelomic fluid has two distinguishable cell populations (here named P3 and P5) by flow cytometry (Figure 3.1A). P3 and P5 cell populations differ in Light Scatter; P5 cells have a higher value, meaning they have more complex surface and internal complexity than P3 cells (Figure 3.1B). Nevertheless, it is possible to have other populations that share the same Light Scatter. They constitute 50-80% of coelomocytes and sometimes some cells are osmotically compromised appearing with lower DNA dye incorporation/fluorescence level – P5low (Figure 3.1A). Regarding ploidy, P5 cells have approximately 2x more DNA than P3 cells (Figure 3.1C).
Figure 3.1 Flow cytometric analysis of circulating coelomocytes. Coelomocytes were stained with DRAQ5. A.
Representative dot plot of coelomocytes with cell populations gated. B. Overlap of dot plots was created to show representative forward and side scatter properties of P3 (red) and P5 (blue) cell populations. C. Overlap of histograms of P3 (red) and P5 (blue) cell populations was created to show cell populations ploidy.
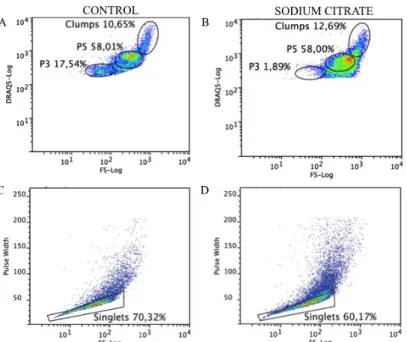
Due to their clotting functions, coelomocytes tend to aggregate in the collected coelomic fluid, which causes massive cell exclusion in flow cytometry analysis. Using anticoagulant solutions such as 1.9% sodium citrate (1:1) [21,50] and isotonic 1:1 anticoagulant buffer, denoted as ACG (0.5 M NaCl, 5 mM MgCl2, 20 mM HEPES and 1 mM EGTA pH=7.5)[51] led to an extensive loss of cells and of their integrity, mainly in P3 cell population, and to an increase in cell aggregation (Figure 3.2 and Figure 3.3).
Besides filtering the cell suspension to remove bigger aggregates, careful resuspension is required to diminished aggregation without compromising cell integrity.
3. RESULTS AND DISCUSSION
Figure 3.2 Flow cytometric analysis of circulating coelomocytes using sodium citrate as anticoagulation solution.
Coelomocytes were stained with DRAQ5. Coelomocytes were stained with DRAQ5. A, C. Dot plots representation of (A) coelomocyte populations and (C) its singlets gated without using sodium citrate. B, D. Dot plots representation of sodium citrate effect in (B) coelomocyte populations and (D) its singlets gated.
Figure 3.3 Flow cytometric analysis of circulating coelomocytes using ACG as anticoaluant solution. Coelomocytes
were stained with DRAQ5. Coelomocytes were stained with DRAQ5. A, C. Dot plots representation of (A) coelomocyte populations and (C) its singlets gated without using anticoagulant solution. B, D. Dot plots representation of ACG effect in (B) coelomocyte populations and (D) its singlets gated
In order to reduce cell lysis in samples, coelomocytes rinsed in ASW 3.5% (w/v) and cell-free coelomic fluid were tested. Hence, cell manipulation had to be optimized, including centrifugation settings. Different speeds and times of centrifugation were tested and the assessment of optimal
3. RESULTS AND DISCUSSION
centrifugation settings was done by flow cytometry. The optimal centrifugation settings to pellet cells in coelomic fluid, based on cell concentration were 1000 g during 5 min[16].
Rinsing in ASW 3.5% (w/v) did not show obvious differences regarding to cell lysis relative to coelomic fluid before centrifugation. On the other hand, cell-free coelomic fluid resuspension caused disruption of the cell membranes. Therefore, resuspension in ASW 3.5% (w/v) was performed only when rinsing was necessary. In other words, the best is to work with less manipulated samples.
Using fluorescence microscopy, different morphologies can be distinguished in cells from starfish coelomic fluid (Figure 3.4). It was possible to measure the smallest coelomic fluid P3 cells (Figure 3.4a) diameter, 4 µm, showing that they have spherical morphology (Figure 3.5A) and to confirm that these are the less abundant cells; its proportion is never upper than 20% of cells in coelomic fluid. P5 cells (Figure 3.4b), on the other hand, are the largest cells in coelomic fluid and they have different morphotypes depending on the cell osmolarity (Figure 3.5B-E). Their diameter ranges between 7 µm and 23 µm in suspension and adherent to a glass surface, respectively.
Figure 3.4 Live coelomocytes morphotypes under fluorescence microscopy. Cells were stained with DRAQ5 (red) a.P3
cell b.P5 cells. Scale bar 10 µm.
Figure 3.5 Sorted coelomocytes microscopic composite images. A. P3 cell. B. P5 cells in filopodial (up) and petaloid
(down) morphotypes. C, E. P5 cell population in petaloid morphology. D.Filopodial P5 cell. A-D Cells were stained with DRAQ5. E Cells were stained with DRAQ5 (red) and DAPI(blue). Scale bar 10 µm.
The two cell populations were sorted before microscopic observation (Figure 3.5). Different morphologies can be found in coelomocytes. When sorting cells, the majority of events in P5 gate
3. RESULTS AND DISCUSSION
(Figure 3.1) may correspond to phagocytes in two conformations (petaloid and filopodial). Whereas P3 cells gate showed under microscopy little roundish cells with only one morphotypes (Figure 3.5A). Without any specific biomarker, it is hard to tell if these different cells (Figure 3.4) are of the same type or not. Using flow cytometry only two populations are distinguishable, but without any specific biomarker, the distinction criteria is just how cell diffuses light in different directions. As mentioned above, distinct cell types could have the same light scatter. For instance, Leptasterias polaris,
Strongylocentrotus droebachiensis and Cucumaria frondosa belonging to Asteroidea, Echinoidea and
Holothuroidea classes, respectively, have a similar flow cytometric signature between them[52] and with Marthasterias glacialis (results presented here). It is known that S. droebachiensis has at least 3 different types of coelomocytes [53] despite having a similar light scatter.
So far, two biomarkers were found for A. rubens, the anti-topossome McAb and HSP70 [27]. These biomarkers only distinguish coelomocytes from other cells/particles that might be circulating in coelomic fluid such as bacteria. In this study, if this topossome is present in both cell populations, the use of these biomarkers does not improve cell populations separation, because at the end it has the same effect of DRAQ5, which is easier, cheaper and faster to use.
Cell viability
Coelomic fluid samples have several cell debris, which interfere with visualization of coelomocyte populations. At this point, it was known that DRAQ5 was an excellent dye for staining coelomocytes and separation of detected fluorescence from cells and cell debris was possible. Afterward it was necessary to find a compatible dye to evaluate cell viability, i.e., a dye that did not interfere with DRAQ5 detected fluorescence or compete for the same DNA binding site as DRAQ5.
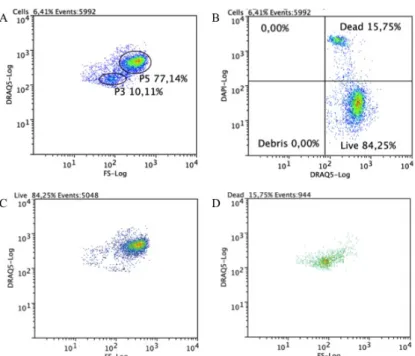
Using exclusion dyes it is possible to assess cell viability[54], DAPI was tested and showed that only P3 cell population could incorporate it while P5 cell population had few DAPI+ cells, thus all P3 cells have a lower viability, whereas the majority of P5 cells are viable . To test if cellular permeability to DAPI is only due to a loss of viability and not because it can enter by other means, such as ion channels [55], other exclusion dyes PI, DRAQ7 and 7-AAD, were tested. All of these have shown the same result, except 7-AAD, which had no fluorescence detected relative to other. Hence, no further studies were made to understand this result. Since PI and DRAQ7 have the same binding site as DRAQ5 and a close emission wavelength and DAPI has an excitation and emission spectrumfar from DRAQ5, we decided to use DAPI and DRAQ5 together to distinguish simultaneously cells from debris and viable from non-viable cells.
Although P3 viability does not change once outside the organism, P5 viability decreases during the assay day (Figure 3.6). Having the same consistent result with such different dyes, excludes the hypothesis of dye entrance by specific channels[55]. To understand better the cell viability of P3 cell population, more characterization and functional assays have to be done.
3. RESULTS AND DISCUSSION
Figure 3.6 Flow cytometric analysis of circulating coelomocytes viability. Cells were stained with DRAQ5 and DAPI. A.
Representative dot plot with P3 and P5 cell populations gated. B. A quadrant plot of coelomocytes showing DAPI+ (dead)
and DRAQ5+ DAPI- (live) coelomocytes. C. A dot plot showing that in live cells quadrant, these belong mainly to P5 cell population. D. A dot plot showing that in dead cells quadrant they belong mainly to P3 cell population.
Cell cycle
To study the cell cycle, cells were handle following the cell fixation protocol. To perform this protocol some optimization was done, such as defining centrifugation settings, PI dye concentration and final volume of 70% ethanol, using 1mL per 5mL of CF. As mentioned before, to measure the DNA content, the cells have to be stained with a fluorescent dye that binds to DNA in a manner that reflects accurately the amount of DNA present. G0/G1 phase cells have half of the DNA content than M/G2[39], thus the fluorescence level will follow this principle if the dye concentration is saturated. Samples were acquired in linear mode, in order to see 2-times differences in DNA content, measured by PI fluorescence. P5 cells are predominant in the first phases of cell cycle – G0G1 (Figure 3.7A). P3 cells did not show more than one cell cycle phase, which is in agreement with cell viability assays here presented. (Figure 3.7B). P3 cells can be in a quiescent state (known as G0 phase) or even have a terminally differentiation. In conclusion, P5 cells seemed to have a regular cell cycle, showing both phases. Whereas P3 cells are not in division, further studies will be needed to explain it.
3. RESULTS AND DISCUSSION
Figure 3.7 Flow cytometric analysis of cell cycle. Cells were fixed with 70% ethanol and stained with PI A. Representative
histogram of P5 singlets cell cycle showing different phases: sub- G0/G1 (blue) G0/G1 (red), S (yellow) and G2M (green). B.
Representative histogram of P3 cell population. PI fluorescence is proportional to DNA content.
Male gametes
In some samples, a new cell population appeared in flow cytometry plots, first called as P2, having lower Light Scatter than P3 cells population (Figure 3.8A). This new cell population has a small cytoplasmic head with a long flagellum (Figure 3.8B). Comparing with flow cytometric signatures in other organisms, this cell population shared similarities with S. droebachiensis vibratile cells [52]. In order to test if these cells were gametes, a male gonad was placed in a tube with 3.5% (w/v) ASW during 1h and its analysis revealed similarities to P2 cells both in flow cytometry and fluorescence microscopy. So the emergence of this P2 population in some samples was likely to be the result of gonad perforation when collecting coelomic fluid with a needle. It should be noted that gonads change its size depending on the time of year/reproduction cycle [56].
When the study goal involves coelomocytes proportion, it could be a problem to have male gametes in the sample, because its appearance leads to an under-represented proportion, although its cell number is the same.
Figure 3.8 Male gametes. A. Flow cytometric analysis of male gametes. Cells were stained with DRAQ5. B. Microscopic
image of male gametes. Arrow indicates gametes flagella. Scale bar 10µm
Regeneration
The regeneration assay was performed during the first day after arm tip ablation because it was described that coelomocytes could be more involved in the first phase of regeneration – wound healing [19,57–59].
When collecting coelomocytes, during the first 24h after arm tip ablation; starfishes, between them and in both experiments, had a different behaviour, in terms of cell clotting in tube during
←
3. RESULTS AND DISCUSSION
coelomic fluid collection and body stiffness. These differences might be related with environmental sensing between different individuals and days.
Coelomocytes proportion in starfishes coelomic fluid was determined through flow cytometry. Cells proportions refers to the number of each coelomocyte population (P3 or P5) events divided by the number of total cells (P3 and P5) events.
Data for the two populations were analysed individually for the several time points. Normality was tested as well as homoscedasticity. It was found that the experimental data have a normal distribution and equal variances.
Two experiments were performed in two different days, controls were compared between the two days, and no statistical differences were observed (Table 3.1and Table 3.2).
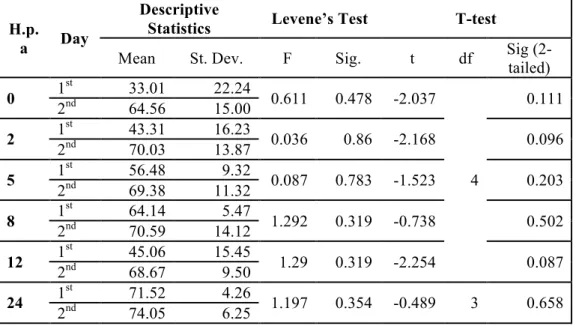
Table 3.1 Statistical analysis of P5 cell percentage between control starfishes in different days
H.p.
a Day
Descriptive
Statistics Levene’s Test T-test
Mean St. Dev. F Sig. t df Sig (2-tailed)
0 1 st 33.01 22.24 0.611 0.478 -2.037 4 0.111 2nd 64.56 15.00 2 1 st 43.31 16.23 0.036 0.86 -2.168 0.096 2nd 70.03 13.87 5 1 st 56.48 9.32 0.087 0.783 -1.523 0.203 2nd 69.38 11.32 8 1 st 64.14 5.47 1.292 0.319 -0.738 0.502 2nd 70.59 14.12 12 1 st 45.06 15.45 1.29 0.319 -2.254 0.087 2nd 68.67 9.50 24 1 st 71.52 4.26 1.197 0.354 -0.489 3 0.658 2nd 74.05 6.25
Table 3.2 Statistical analysis of P3 cell percentage between control starfishes in different days
H.p.a Day
Descriptive
Statistics Levene’s Test T-test
Mean St. Dev. F Sig. t df Sig
(2-tailed) 0 1st 6.17 3.75 6.065 0.069 -0.83 4 0.453 2nd 11.90 11.35 2 1st 3.52 2.56 2.025 0.228 -1.773 0.151 2nd 12.28 8.17 5 1st 2.06 2.02 7.293 0.054 -1.269 0.273 2nd 8.31 8.28 8 1st 1.87 1.73 5.468 0.08 -1.825 0.142 2nd 10.36 7.87 12 1st 4.53 0.40 6.442 0.085 -0.995 3 0.393 2nd 9.67 6.93 24 1st 2.59 0.07 6.983 0.077 0.555 0.618 2nd 2.19 0.98
3. RESULTS AND DISCUSSION
In order to overcome for eventual fluctuations in the experimental conditions of the 2 days, cell percentages were analysed as relative to controls from the same day.
This study revealed that starfishes had statistically significant higher P5 relative percentages before amputation (1.31±0.51) compared to other time points (0.63±0.40; t(30)=-3.522; p=0.001). Percentage of P5 cells diminished after amputation, and during the first 24 hours does not reach again these values, as expected [59].
Analysing time point per time point, differences in proportions of P5 cells were found after 2h.p.a. (0.66±0.38; t(10)=2.477, p=0.033), 8h p.a. (0.56±0.47; t(9)=32.575, p=0.03) and 24h.p.a. (0.50±0.35; t(9)=3.003, p=0.015) compared with the cell proportions before amputation (1.31±0.51) (Figure 3.9, Table 3.3 and Table 3.4).
Table 3.3 Descriptive Statistics of P5 cell population relative percentage in different time points
H.p.a. Mean St.Dev
0 1.31 0.51 2 0.66 0.38 5 0.76 0.45 8 0.56 0.45 12 0.69 0.49 24 0.50 0.35
Figure 3.9 Graphical representation of P5 cell population dynamics during the first 24h of regeneration. Dot scatter
plot of P5 cell proportion in different time points. Mean (dotted lines). Error bars (±St.Dev). is also represented . * Statistical significance (p-value<0.05).
3. RESULTS AND DISCUSSION
Table 3.4 Statistical Tests Analysis of P5 cell population during regeneration. Shadowed cells have p-value<0.05 Time Post
Amputation (h)
Statistical
Test Parameters
Time Post Amputation (h)
2 5 8 12 24 0 Levene’s Test F 0.575 0.104 0,124 0,036 0,937 Sig 0.466 0,754 0,732 0,854 0,358 T-Test T 2.477 1,867 2,575 2,024 3,003 df 10 9 9 9 9 Sig (2-tailed) 0.033 0.095 0.03 0.074 0.015 2 Levene’s Test F - 0.179 0.157 0.26 0.092 Sig - 0.682 0.701 0.622 0.769 T-Test T - -0.38 0.432 -0.117 0.742 df - 9 9 9 9 Sig (2-tailed) - 0.713 0.676 0.909 0.477 5 Levene’s Test F - - 0.01 0.013 0.466 Sig - - 0.978 0.911 0.514 T-Test T - - 0.716 0.218 1.021 df - - 8 8 8 Sig (2-tailed) - - 0.495 0.833 0.337 8 Levene’s Test F - - - 0.02 0.438 Sig - - - 0.891 0.527 T-Test T - - - -0.468 0.227 df - - - 8 8 Sig (2-tailed) - - - 0.652 0.826 12 Levene’s Test F - - - - 0.529 Sig - - - - 0.488 T-Test T - - - - 0.73 df - - - - 8 Sig (2-tailed) - - - - 0.486
There was no statistical difference between other time points (Table 3.4) or in P3 cell population (Figure 3.10, Table 3.5 and Table 3.6).
Table 3.5 Descriptive Statistics of P3 cell population relative percentage in different time points
H.p.a. Mean St.Dev
0
0.64
0.58
21.16
0.43
51.43
1.24
80.75
0.58
121.04
0.65
243.03
3.35
3. RESULTS AND DISCUSSION
Figure 3.10 Graphical representation of P3 cell population dynamics during the first 24h of regeneration. Dot scatter
plot of P3 cell proportion in different time points. Mean (dotted lines). Error bars (±St.Dev). is also represented .
Table 3.6 Statistical Tests Analysis of P3 cell population during regeneration Time Post
Amputation (h)
Statistical
Test Parameters
Time Post Amputation (h)
2 5 8 12 24 0 Levene’s Test F 0.534 0.89 0 0.009 4.715 Sig 0.482 0.37 0.993 0.925 0.058 T-Test T -1.76 -1.393 -0.313 -1.072 -1.733 df 10 9 9 9 9 Sig (2-tailed) 0.109 0.197 0.761 0.312 0.117 2 Levene’s Test F - 1.709 0.519 0.225 5.407 Sig - 0.224 0.489 0.647 0.045 T-Test T - -0.504 1.347 0.38 -1.24 df - 9 9 9 4.107 Sig (2-tailed) - 0.626 0.211 0.713 0.281 5 Levene’s Test F - - 0.764 0.766 2.227 Sig - - 0.407 0.407 0.174 T-Test T - - 1.107 0.629 -1.001 df - - 8 8 8 Sig (2-tailed) - - 0.301 0.547 0.346 8 Levene’s Test F - - - 0.007 3.88 Sig - - - 0.934 0.084 T-Test T - - - -0.738 -1.498 df - - - 8 8 Sig (2-tailed) - - - 0.482 0.172 12 Levene’s Test F - - - - 3.882 Sig - - - - 0.084 T-Test T - - - - -1.306 df - - - - 8
3. RESULTS AND DISCUSSION
According to this study, it seems that P5 cells are influenced by regeneration in the wound healing phase[19,57], whereas P3 cell population dynamics is independent of regeneration process. P5 cell proportions decreased after amputation. This was reported as being a result of coelomic fluid losses [11]. This is enlarged with effects of induced relaxation because starfish is not able to contract its arm tip in order to close its wounds. As mentioned before, cells first response to an injury is clotting formation to maintain internal conditions as rapidly as possible[58]. Thus decreased cell proportions could be due to an increase of cell concentration near the arm tip preventing its circulation in CF. Its number is replenished by the phase of wound healing[19]. Coelomocytes restoration could be due to cell recruitment from specific niches in epithelial tissue or other areas[19,20,27] or just cell proliferation to compensate cell loss[19,27];
In this regeneration study, P2 cells, also called male gametes, appeared only in animals in which regeneration was induced (4 out of 6). However, one of the starfish had these cells in coelomic fluid before amputation. Albeit the average number of male gametes increases during the first hour of regeneration; the differences between hours are not statistically significant (p>0.05) (Figure 3.11).
Figure 3.11 Graphical representation of male gametes dynamics during the first 24h of regeneration. Dot scatter plot of
male gametes percentage in different time points. Mean (dotted lines). Error bars (±St.Dev). is also represented .
Male gametes in distinct organisms behave in different manners regarding time points of appearance and cell concentration during monitoring. After 24 h.p.a. all the 4 starfishes have male gametes present in the coelomic fluid samples (Table 3.7).
Table 3.7 Percentages of male gametes in 4 starfishes during regeneration. Mean and standard deviation are also
included.
Hours Post Amputation
Starfish 0 2 5 8 12 24 1 0 51.38 80.72 79.62 80.05 85.33 2 0 0 30.77 0 0 12.31 3 34.67 10.88 0 23.47 68.40 58.30 4 0 0 0 52.08 20.47 26.41 Mean 8.67 15.57 27.87 38.79 42.23 45.59 St.Dev. 17.34 24.42 38.10 34.56 38.18 32.74
Once again, the appearance of these cells is only in these 4 animals. That could be the result of arm tip cuts, which might have perforated male gonads; hence male gametes are released into the
3. RESULTS AND DISCUSSION
coelomic fluid. Due to not fairly controlled conditions, animals could have been under stress, thus sperm spawning was as a last chance to ensure progeny. Although there is nothing reported in the literature about male gametes in coelomic fluid. Further studies will be needed in order to understand better this cell dynamics.
Coelomocytes Protein Extraction
To perform a complete study of individual coelomocyte population proteome, optimizations steps in protein extraction were done.
During cell sorting, cells sheathed in PBS are collected into a tube at high velocities. If cell lysis is not extensive after tube centrifugation cells will form a pellet. To verify if cell lysis occurs when cells are being sorted or centrifuged, both fractions (pellet and supernatant) were tested for total protein profile. SDS-PAGE protein separation of both fractions showed inconclusive results, because protein bands appeared in the cell pellet in some days and in others in the supernatant fraction. According to these results, protein precipitation of the cell suspension, with 20% trichloroacetic acid and 0,14% 2-mercaptoethanol was also tested but it did not precipitate proteins efficiently.
It was hypothesized that the presence of PBS in the cellular suspension could compromise cell homeostasis due to differences between PBS and CF salinities. PBS has less than half of conductivity (22.75±1.77mS/cm) than CF (62.11±3.30mS/cm; t (6)=15.59; p=0). And so forth, adding 3.5% (w/v) ASW in a final volume of 1:1 to diminish osmotic shock seemed to be a good alternative to keep P5 cells integrity because its protein bands intensity remained similar between days. Although, this approach had no result in P3 cells. Additionally, it was confirmed for individual coelomocytes population P3, that cell sorting did not show reproducibility between days. When the purity of the sorted cells was determined by flow cytometry, it was seen that stained P3 cells lose dye fluorescence being detected as cell debris. This could be due to cell death after the mechanical process of cell sorting. 1D-SDS PAGE did not show any bands for this population.
Further studies have to be done in order to understand which will be the best method to handle sorted cells.
In conclusion, concerning total coelomoytes fraction protein assessment, it showed a reproducible electrophoretic profile in different starfishes. Although, P5 proteins bands at lower mass showed consistently a very faint pattern (Figure 3.12), for which no explanation was found
4. CONCLUSIONS
The present study constitutes the first guidance for M. glacialis L. coelomocytes handling for flow cytometry assays, once it includes several protocol optimizations.
The outcome of this work suggest that M. glacialis L. coelomic fluid has two different coelomocyte populations, here named P3 and P5, which have different sizes and abundances between them. After cellular studies, P3 and P5 differ in morphology, ploidy, cell viability and also in cell cycle.
Morphologically, the most abundant cell population, P5, have the appearance of the already described echinoderms phagocytes, having also the two morphotypes (filopodial and petaloid). They start losing its viability during the first day out of the organism. While P3 are the smallest cells present in coelomic fluid, they are able to incorporate exclusion dyes, right after its collection from the organism, meaning that they are not viable ex vivo.
Regeneration led to a decrease trend in P5 cell percentage. This reduction tendency could just be related with coelomic fluid loss at injury sites and/or with coelomocytes recruitment to wound closure. While P3 cell population showed an independent behaviour with no correlation with regeneration, its proportions vary randomly during the first day of regeneration.
Male gametes increased its mean proportion in the course of regeneration monitoring, for all assayed starfishes. This cellular proportion rise could be due to gonad perforation or due to a biological process that needs further studies to be understood.