DESIGNING EUCALYPTUS GLOBULUS LABILL.
SEEDLINGS MORPHOLOGY USING NITROGEN
FERTILIZATION DURING NURSERY
PRODUCTION
António Henrique Costa Gomes Soares Correia
Dissertação para obtenção do Grau de Mestre em
Engenharia Florestal e dos Recursos Naturais
Orientador: Professora Maria Helena Almeida
Co-orientador: Professor Henrique Ribeiro
Júri:
Presidente:Doutor João Manuel Dias dos Santos Pereira, Professor
Catedrático do Instituto Superior de Agronomia da Universidade Técnica de Lisboa
Vogais:Doutora Maria Helena Reis de Noronha Ribeiro de Almeida, Professora Associada do Instituto Superior de Agronomia da Universidade Técnica de Lisboa
Doutora Maria Teresa Portes
Doutor Filipe Miguel de Carvalho Costa e Silva
ACKNOWLAGEMENTS
This work was performed as part of the DEFOR project, financed by INTERREG IIIB SUDOE to which the author wishes to thank.
The author would like to thank all colleagues and friends that helped one way or another, during the realization of this work, specially to Carla, Ana, and Sofia for their support in every aspect of this work. To Professor Henrique Ribeiro for helping in the hands-on tasks, and guidance. To Professor Maria Helena Almeida, for guidance, support, and being there for all times. To my parents, that never gave up on me. To Patrícia, for the unconditional support and constant presence. To the birds.
ABSTRACT
Tasmanian blue gum (Eucalyptus globulus Labill) is the third most important specie in the Portuguese forest cover, highly relevant in the forestry industry, and raw material used for pulp and paper production (CELPA, 2009). Growth of this short rotation species in the field is dependent on the initial growth in the nursery. In this experiment, seedlings of Eucalyptus globulus Labill were grown with four levels of Nitrogen (N) fertilization, under growth conditions similar to those used in nursery commercial production, with the objectives of (1) modelling growth (planting stock size and production period), taking into account the legal regulation limits imposed by law (Decreto-Lei) and (2) to develop indicators of seedlings quality to estimate their performance in the field. Results showed high correlation between fine roots growth and field performance. The correlation between chlorophyll content and N seedling content observed allows to optimize seedling production, through the assessment of N needs of seedlings. N nutrition reveals high impact on root growth potential. 40 mg of total supplied N (N40 nutrition level) produces good quality seedlings, applied since 2 month seedlings.
KEY-WORDS: Plant production, Eucalyptus globulus, fertilization, quality
RESUMO
A Eucalyptus globulus Lab. Situa-se como a terceira espécie mais importante ao nível da área florestal Nacional, de extrema importância na indústria florestal, utilizada como material base na produção de pasta de papel (CELPA, 2009). Neste trabalho produziram-se plantas de Eucaliptus globulus, utilizando quatro níveis de fertilização, em condições semelhantes às utilizadas em viveiros comerciais com o objectivo de (1) modelar o crescimento (dimensões das plantas e periodo de produção), tendo em conta os limites legais morfológicos impostos por decreto lei (Decreto-Lei) e (2) desenvolver indicadores de qualidade das plantas de forma a estimar a sua performance no campo. Os resultados demonstram que existiu correlação entre crescimento de raízes finas e a performance no campo. A correlação observada entre conteúdo de clorofila e o conteúdo em azoto das plantas permite optimizar a produção, pela avaliação das necessidades em azoto que as plantas apresentem. A fertilização azotada revelou um grande impacto no crescimento potencial das raízes. O fornecimento de 40 mg de N (nível de fertilização N40) produz plantas com maior capacidade de sobrevivênvia e performance, aplicado a partir dos 2 meses de produção.
PALAVRAS-CHAVE: Produção de plantas, Eucalyptus globulus, fertilização,
RESUMO ALARGADO
A Eucalyptus globulus Lab. Situa-se como a terceira espécie mais importante ao nível da área florestal Nacional, de extrema importância na indústria florestal, utilizada como material base na produção de pasta para papel (CELPA, 2009). Esta espécie tem sido alvo de programas de melhoramento genético, com o intuito de aumentar a sua produtividade. Porém, muitos viveiros estão a utilizar novas tecnologias na produção do material vegetal para florestação, para produzir plantas de qualidade, que tenham um desempenho melhorado e contribuam para um aumento da produtividade. Na produção desta espécie é utilizada a fertilização em viveiro, para acelerar o desenvolvimento das plantas, de forma a fornecer material para as épocas de plantio, que estejam dentro dos limites legais morfológicos para a comercialização das plantas da espécie.
Neste ensaio, foram testados quatro niveis de fertilização de azoto, com o objectivo de possibilitar a modelação das dimensões das plantas e tempo de produção, obtendo no fim da produção, plantas dentro dos limites legais, e com boa performance no campo. Outro objectivo foi a obtenção de alguns indicadores de fácil medição, que possibilitem a avaliação imediata do estado fisiológico das plantas, e da sua qualidade e futuro desempenho. Segundo os resultados obtidos, o nivel de fertilização testado N40 mostrou-se o mais indicado para produção de plantas com dimensões correctas e bom desempenho, embora seja necessário conjugar com um nível de fertilização mais baixo, para as fases de crescimento em que a planta não consegue utilizar eficientemente o azoto fornecido. Assim, idealmente teremos um esquema faseado com dois níveis de fertilização, o que nos permite reduzir o tempo de produção para 4 meses, evitando fertilização excessiva e desperdício de recursos. Como indicadores de qualidade da planta, salienta-se o potencial de crescimento radicular, em particular a porção radicular de menor diâmetro (<=0.5mm), que mostrou correlação positiva com o desempenho no campo, tanto no crescimento como na sobrevivência. Um método expedito para avaliar o estado nutricional da planta é a medição do conteúdo de clorofila das folhas, que está directamente relacionado com a quantidade de azoto presente na planta. É de referir a importância do azoto absorvido pela planta, enquanto consumo de luxo, para dispôr de reservas suplementares aquando da instalação no campo. Isto origina um
desenvolvimento mais rápido do sistema radicular e aumenta a capacidade produtiva da planta. Torna-se ainda importante salientar a eficiência quântica do fotossistema II como indicador de performance do sistema fotossintético e do potencial de crescimento.
Os modelos ajustados pelo método Restricted Maximum Likelihood permitem realizar previsão de tempo de produção e fertilização utilizada, para obtenção de plantas com as características pretendidas.
A fertilização azotada revelou um grande impacto no crescimento potencial das raízes. O fornecimento de 40 mg de N (nível de fertilização N40) produz plantas de qualidade, aplicado a partir dos 2 meses de produção.
PALAVRAS-CHAVE: Produção de plantas, Eucalyptus globulus, fertilização,
INDEX
1 INTRODUCTION...1
2 MATERIAL AND METHODS...4
2.1Plant production...4
2.2Fertilization...5
2.3Sampling to monitor seedlings status...5
2.4Seedling measurement...6
2.5RGP – Root Growth Potential...6
2.6Field trials...7
2.7Statistical analysis and Modelling ...7
3 RESULTS...9
3.1Nursery...9
3.2Field trial...17
3.3Modelling seedling growth...19
4 DISCUSSION...23
5 CONCLUSION...27
6 REFERENCES...28
INDEX OF FIGURES
Scheme for container level experimental design. Distribution of treatment levels in the 120
cm³ production container...4
Climagraph presenting climatological precipitation and temperature means(1970-2000) for
field trial site 1(Santarém) and field trial site 2 (Viseu)...7
Biomass evolution from emergency to plantation in the field. Each point represents mean
seedling weight. Vertical bars represent standard error. n=40...9
Seedlings Shoot/Root ratio (g/g) from emergency to plantation in the field. n=40...9
Seedlings biomass partitioning presenting leaf, stem and root dry weight (g), since seedling
emergency to plantation in the field...10
Seedling stem diameter and height, with standard error. Dashed lines indicate areas outside
commercialization allowed dimensions for E.globulus. Error bars represent standard error.
n=40...10
Seedling root surface area (cm²) per diameter class, at 2 months. Diameters class increment in
0.5 mm. Error bars represent standard error. n=40...11
Root surface area per diameter class, at 5.5 months. Diameters class increment in 0.5 mm.
Error bars represent standard error. n=40...12
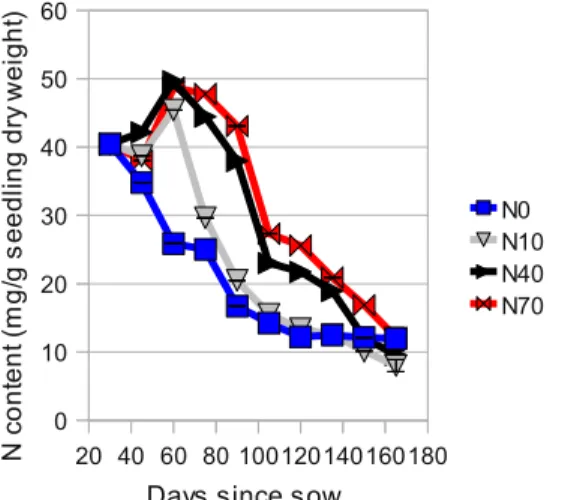
N content (mg per g of seedling dry weight)...13
Total N (mg) per seedling. Each point represents the average of sampled seedlings. Vertical
bars represent standard error. n=40...13
Seedling N uptake efficiency in percentage of supplied N...14
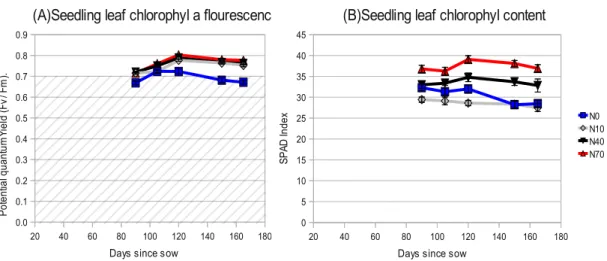
(A) Seedling leaf quantum yield assessed through chlorophyll a fluorescence. (B) Seedling
leaf chlorophyll content in SPAD index readings. Vertical bars represent standard error. n=16
...14
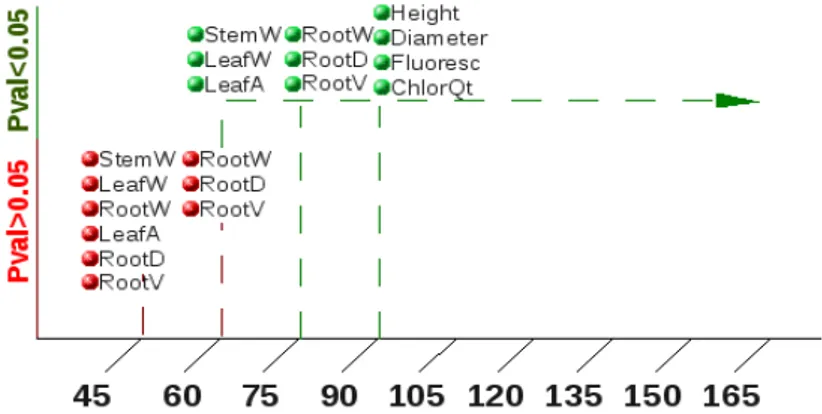
Treatment effect significance in measured variables through time. In green, significant
differences; in red, non-significant (W-weight, A-area, D-diameter, V-volume,
Flouresc-Quantum efficiency, ChlorQt-Chlorophyll content)...15
Root growth surface area during RGP test. Vertical bars represent standard error. Diameter
class increment in 0.5 mm. n=12...16
Plant survival percentage in field trial site 1 (Santarém) and site 2 (Viseu). Significant
differences between treatment means are marked in site 2 with a and b (Tukey test). Vertical
bars represent standard error. n=40...17
Plant field height in field trial site1 (Santarém) and site 2 (Vise). a,b and c indicates significant
differences among treatment mean (Tukey test). Vertical bars represent standard error. n=40 18
Estimated height and diameter using different N nutrition levels. Legend in the right stands for
total N supplied during production time...22
INDEX OF TABLES
Nutrient application per treatment in N mg per seedling...5
Pearson Correlation test to RGP and Field variables. Numbers between ( ) represent p-values.
“n.s.”-Non significant...19
Variables considered in linear mixed models...20
Linear mixed model fixed effects parameters for the dependent variable diameter...20
Linear mixed model fixed effects parameters for the dependent variable height...21
Linear models equations and indexes: Akaike, Baesyan and LogLikelyhood ...21
Introduction
1 INTRODUCTION
Tasmanian blue gum (Eucalyptus globulus Labill.) accounts for 646,7x10³ ha
(21%) of the Portuguese forest area, estimated in 41,3x10⁶ m3 standing wood
(DGRF 2006). It's the third most important species in the Portuguese forest cover, highly relevant in the forestry industry, and raw material used for pulp and paper production (CELPA, 2009). About 12 million seedlings are produced per year for reforestation purpose (DGRF 2006).
Plantation contributes largely to forest production costs, and plant quality (genetic control and physiological status) has a big impact on the final production revenue.
Pulp companies in Portugal started breeding programs more than 40 years ago, indeed genetic gain of 25 to 50% has been achieved (Borralho, 2007). Simultaneously, to use in afforestation the improved stock material, work has been developed in E. globulus propagation issue.
Seedlings production methodology contributes significantly to the success of new plantations.
High competition among commercial nurseries promote the development of new technologies, to produce high quality seedlings, in short time and with less costs. The production of high quality seeds and plants at a low cost is a main objective of plant producers.
Seedling quality is a concept used in plant production, which has received considerable attention worldwide. According to Richie (1984) “quality is fitness for purpose”. Considering that the aim of planting stock is
to create a
successful plantation, then fitness is a function of survival and growth potential. Forest nurseryman are aware that seedlings intended for afforestation do not receive after plantation the same care as ornamental and fruit trees. Indeed forest seedlings have to survive without irrigation or fertilizer. As a result, low quality plants, in the field, will exhibit morphological and physiological characteristics that constrains their performance under non-optimal conditions (Villar-Salvador, 2004). Many studies have shown that field survival and productivity are related to the traits of the seedlings stock used (Ritchey, 1984). Seedling quality depends ultimately on the speed at which seedlings get anchored in the ground, and startIntroduction
assimilating and growing after planting out. Hence: i. the ability to produce new roots quickly; ii. the development of sun-adapted foliage; iii. a balanced shoot:root ratio;
iv. good carbohydrate reserves;
v. a balanced concentration of minerals, are fundamental requisites for high quality seedlings (Ritchey, 1984).
Beside producing well balanced plant, it is imperative to develop index easily measurable in a nursery, to assess seedling status.
The ability to produce new roots quickly is extremely important for field survival, it can be tested by assessing root growth potential (RGP), i.e., the root growth under optimal conditions of water and light (Ritchey, 1984).
The concept of seedling quality appears in law, trying to define traits for seedlings at time of sale. However, some studies show these defined characteristics (height, diameter, age) do not always correspond to a good field performance.
In the European Union (EU), E. globulus reproductive material commercialized for forestry purposes is controlled by the EU Directive 1999/105/CE, and is transposed to Portuguese Law by the Law on production of reproductive forest material (Decreto-Lei-205/2003), and states that Eucalyptus seedlings at time of sale can not be older than 12 months neither younger than 3. The height of stem must be between 10 and 40 cm, and the diameter never inferior to 2 mm. Nurseries have a short time window to produce seedlings which are within law limits, and still will show good field performance.
As a fast growing and extremely productive specie, eucalyptus has a high nutrient absorption capability, and can efficiently use available nutrients during early stage growth. Like other vegetable species, this one can be considered opportunist, not only the seedlings absorb nutrients required to immediate growth, but if present, excess nutrient is absorbed and stored, being named as luxury consumption (Ericsson 1994). Nitrogen, potassium and phosphorus deficiency can create constrains to the growth of leaves, stem, branches, and root . Moreover, the unbalanced nutrient concentration can affect chlorophyll
Introduction
content, and number, size and structure of chloroplasts (Kaul 1970).
Among nutrients, Nitrogen (N) is extremely important, it is responsible for the synthesis of proteins, nucleic acids, and chlorophyll. About 75% of total leaf N is associated with photosynthetic mechanism (Evans, 1989). For this reason, under optimal conditions of light and water, the photosynthetic rate increases as N leaf content rises, until an optimal N concentration is achieved. Above this threshold, leaf N concentrations does not result in the increase of photosynthetic rate (Caldeira, 1991). Excessive N fertilization can also produce unbalanced increase in leaf/root ratio, originating plants more sensitive to stress like drought, and hence results in poor seedling performance.
Leaf chlorophyll content also tends to increases with N supply and is low when N is limiting (Demotes-Mainard 2008). As chlorophyll can easily be measured by direct relation of SPAD (Soil Plant Analysis Development) readings, non-destructive determination of chlorophyll could be applied as an estimator for N leaf content.
Nurseries producing Eucalyptus seedlings need to use fertilizer to obtain plants within the legal parameters, and accelerate growth in order to produce plants within plantation periods. The main environmental factors that can not be controlled in a forest plantation are temperature and water stress. In order to avoid summer drought and cold, plantation is generally done in two periods: usually around March to May in Spring,and from September to November during Autumn.
Nowadays, seedlings production of 5 months is required for plants to be presented as quality material. Reducing this production period will result in an economic advantage for plant producers and forest managers.
Objectives
In this experiment, seedlings of Eucalyptus globulus (Labill.) were grown with four different N fertilization levels, under conditions similar to those usually applied in commercial nursery. The objectives were: (1) modelling growth (planting stock size and production period), taking into account the legal regulation limits imposed by law and (2) to develop indicators of seedlings quality to estimate their performance in the field.
Material and Methods
2 MATERIAL AND METHODS
2.1 Plant production
Sowing of Eucalyptus globulus seeds was done in 26th November 2008, in 120
cm3 containers, using a potting mixture of peat and expanded polystyrene (2:1)
as substrate. Seeds were obtained from a seed lot of improved forest reproductive material, from CELBI seed orchard.
Four different levels of the treatment were established, each corresponding to a different level of nitrogen fertilization: no N supplied (N0),10 mg (N10),40 mg (N40),and 70 mg (N70). Ten replicates per each treatment (Figure 1) in an experimental design with 4 complete randomized blocks (36 containers per block)
From November to February seedlings were produced in a greenhouse with controlled temperature and light.
At the end of February (age of 3 months), plants were transferred from the greenhouse to the open shaded area to allow hardening. At that time, sanitary precautions against fungal infection were taken. Plants were sprayed with as antifungical solution against Botrytis sp fungus.
Figure 1:Scheme for container level
experimental design. Distribution of treatment
levels in the 120 cm³ production container
Watering was done regularly, by a sprinkler system, in the greenhouse, and in the open protected area.
Material and Methods
2.2 Fertilization
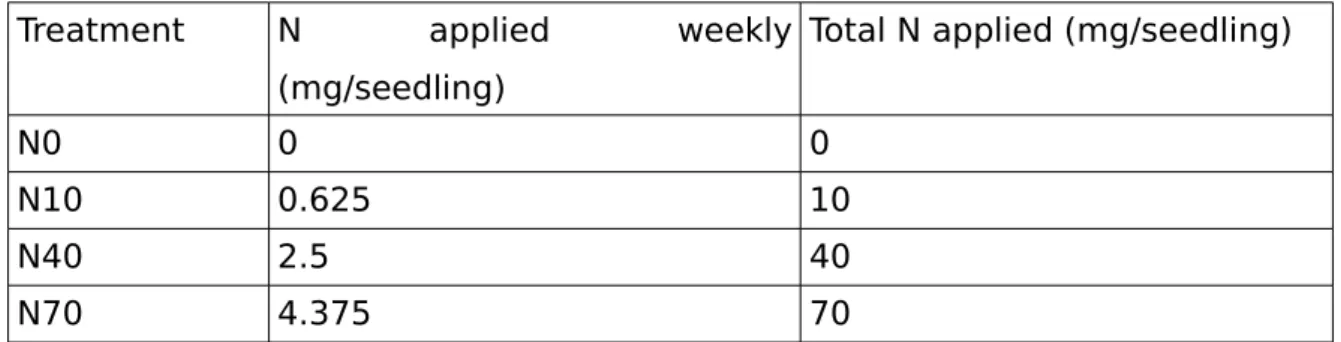
Four N treatment levels were applied, N0 (watered with no addition of fertilizer), N10, N40 and N70. In Table 1, we can observe the nitrogen applied per treatment:
Table 1: Nutrient application per treatment in N mg per seedling
Treatment N applied weekly
(mg/seedling)
Total N applied (mg/seedling)
N0 0 0
N10 0.625 10
N40 2.5 40
N70 4.375 70
First fertilization occurred one month after sowing. N was applied weekly, in a total of 16 applications. Total N given to plants during the experiment is shown in the right column of table 1. The fertilization was applied through different water solution for each N level, in a quantity of 10 ml to each seedling individually. Before each fertilization, seedlings were watered to field capacity, leaching previous nutrients still present in the containers, in order to allow determination of abortion capacity for weekly supplied N.
To avoid other nutrient limitations along the experiment, different ratios of nutrients were applied, adjusted according to seedling needs at that specific time:
-From 1st to 3rd fertilization: 12:45:10 (NPK) + micronutrients;
-From 4th to 11th fertilization: 10:8:10(NPK)+2,0 (Ca)+1,2 (Mg) + micronutrients; -From 12th to 16th fertilization: 5:8:15(NPK)+2,0 (Ca)+1,2 Mg+ micronutrients.
2.3 Sampling to monitor seedlings status
Sampling unit was at container level, so containers were randomly picked, from each block.
Sampling was done fortnightly, initially after the first fertilization, and then after each 2 fertilization treatments. For each container sampled, all seedlings were processed. Seedlings were dried for 2 days at 70 C, and then leaves, stem and⁰ roots were individually weighted. Roots were separated from pot mix using
Material and Methods
pressurized air and a fine metallic mesh to avoid loss of plant material in the process.
2.4 Seedling measurement
Since the first sampling date, in the first week of January 2009 (one month old), all seedlings (10 for each treatment level) in each container were assessed for dry biomass weight and root area. From 90 days since sowing, the height and stem diameter were also measured (with ruler and a calliper) in all seedlings, at each sampling time. Also, from 90 days since sowing, quantum efficiency (Fv/Fm) was assessed using a FluorPen FP100 portable chlorophyll fluorometer (Pagter, 2008). Two measurements were made to four seedlings per N level, at each container sampled, in fully expanded, completely exposed leaves, after 30 minutes in dark, to assess the potential quantum yield.
Chlorophyll contents was assessed using an optical leaf-clip chlorophyll content meter (Minolta SPAD 502)(Ribeiro, 2004; Pagter, 2008). Measurements were made in the same leaves used to fluorescence measurements.
Chlorophyll fluorescence and leaf content were always measured at the same hour.
Leaves and root area were assessed by the software WinRHIZO© (Regent
Instruments, Canada, 2001) software. Roots were classified in diameter classes using also this software.
Total nitrogen for leaf, stem and root was analysed using Kjeldahl method (Horneck, 1998).
N uptake efficiency was calculated using the following formula:
• Uptake efficiency=(Seedling total N – Seedling total N in N0 level)/Supplied N * 100
2.5 RGP – Root Growth Potential
RGP test is a procedure that allows to test seedling potential to produce new roots, when subjected to non-limiting light and water conditions. The RGP test was performed, at plantation time. Plants were watered at field capacity, and submitted to a day-light period of 12 hours. Room temperature 22 to 25ºC. Soil temperature 20ºC. Seedlings were distributed randomly, in groups of 3 trough 24
Material and Methods
boxes with light potting mix (peat and vermiculite).
The root growth at the end of this 21 day period was measured using WinRHIZO©
(Regent Instruments, Canada, 2001) software, and biomass dry weight.
2.6 Field trials
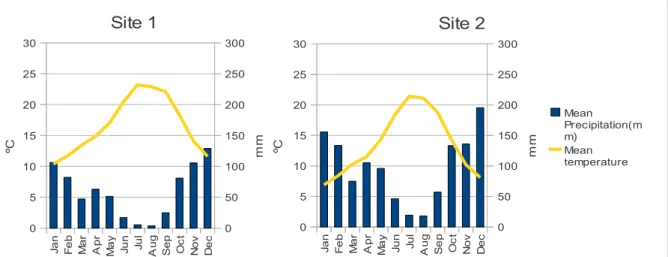
The performance of all seedlings with different N nutrition was evaluated also in the field. Two sites with different characteristics, were chosen for plantation. Site 1, representing an average good site (CELPA, 2001), in Valeira, Abrantes, Santarém District. Site 2 represents a poor site (CELPA, 2001), and is situated in Vale da Vinha, Viseu. Main differences in sites are mean temperature (about 3.5ºC lower in site 2), precipitation (higher in site 2)(Figure 2), and soil (Podzols in site 1 and Cambissols in site 2). Plants were installed in late March 2009, by usual planting procedure. Fertilization was done at installation time, using 30 g of commercial AGROBLEND® fertilizer (9:20:8 +3Mg+18S) per plant.
Plant height and survival was measured 9 months after installation.
Figure 2:Climagraph presenting climatological precipitation and temperature
means(1970-2000) for field trial site 1(Santarém) and field trial site 2 (Viseu).
2.7 Statistical analysis and Modelling
Analysis of variance (ANOVA) was used to test fertilization effect in all measured parameters. Differences among treatment means were assessed through Tukey test.
Linear mixed effect models were used to predict height and diameter growth for
Ja n F e b M a r A p r M a y Ju n Ju l A u g S e p O c t N o v D e c 0 5 10 15 20 25 30 0 50 100 150 200 250 300 Site 2 Mean Precipitation(m m) Mean temperature ºC mm Ja n F e b M a r A p r M a y Ju n Ju l A u g S e p O c t N o v D e c 0 5 10 15 20 25 30 0 50 100 150 200 250 300 Site 1 ºC mm
Material and Methods
each N level.
One way of expressing the Laird-Ware form of the linear mixed model is: yi = Xi + Zi bi + i β ε
bi Nq (0, ) ∼ Ψ i Nni (0, i )
ε ∼ σ Λ
where
• yi is the ni × 1 response vector for observations in the ith group.
• Xi is the ni × p model matrix for the fixed effects for observations in group i. • is the p × 1 vector of fixed-effect coefficients. β
• Zi is the ni × q model matrix for the random effects for observations in group i. • bi is the q × 1 vector of random-effect coefficients for group i.
• i is the ni × 1 vector of errors for observations in group i. ε • is the q × q covariance matrix for the random effects. Ψ
• 2 i is the ni × ni covariance matrix for the errors in group i (Fox, 2002). σ Λ
Height and diameter variables were Log-transformed to assure linearity in the relation with predictor variables.
Predictor variables were considered as hierarchical, since fertilization effect was clustered in the time variable.
Blocking factor was used to determine random effect in the model.
Linear mixed models were run in R software (R, 2005), with NLME package (Pinheiro, 2010). Restricted maximum likelihood was the method used to estimate coefficients for the linear models.
Results
3 RESULTS
The effects of fertilization are presented in two different phases. Phase 1 concerns nursery seedlings production period, and Phase 2, to the field performance.
3.1 Nursery
Biomass and morphology
Figure 3:Biomass evolution from
emergency to plantation in the field. Each
point represents mean seedling weight.
Vertical bars represent standard error. n=40
Figure 4:Seedlings Shoot/Root ratio (g/g)
from emergency to plantation in the field.
n=40
Eucalyptus seedlings, five and a half months after sowing, showed that seedling total biomass is significantly different between treatments (Figure 3).
In Figure 4, higher Shoot/root ratio was achieved with N40 and N70 levels. It is noteworthy that N40 level has the same trend as N70, with a 15 days delay.
20 40 60 80 100 120 140 160 180 0.0 0.5 1.0 1.5 2.0 2.5 3.0 3.5 4.0 4.5 N0 N10 N40 N70
Days since sow
g 45 60 75 90 105 120 135 150 165 0.0 2.0 4.0 6.0 8.0 10.0 12.0 14.0 N0 N10 N40 N70
Days since sow
S h o o t( g )/ R o ot( g )
Results
Figure 5:Seedlings biomass partitioning presenting leaf, stem and root dry weight
(g), since seedling emergency to plantation in the field
The biomass partitioning (Figure 5) highlights that the increase in fertilization leads to higher proportion of leaves and stem, rather than roots.
Figure 6:Seedling stem diameter and height, with standard error. Dashed lines indicate
areas outside commercialization allowed dimensions for E.globulus. Error bars represent
standard error. n=40
80 90 100 110 120 130 140 150 160 170 0 0.5 1 1.5 2 2.5 3 3.5 4 4.5Seedling stem diameter
N0 N10 N40 N70
Days since sow
S te m d ia m e te r (m m ) 80 90 100 110 120 130 140 150 160 170 0 5 10 15 20 25 30 35 40 45 50
Seedling height
N0 N10 N40 N70Days since sow
H e ig h t (c m ) 45 60 75 90 105 120 135 150 165 0.0 0.5 1.0 1.5 2.0 2.5 3.0 3.5 4.0 4.5 N0 Leaf Stem Root 45 60 75 90 105 120 135 150 165 0.0 0.5 1.0 1.5 2.0 2.5 3.0 3.5 4.0 4.5 N10 Leaf Stem Root 45 60 75 90 105 120 135 150 165 0.0 0.5 1.0 1.5 2.0 2.5 3.0 3.5 4.0 4.5 N40 Leaf Stem Root 45 60 75 90 105 120 135 150 165 0.0 0.5 1.0 1.5 2.0 2.5 3.0 3.5 4.0 4.5 N70 Leaf Stem Root
Results
In Figure 6, the dashed area corresponds to the maximum and minimum legal limits for seedlings stem diameter, height and age imposed by the Portuguese legislation for the commercialization of Eucalyptus seedling (Dec.Lei-205/2003). During producing time, N0 seedling always stands below the minimum of 2 mm diameter, and barely manages to reach minimum height, after six months.
On the opposite, N70 seedlings present after 165 days an average height above the allowed maximum height (40 cm)(Figure 6).
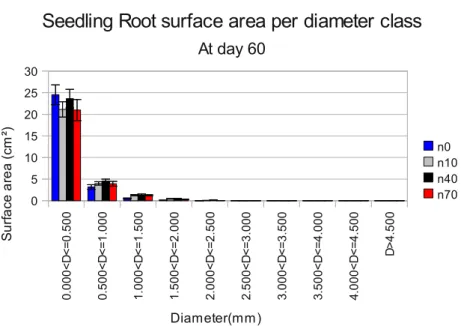
Figure 7:Seedling root surface area (cm²) per diameter class, at 2
months. Diameters class increment in 0.5 mm. Error bars represent
standard error. n=40
In two months old seedlings, differences at root surface area are not significant among N levels. Noticeably, roots in lower(0 - 0.5 mm) diameter class represent a large portion, about 75% of total root surface area (Figure 7).
0 .0 0 0 < D < = 0 .5 0 0 0. 5 0 0 < D < = 1 .0 0 0 1. 0 0 0 < D < = 1 .5 0 0 1. 5 0 0< D < = 2 .0 00 2. 0 0 0 < D < = 2 .5 0 0 2. 5 0 0< D < = 3 .0 00 3. 0 0 0< D < = 3 .5 00 3. 5 0 0< D < = 4 .0 0 0 4. 0 0 0< D < = 4 .5 00 D > 4 .5 0 0 0 5 10 15 20 25 30
Seedling Root surface area per diameter class
At day 60 n0 n10 n40 n70 Diameter(mm) S u rf a ce a re a ( cm ²)
Results
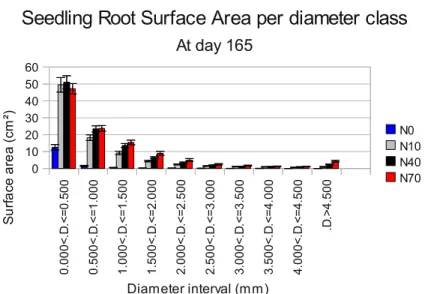
Figure 8:Root surface area per diameter class, at 5.5 months.
Diameters class increment in 0.5 mm. Error bars represent
standard error. n=40
Five and a half months (165 days) after sowing (Figure 8), root surface area presented by seedling is also indicative of their capability to uptake nutrients. The smaller diameter class, which is more reactive in absorption, shows significant differences for N0, whereas N10, N40 and N70 do not present significant differences among them (using multiple mean comparison with Tukey contrasts).
0. 0 0 0< .D .< = 0 .5 0 0 0. 5 0 0 < .D .< = 1 .0 0 0 1. 0 0 0 < .D .< = 1. 5 0 0 1 .5 0 0 < .D .< = 2. 0 0 0 2. 0 0 0 < .D .< = 2 .5 0 0 2. 5 0 0< .D .< = 3 .0 00 3. 0 0 0 < .D .< = 3 .5 0 0 3. 5 0 0 < .D .< = 4. 0 0 0 4. 0 0 0 < .D .< = 4. 5 0 0 .D .> 4 .5 0 0 0 10 20 30 40 50 60
Seedling Root Surface Area per diameter class
At day 165 N0 N10 N40 N70 Diameter interval (mm) S u rf a ce a re a ( cm ²)
Results
N uptake, partitioning, and photosynthetic capacity
20 40 60 80 100120140160180 0 10 20 30 40 50 60 N0 N10 N40 N70
Days since sow
N c o n te n t ( m g /g s e e d lin g d ry w e ig h t)
Figure 9:N content (mg per g of seedling
dry weight)
20 40 60 80 100 120 140 160 180 0.0 10.0 20.0 30.0 40.0 50.0 60.0 N0 N10 N40 N70Days since sow
T o ta l N c o n te n t ( m g )
Figure 10:Total N (mg) per seedling. Each
point represents the average of sampled
seedlings. Vertical bars represent standard
error. n=40
During the first two months, seedlings subjected to fertilization are mainly accumulating the uptaken N, since this phase on, uptaken N is mostly being used in growth (Figure 9). N10 and N40 seedling show significant differences in a Tukey test, from other treatments, but not between them.
From four and a half months (135 days) on, N in seedlings seem to stabilize in N40 and N70, while N per seedling weight continues to drop (Figure 10).
Results
0 30 45 60 75 90105120135150165 0 10 20 30 40 50 60 70 80 90 100 N10 N40 N70Days since sow
N u p ta ke %
Figure 11:Seedling N uptake efficiency in
percentage of supplied N.
As observed in Figure 11, the N uptake efficiency reveals that seedlings subjected to levels N40 and N70 cannot fully use the total N supplied. During production time, uptake efficiency increases, dropping since four and a half months for N40 and N70 treatments (Figure 11). However, at five and a half months (165), N10 seedlings achieves 100% uptake efficiency.
Figure 12: (A) Seedling leaf quantum yield assessed through chlorophyll a fluorescence.
(B) Seedling leaf chlorophyll content in SPAD index readings. Vertical bars represent
standard error. n=16
Below 0.7 of the potential quantum efficiency (FV/FM), it is considered that photosystem II is affected and has reduced efficiency. As observed in Figure 12,
20 40 60 80 100 120 140 160 180 0.0 0.1 0.2 0.3 0.4 0.5 0.6 0.7 0.8 0.9
(A)Seedling leaf chlorophyl a flourescence
N0 N10 N40 N70
Days since sow
P ot en tia l q ua nt um Yiel d (F v / F m ). 20 40 60 80 100 120 140 160 180 0 5 10 15 20 25 30 35 40 45
(B)Seedling leaf chlorophyl content
N0 N10 N40 N70
Days since sow
S P AD In de x
Results
only N0 stands below that limit at the end of the nursery producing period. Levels N10, N40 and N70 are not significantly different all along the period plants were in the nursery. Yet, Chlorophyll content is significantly inferior for N0 and N10. This is indicative of a lower photosynthetic capacity, namely a lower capacity in PSII photochemistry than in the other treatment levels (Figure 12).
High fertilized seedlings reached the highest value for quantum yield and chlorophyll content at four months.
Figure 13:Treatment effect significance in measured
variables through time. In green, significant differences; in
red, non-significant (W-weight, A-area, D-diameter,
V-volume, Flouresc-Quantum efficiency,
ChlorQt-Chlorophyll content)
Figure 13 shows that N fertilization promoted significant differences in Stem dry weight, leaf dry weight and leaf area at 2 months old, in root dry weight, root volume and root diameter, at two and a half months, and height, diameter, chlorophyll fluorescence and chlorophyll content, from three months (90 days) onward.
RGP test
Under optimal conditions of light, water and temperature as in the Root growth potential (RGP) test, new leaves and new roots were observed.
Both leaf and stem biomass, showed to be significantly influenced by treatment (p<0.0001).
Results
0. 0 0 0 < D < = 0 .5 0 0 0 .5 0 0 < D < = 1 .0 0 0 1. 0 0 0 < D < = 1 .5 0 0 1. 5 0 0 < D < = 2 .0 0 0 2. 0 0 0< D < = 2 .5 00 2. 5 0 0< D < = 3 .0 00 3. 0 0 0 < D < = 3 .5 0 0 3 .5 0 0 < D < = 4 .0 0 0 4 .0 0 0 < D < = 4 .5 0 0 D > 4 .5 0 0 0 10 20 30 40 50 60New roots surface area (RGP)
n0 n10 n40 n70 Diammeter class(mm) S u rf a ce a re a (c m ²)
Figure 14:Root growth surface area during RGP test. Vertical bars represent
standard error. Diameter class increment in 0.5 mm. n=12
Root growth capacity, observed in RGP test, reveals higher surface development for N fertilized seedlings, in comparison to N0, especially in the lower diameter class (D<0.5mm)(Figure 14).
Results
3.2 Field trial
Figure 15:Plant survival percentage in field trial site 1 (Santarém) and site 2
(Viseu). Significant differences between treatment means are marked in site 2 with a
and b (Tukey test). Vertical bars represent standard error. n=40
Seedlings survival was not significant different among treatment levels in Site 1 (Valeira) (F=0.3365, p=0.799). On the opposite, at site 2 (Vale da Vinha), the treatment effect was significant (F=14.5169, p<0.001) .
Survival was higher in site 1, for all levels. Significant differences among treatment levels was observed at site 2 (Figure 15). In Site 1, survival is approximately close to 100%, even for N0 seedlings, whereas for Site 2, survival is inferior for all levels, being significant lower between N0 and any other N fertilization level. 0 10 20 30 40 50 60 70 80 90 100
Site 1
N0 N10 N40 N70 P la n t s u rv iv a l ( % ) 0 10 20 30 40 50 60 70 80 90 100Site 2
N0 N10 N40 N70 P la n t s u rv iv a l ( % )a b
b
b
a b
b
b
a b
b
b
a b
b
b
Results
Figure 16:Plant field height in field trial site1 (Santarém) and site 2 (Vise). a,b and c
indicates significant differences among treatment mean (Tukey test). Vertical bars
represent standard error. n=40
Total height, measured 9 months after plantation (Figure16) was found significantly influenced by N treatment, at both sites. Tukey test also revealed significant differences in field height, between N0 and following levels. Height also differed between sites. Seedlings planted at site 1 were always higher irrespective of the treatment (Figure 16). In addition to site 1, N10 plant height is significantly different from that measured for N40 and N70 levels.
Field trial vs. RGP results
The following table (Table 2) shows a correlation matrix between field and RGP trial measured variables.
c
b
0 20 40 60 80 100 120 140 160 180Site 1
N0 N10 N40 N70 P la n t h e ig h t ( cm ) 0 20 40 60 80 100 120Site 2
N0 N10 N40 N70 P la n t h e ig h t ( cm )a b b b
a b bc c
Results
Table 2: Pearson Correlation test to RGP and Field variables. Numbers
between ( ) represent p-values. “n.s.”-Non significant
Site 1
Site 2
Height Survival Height Survival Leaf growth(RGP) 0.6(0.014) n.s. 0.81(0.0001) n.s. Root growth(RGP) 0.76(0.0007) n.s. 0.67(0.0047) 0.53(0.0338) Stem growth(RGP) 0.77(0.0005) n.s. 0.84(0.0000) 0.65(0.0065) RootW/totalW(RGP) 0.7(0.0027) n.s. 0.83(0.0000) 0.65(0.0069) Root before RGP 0.77(0.0005) 0.01(0.0658) 0.7(0.0026) 0.53(0.0344) Leaf before RGP 0.73(0.0014) n.s. 0.61(0.0122) n.s. RGP Root Surface area(d<0.5mm) 0.8(0.0002) n.s. 0.82(0.0000) 0.62(0.0097)
Correlation analysis of field survival and height with morphological measurements during the RGP test shows a good correlation between height of plants in the field and stem growth, leaf growth, fine root growth, and the root to total weight ratio at site 2. Significant high correlations were found between field height and fine root for both sites.
The highest correlation between survival and RGP observations, were to stem growth, root weight/total weight ratio and fine root growth.
A table containing a brief summary for treatment statistical analysis is presented in Annex 1.
3.3 Modelling seedling growth
Seedling growth for nursery production was estimated as a function of N fertilization level within time factor. In Table 3, variable properties are described.
Results
The model presenting lowest Akaike's Information Criterion (AIC) has the best goodness of fit to data. After assessing linearity, normality assumptions, and comparing AIC, the best model was selected. Tables 4 and 5 show a resume for the fixed effects in the diameter and height linear mixed effect models selected.
Table 4: Linear mixed model fixed effects parameters for the dependent variable diameter.
for
Log(diamete r)
Estimate Std. Error DF t-value p-value
(Intercept) -0.32924 0.04000 785 -8.97229 <0.001 Treatment N0:t 0.00157 0.00029 785 5.37417 <0.001 Treatment N10:t 0.00806 0.00029 785 27.68958 <0.001 Treatment N40:t 0.00989 0.00030 70 32.56371 <0.001 Treatment N70:t 0.01055 0.00030 785 34.69430 <0.001
Table 3: Variables considered in linear
mixed models
Variable levels Units
Block 4 levels
-Diameter Numeric mm
Height Numeric cm
Time (T) Numeric Day since
sow
Treatment 4 levels -N0,
-Results
Table 5: Linear mixed model fixed effects parameters for the dependent variable height.
forLog(height) Estimate Std. Error DF t-value p-value
(Intercept) 1.80069 0.04333 785 41.56192 <0.001 Treatment N0:t 0.00286 0.00033 785 8.74593 <0.001 Treatment N10:t 0.01060 0.00033 785 32.53517 <0.001 Treatment N40:t 0.01170 0.00034 785 34.41208 <0.001 Treatment N70:t 0.01216 0.00034 785 35.73673 <0.001
In Table 6, selected models equations for diameter and height with fixed effects estimates are presented, as respective selection indexes.
Table 6: Linear models equations and indexes: Akaike, Baesyan and LogLikelyhood
Dependent Equation AIC BIC LogLik
Log(diameter) -0.32924+0.00157(N0)*T+0.00806(N10)*T+0.00989(N40)*T
+0.01055(N70)*T -156.5598 -123.8733 85.2799
Log(height) 1.8007+0.00286(N0)*T+0.01060(N10)*T+0.01170(N40)*T
+0.01216(N70)*T 20.1572 52.8259 -3.0786
Software raw outputs for these models are presented in Annex 2.
Besides modelling growth for each treatment, it was possible, using the same methodology, to construct growth curves for other intermediary N levels. It was not possible to assess the linearity of this relations, without trial for these intermediary levels, but still, this is presented here as indicative (Figure 17). These models information are present in Annex 3.
Results
Figure 17: Estimated height and diameter using different N nutrition levels. Legend in the
right stands for total N supplied during production time
30 45 60 75 90 105 120 135 150 165 0 1 2 3 4 5 6 0 5 10 15 20 25 30 35 40 45 50 55 60 65 70
Days since sow
D ia m e te r (m m ) 30 45 60 75 90 105 120 135 150 165 0 10 20 30 40 50 60 0 5 10 15 20 25 30 35 40 45 50 55 60 65 70
Days since sow
H e ig h t ( cm )
Discussion
4 DISCUSSION
Effects of N fertilization level in the nursery and in the field
At the end of proposed production period (five and a half months), seedlings treated with different N levels showed significant differences in morphology, physiology and chemical N content.
Higher fertilization level promote an increase in seedling biomass, height and diameter, and differences in biomass partitioning. Shoot/root ratio and biomass partitioning graphics (Figures 4 and 5) reveal that high nitrogen fertilization level (N70) result in higher stem and leaf area (as in Ribeiro, 2004), than in treatments with lower nitrogen. Large leaf area can be advantageous in terms of plant photosynthesis but it also corresponds to a superior transpiration. In situations with low water availability, high transpiration rates can originate severe drought problems (Hernández, 2009).
Root development, observed during production time, can be a key feature to understand the differences observed in seedlings.
Until month 2 (day 60), fine root (d<0.5mm) surface area had no significant difference between treatments and control, and no differences were observed in N uptake, Then, 15 days later, differences start to emerge in seedlings growth, indicating the importance of these roots for the uptake capability and development kick-off.
The following development stages (from two to four and a half months) show N10 as a minimum level for sustaining physiological activities, and still support a good growth performance (Figure 3). The 100% N uptake efficiency means that all the N supplied is in immediate use for growth, as chlorophyll leaf content per leaf area is similar to N0 (Figure 12B). Still, results from the N higher levels imply that N10 does not supply the ideal N quantity for full growth capability. N40 and N70 levels have significant superior growth in all measured parameters.
From four and a half months on, highly fertilized seedlings (N40 and N70) display a decrease in the uptake, which can be observed in Figure 9. Yet, they manage to maintain the growth rate, using mainly the N previously accumulated, as a result the N concentration in the plants drops (Figure 10).
Discussion
Here, in concordance with Ericsson (1994), it is clear that when in non-limiting nutrient conditions, plants tend to take up most elements in excess of immediate requirements for growth, accumulating nutrients in tissues for future needs.
Even when N40 and N70 seedlings are producing luxury uptake, they are not capable to achieve full usage of supplied N. This indicates that even N40 fertilization level can be excessive, and hence that the optimum concentration of N is probably between N10 and N40.
Field performance
In field performance, growth was significantly affected by N treatment, N0 seedlings tend to have lower height, than the other treatments (Figure 16).
Correlation test shows a higher correlation coefficient at both sites for plant height and for fine roots surface area (<0.5mm)(Table 2).
As explained in Fabião (1994), fine root are the first to colonize the soil surrounding the seedling plantation site. Water supply and soil type seems to be the most important factor for root growth rate in the field. Still, it was possible in this study, to improve root growth potential with N fertilization in the nursery, and produce more responsive seedlings at root level.
The RGP shows a higher capability for fine root (<0.5mm) production by N fertilized seedlings, which is the main cause for a quick establishment, an earlier nutrient and water uptake in the field. This means that fertilized seedlings are more efficient in the use of natural resources and they become efficient earlier than non fertilized seedlings.
Nevertheless, it should be reminded that at installation time, all seedlings received an equal dosage of fertilizer, in order to cope with site nutrient limitations. However, N0 seedlings were not able to provide efficient nutrient uptake, underlining the importance of fertilization during seedlings production in the nursery.
N40 and N70 seedlings carry a higher seedling N concentration, which can be used for settling time growth. As for N10 seedlings, as observed in Fig.16 for site 1, has developed significantly lower field height (compared to N70), despite presenting high quantum efficiency at final production time. N reserves for these
Discussion
seedlings are pretty scarce, and can lead to slower growth rate. It is possible that recycling of N from leaves, to respond to N immediate needs at root level, can originate a decrease in the photosynthetic rate (Kull, 2006).
Results show also the importance of N fertilization for field survival. N0 presents a higher mortality than N fertilized seedlings, at least at one of the sites. As eucalyptus seedlings present a quick field growth, all replaced dead seedlings become promptly dominated by plants already installed. This is not desirable for Eucalyptus plantations. It is necessary to ensure a very high survival rate (close to 100%), which is obtainable with quality seedlings, planted in proper sites. Significant correlations were found between RGP root growth and new stem, leaf growth and survival in the field. This is explained by the faster responsive seedlings promptly establishing and growing, taking better advantage of available resources.
Physiologically, when seedlings present a higher photosynthetic activity, they are also capable of faster and higher growth performance. Indeed, looking at N0 results, not only are these seedlings smaller than the other treatments, but they also present low maximum quantum efficiency, indicating that photosynthetic capacity is affected, and seedlings can only perform poorly. As a result, seedlings with no nutrient reserves, low size and with low root growth capacity, will have also a deficient photosynthetic efficiency. These seedlings will show a large delay to achieve the growth required by law and for survival and sustained productivity in the field.
Performance predictors
In order to select good performance predictors, important information can be obtained through RGP test, especially fine roots growth, always considering that this test is performed in ideal light and water conditions, while in the field these optimal conditions cannot be always achieved and field performance will vary depending on the site.
However seedlings subjected to ideal conditions reveal good growth response in the field, as demonstrated here, in treatment levels N10, N40 and N70. Development of high RGP, especially fine diameter roots, will relate to quick field installation and probably to a good survival.
Discussion
An easy seedling N content assessment can be made by measuring chlorophyll content. In Figure 12 chlorophyll content is directly related with accumulated N. If uptake N is in immediate used for growing needs (like in N10), then no accumulation is observed, and chlorophyll content is low.
Photosystem performance is informative of seedlings photosynthetic apparatus. When the quantum yield is lower than 0.7, one can be sure that these seedlings will perform poorly (Björkman, 1987; Baker, 2004; Pagter, 2008). In this experiment, low N seedling concentration (as in N0) present a poor PSII performance, having effect in immediate growth, and as they cannot recover promptly, also when seedlings are installed in the field
Growth prediction
It was possible, with this study, to obtain several estimation models, based in production time and fertilization level. The lack of a new data for N fertilization seedling production difficult the assessment of models prediction reliability. Nevertheless, it was possible to prepare a spreadsheet to help in nursery production management, using these estimation models.
Eucalyptus stock production period is a quite important factor for producers. Here, it is showed that using an appropriate fertilization scheme, is possible to reduce seedling production time, contributing to save resources as water and space, as well as fertilizer quantity.
For N40 and N70 levels, seedling dimensions are within law minimum size at three and a half months, ready to be commercialized. For N10 level, only in seedlings with 4 months reach minimum allowed size. The four and a half month production time seems a good time goal, as for levels N40 and N70, seedling N content is in the top peak, and from then on, uptake efficiency starts decreasing, meaning the luxury uptake has reach a limit. If one would like to shorten the production time, the four month time line is also interesting, as quantum yield and chlorophyll content have maximum values, and seedling shoot/root has a low value, which is a desirable characteristic if fast anchorage to the soil and a fast use of soil resources need to be achieved.
Conclusion
5 CONCLUSION
Answering the main question proposed for this work, it is possible to model seedling morphological and physiological characteristics during production in nursery, in order to obtain quality plant with good field performance.
As shown here, plants, within limits considered by law, can sometimes be less productive and sustain poor field performance.
Having identified three main situations in the production time, it can be advisable to:
-Fertilize seedlings with a minimum N quantity (10 mg), until formation of efficient root system, around two months;
-Fertilize seedlings with a 40 mg N quantity until four and a half months (135 days), in order to promote a balanced growth;
-Fertilize seedlings with a minimum N quantity (N10), from four and a half months until planting, to maintain minimum levels for physiological well-being. At that time, plants are still using reserves for growth, more than supplied nutrient.
In this way, it is possible to apply N fertilizers efficiently, according to plant needs, without limiting field performance, limiting also production costs.
References
6 REFERENCES
Baker, N. R., Rosenqvist, E. (2004) ”Applications of chlorophyll
fluorescence can improve crop production strategies: an examination of future possibilities ”. Journal of Experimental Botany, Vol. 55, No. 403, pp. 1607–1621
Björkman, O. and Demmig, B. (1987). Photon yield of O2 evolution and
chlorophyll fluorescence characteristics at 77K among vascular plants of diverse origins. Planta 170:pp 489-504.
Borralho, N.M.G., *Almeida, M.H*., Potts, B.M. (2007). “O
melhoramento do eucalipto em Portugal. em O eucaliptal em Portugal. Impactes ambientais e investigação científica” (Editores: Alves, A.A., J.S. Pereira and J.M.N. Silva). ISAPress, Lisboa, Portugal: 61-110
Caldeira, M.C.B.B.(1991). Influência no crescimento e nas trocas gasosas
de plantulas de Eucalyptus globulus L. com dois níveis diferentes de nutrição azotada. Relatório de estágio do curso de Engenheiro Silvicultor. Instituto Superior de Agronomia, Universidade Técnica de Lisboa, Lisboa.
CELPA (2001). www.celpa.pt/images/articles/199/ciclo_floresta.pdf
CELPA (2009).Boletim estatístico. Indústria Papeleira Portuguesa. Lisboa Demotes-Mainard, S., Boumaza, R., Meyer, S., Cerovic, Z. G.(2008).
Indicators of nitrogen status for ornamental woody plants based on optical measurements of leaf epidermal polyphenol and chlorophyll contents. Scientia Horticulturae 115 (2008) 377–385
DGRF - Direcção Geral dos Recursos Florestais (2006). “Resultados
do Inventário Florestal Nacional 2005/2006”. Ministério da Agricultura, do Desenvolvimento Rural e das Pescas.
Ericson, T.(1994) Nutrient requirement of Eucalyptus globulus seedlings, in Pereira, J.S. and Pereira, H (ed) “Eucalyptus for biomass production”, pp.60-76.
Commision of the European Communities
Evans, J. R. (1989) Photosynthesis and nitrogen relationships in leaves of
C3 plants. Oecologia 12, 9-19
Fabião, A., Madeira, M., Steen, E., Katterer, T., Ribeiro, C.(1994)
Growth dinamics and spatial distribution of root mass in Eucalyptus globulus plantations in Portugal, in Pereira, J.S. and Pereira, H (ed) “Eucalyptus for biomass
References
production”, pp.60-76. Commision of the European Communities
Fox, J.(2002) Linear Mixed Models in Appendix to An R and S-PLUS Companion to Applied Regression . http://
cran.r-project.org/doc/contrib/Fox-Companion/appendix- mixed- models. pdf . Consulted in 06/09/2010
Hernández, E.I., Vilagrosa, A., Luis, V. C., Llorca, M., Chirino, E., Vallejo, V. R. (2009). “Root hydraulic conductance, gas exchange and leaf water
potential in seedlings of Pistacia lentiscus L. and Quercus suber L. grown under different fertilization and light regimes” .Environmental and Experimental Botany 67 (2009) 269–276
Horneck, D. A., Miller, R. O. (1998) Determination of total nitrogen in
plant tissue. Karla P. (ed) “Handbook of reference methods for plant analysis”. Pp 75-83. CRC. Boca Raton, FL, USA CRC Press.
Kaul, O. N., Srivastava, P. B. L., Tandon, V. N.(1970). Nutrition studies
on Eucalyptus. IV. Diagnosis of mineral deficiencies in Eucalyptus globulus seedlings. Indian Forester, June 1970. pp.453-456
Kull, O., Jarvis, P. G.(2006) The role of nitrogen in a simple scheme to
scale up photosynthesis from leaf to canopy. Plant, Cell and Environment Vol.18, Issue 10 pp 1174-1182
Lobo do Vale,R.(2002) Estudo da produtividade do Fósforo em Eucalyptus
globulus. Dissertação de Mestrado em Produção Vegetal. Instituto Superior de Agronomia, Universidade Técnica de Lisboa, Lisboa
Pagter, M., Liu, F., Jensen, C., Petersen, K. (2008). “Effects of chilling
temperatures and short photoperiod on PSII function, sugar concentrations and xylem sap ABA concentrations in two Hydrangea species” . Plant Science 175, 547–555.
Pinheiro, J., Bates, D., DebRoy, S., Sarkar, D., and the R
Development Core Team (2010). nlme: Linear and Nonlinear Mixed
Effects Models. R package version 3.1-97.
Ribeiro, H. (2004) “A fertilização azotada de pés-mãe de Eucalyptus
globulus Labill. Ssp. globulus – Efeito da propagação vegetativa por
estacas caulinares e estabelecimento de indicadores do estado
nutricional”. Dissertação para obtenção de grau de Doutor em Engenharia
References
Agronómica. Instituto Superior de Agronomia, Universidade Técnica de
Lisboa
Ritchie, G.A. (1984). “Chapter 23-Assessing seedling quality” in Duryea,
M. L., Landis, T. D. (1984).“Forest Nursery Manual: Production of Bareroot seedlings”. Forest Research Laboratory, Oregon State University. Corvallis.
R Development Core Team (2005). R: A language and environment for
statistical computing, reference index version 2.2.1. R Foundation for Statistical Computing, Vienna, Austria. ISBN 3-900051-07-0, URL http://www.R-project.org.
Villar-Salvador, P., Planelles, R., Enríquez, E., Rubira, J.P. (2004).
Nursery cultivation regimes, plant functional attributes, and field performance relationships in the Mediterranean oak Quercus ilex L. Forest Ecology and Management 196(2004) 257-266.
Annexes
Annexes
ANNEX 1 – Resume table for ANOVA test to treatment effect
Parameter F value/significance fortreatment
•
Nursery, at day 165
Root dry weight 134.2842*** Shoot dry weight 211.2164*** Shoot-root ratio 5.2408** Height 434.5782*** Diameter 333.3668*** Chlorophyll content 26.6251*** Fluorescence 38.1818*** N per seedling 223.36***
•
RGP
New root dry weight 4.0411e^32*** New leaves dry weight 8.9634e^31*** Root surface area(D<0.5)
•
Field trial Site 1
Height growth
Total Height 87.97 *** Survival 0.3365
•
Field trial Site 2
Height growth
Total Height 3928 *** Survival 14.5169***