Vol. 52, n. 1 : pp. 233-240, January-February 2009
ISSN 1516-8913 Printed in Brazil BRAZILIAN ARCHIVES OF
BIOLOGY AND TECHNOLOGY
A N I N T E R N A T I O N A L J O U R N A L
A Simple Approach to Integrate the Ecotoxicological and
Chemical Data for the Establishment of Environmental Risk
Levels
Augusto Cesar
1,2*, Denis Moledo de Souza Abessa
3, Camilo Dias Seabra Pereira
2,4, Aldo
Ramos Santos
2, Nuria Fernández
1, Rodrigo Brasil Choueri
1and Tomas Angel DelValls
11Department of Physical Chemistry; Faculty of Marine and Environmental Sciences; University of Cádiz; C.P.:
11510; Puerto Real - Cádiz - Spain. 2Departamento de Ecotoxicologia; Universidade Santa Cecília; Rua Oswaldo Cruz, 266; 11045-907; Santos - SP - Brasil. 3Campus Experimental do Litoral Paulista;Universidade Estadual Paulista; Praça Infante Dom Henrique, s/n; 11330-900; São Vicente - SP - Brasil. 4Instituto Oceanográfico da Universidade de São Paulo; Praça do Oceanográfico, 191; São Paulo - SP - Brasil
ABSTRACT
In this work, multivariate and numeric methods were used to integrate the chemical and ecotoxicological data obtained for the sediments from the Santos Estuarine System, and for the vicinity of the discharges of the Submarine Sewage Outfall of Santos, in order to establish more accurately the environmental risks, identify the priority areas and thus provide guidance to control the programs and public policies. For both the datasets, the concentrations which exceeded numeric sediment guidelines tended to be associated to toxicity. For the estuary, this trend was corroborated by the correlations between the toxicity and Cu and PAHs levels, whereas for the sewage outfall region, this was observed through the correlation between the toxicity and Hg contents. Ratio-to-mean values were calculated for each sample, in order to rank them according to the toxicity and contamination. Cluster analyses confirmed the ranking results. For the estuary, three categories of sediments were established: stations 2, SSV-3 and SSV-4 were under major risks, followed by SSV-6. Stations SSV-1 and SSV-5 were not altered. Concerning to the sewage outfall, stations 1 and 2 presented better quality, whereas station 5 seemed to be under risk, followed by stations 3 and 4, which exhibited some signs of alteration.
Key words: Sediment, Contamination,Toxicity,Tiburonella viscana,Environmental risk assessment
* Author for correspondence: [email protected]
INTRODUCTION
The Santos Estuarine System (SES) is located on the coast of the State of São Paulo, Brazil and
comprises part of the Baixada Santista
Metropolitan Region. The biggest Brazilian
industrial complex as well as the major Latin
César, A. et al. 234
total mangrove area of São Paulo (Lamparelli et al., 2001).
The quality of the sediments from SES has been studied already, with the purpose of environmental diagnosing and monitoring (Abessa, 2002; Abessa et al., 1998; 2001; 2005; Lamparelli et al., 2001; Prósperi, 2002; Rachid, 2002; Cesar et al., 2006). However, only a few of these authors attempted to integrate the data of different natures in a comprehensive approach. Such approach is needed for a better decision-making process and also to the establishment of public policies, aiming to protect the natural resources, or mitigate the environmental impacts.
Therefore, the objective of this study was to use
some simple methods to integrate the
ecotoxicological and chemical data, in order to obtain the environmental risk levels, which could
support further actions, particularly the
remediation of contaminated sites.
MATERIALS AND METHODS
This study used the ecotoxicological and chemical data obtained by Cesar et al. (2006) for the
sedimentsamples collected in different areas along
the SES, and the data produced by Abessa et al. (2005) for the vicinity of the Submarine Sewage Outfall of Santos (SSOS), also situated in the SES (Fig.1).
The first dataset comprised the samples from six sites, with different degrees of degradation. Three sampling sites were located in the Santos Channel, in the zone influenced by the harbor and industrial zone (SSV-1 to SSV-3); two sampling sites were located in the São Vicente Channel (SSV-4 and SSV-5), which was mainly influenced by the discharges of untreated sewage and by irregular domestic and industrial landfills; and the last site was located in the central portion of Santos Bay (SSV-6), near the SSOS.
The grain size distribution expressed as % fines (<63 µm), total organic carbon (TOC) and concentrations of Zn, Cd, Pb, Cu, Ni, Co, V, total PAHs and total PCBs were determined by using the appropriate methods, according to the specialized scientific literature (USEPA 8080, 8310, 1999; APHA, 1999). The whole-sediment
toxicity test with the amphipod Tiburonella
viscana was conducted following the standard
protocol (Abessa and Sousa, 2003; Melo and Abessa, 2002).
For the second dataset used in the present work, the sediments were collected at five stations distributed around the SSOS diffusers. These sediments were analyzed for the grain size distribution, total organic carbon (TOC), Al, Fe, Cd, Cr, Co, Hg, Ni, Pb and Zn concentrations and Methylene Blue Active Substances (MBAS), i.e. anionic detergents. The toxicity test was conducted
with the same amphipod species T. viscana.
Figure 1 - Geographical location and position of the sampling points in the Santos and São Vicente
For both the dataset, the chemistry data were firstly compared to the Canadian Sediment Quality Guidelines (Smith et al., 1996), in order to analyse the single risk of each contaminant to benthic organisms. The presence of acute toxicity (i.e.,
significant amphipod mortality) was also
interpreted as an evidence of risk to the environment.
Thereafter, the data were combined by using the multiple linear correlations. This method was applied to observe linear associations between the
contaminants/toxicity and some sediment
properties (organic carbon and grain size distribution), and also between the toxicity and contamination.
Furthermore, a cluster analysis was conducted with each data set (Bray Curtis distance; Group Average Link), in order to separate the sediments with different degrees of quality for the aquatic life. To better understand such differences, a method was used to rank the six sediment samples, according to their environmental quality.
This method was adapted from the Ratio to Maximum Value approach (Del Valls and Chapman, 1998; Del Valls et al., 1998), normally used for the sediment quality triad, with some modifications proposed by Abessa (2002) to the SES, and consisted of four steps explained below. Step 1 consisted of the calculation of mean values for each contaminant and toxicity, based on the values obtained for each of the six stations. In the Step 2, ratio-to-mean values were established (RTMe) by dividing the value for each sediment sample by the respective calculated mean. This provided a new matrix, containing the RTMe values for each variable. In Step 3, an arithmetic mean for the contaminants was calculated, providing a mean RTMe for the all the considered chemicals at each station. Step 4 consisted of
calculating an arithmetic mean of the RTMe values obtained for the toxicity and contaminants. Thus, the data could be reduced to a single value for each sample, which could be used to rank the sediments and consequently, the sampling sites, based on the environmental quality.
RESULTS AND DISCUSSION
Santos Estuarine System
The results obtained by Cesar et al. (2006) for the sediment contamination and physical-chemical parameters are summarized in the Table 1. Sediment samples tended to present low percents of fines, except those from SSV-3 and SSV-6, which presented slightly higher contents. The Organic Carbon (OC) levels in the sediments tended to be low. The higher OC levels were found in the sediments collected in the inner estuary. Regarding the chemical contamination, concentrations above the Canadian “Threshold Effect Level” (TEL) were found for Cu (SSV-2; SSV-3; SSV-4); V 3 and SSV-4); Zn (2) and Total PAHs (2; 3; 4; SSV-6). Significant toxicity was observed in the sediments from stations (SSV-2; SSV-3; SSV-4; 5 and 6). Therefore, sites 2, SSV-3, SSV-4 and SSV-6 exhibited both the chemical and ecotoxicological evidences of degradation. Abessa (2002) found that the most of toxic sediments in the SES exhibited contamination above the TEL. For the station SSV-5, there was only an ecotoxicological evidence of degradation, which could be caused by a non-measured contaminant or by a natural factor. Sediments from SSV-1 did not exhibit chemical contamination above the TEL or amphipod toxicity.
Table 1 - Results of amphipod toxicity test and physical-chemical analyses in the sediments from Santos and São
Vicente Estuary (from Cesar et al., 2006).
Amphipod
mortality (%) Metals (mg.kg
-1
) Organics Sediment
properties Sampling
sites
Mean ± sd Cd Co Cu Ni Pb V Zn PAHs
(mg.kg-1)
PCBs (µg.kg-1)
OC (%)
Fines (%)
César, A. et al. 236
The correlation analyses (p<0.05) showed that the V concentrations were associated to the OC (r =
0.63), whereas nickel presented positive
correlation to the percent of fines (r = 0.69). The amphipod mortality showed positive correlation to PAHs (r = 0.84) and Cu (r = 0.68). Weak correlations were observed between the toxicity and V (r = 0.47), Zn (0.44), and total PCBs (r = 0.45). The results of these analyses showed that those contaminants which exceeded TEL values were strongly associated to amphipod toxicity, corroborating the results provided by the single occurrence of toxicity and/or TEL exceedance. Besides the appropriate characterization of the
ecological risks, their origin and possible effects, a proper environmental management in SES would require the establishment of priority areas in which some intervention would be needed. Thus, ranking the six study sites became necessary, which was done by the RTMe method (Table 2). The position of each sample in this ranking was relative only to the set of data being analysed, were the ranking showed the quality of each sample in relation to the others, and among them, indicating which ones were in better and worse conditions. This ranking couldnot be used with any other purpose, especially in comparisons to external data.
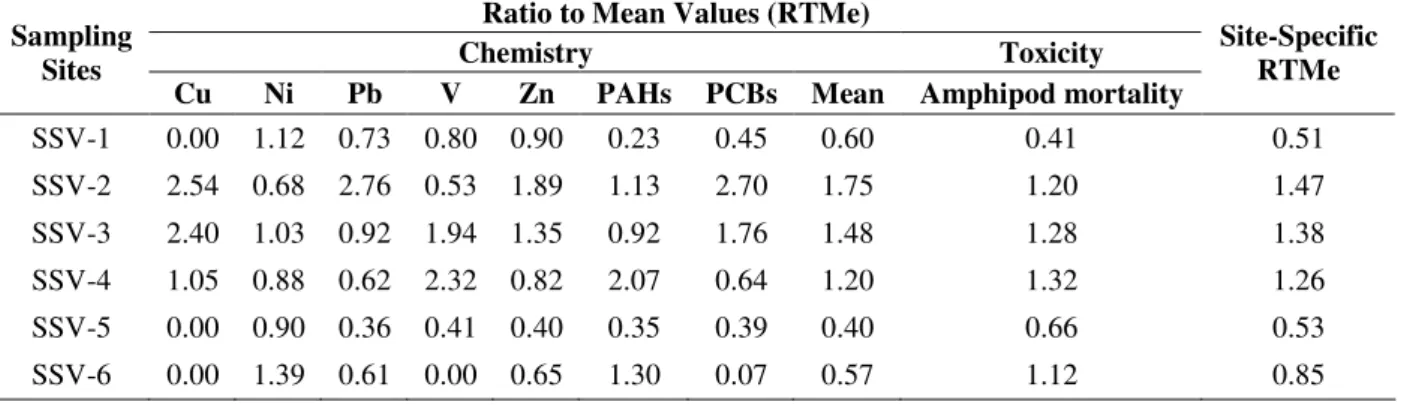
Table 2. Ratio to Mean Values (RTMe) calculated for each contaminant, for the toxicity and their combination into
Site-Specific values for the Santos Estuarine System.
Ratio to Mean Values (RTMe)
Chemistry Toxicity
Sampling Sites
Cu Ni Pb V Zn PAHs PCBs Mean Amphipod mortality
Site-Specific RTMe
SSV-1 0.00 1.12 0.73 0.80 0.90 0.23 0.45 0.60 0.41 0.51
SSV-2 2.54 0.68 2.76 0.53 1.89 1.13 2.70 1.75 1.20 1.47
SSV-3 2.40 1.03 0.92 1.94 1.35 0.92 1.76 1.48 1.28 1.38
SSV-4 1.05 0.88 0.62 2.32 0.82 2.07 0.64 1.20 1.32 1.26
SSV-5 0.00 0.90 0.36 0.41 0.40 0.35 0.39 0.40 0.66 0.53
SSV-6 0.00 1.39 0.61 0.00 0.65 1.30 0.07 0.57 1.12 0.85
According to the ranking, stations SSV-1 and SSV-5 presented the lower RTMe values. These two areas seemed to be not degraded. However, sediments from SSV-5 exhibited toxicity. Since no significant contamination was measured in this station, further studies were required to confirm the toxicity. Stations SSV-2, SSV-3 and SSV-4 had the highest RTMe values, indicating that these three stations were the most degraded among the studied sites. The sediments on such stations presented the toxicity and the concentration of three contaminants exceeded their corresponding TEL values. Station SSV-6 exhibited an intermediate RTMe value, which was due to the toxicity and to PAHs concentration which exceeded TEL value.
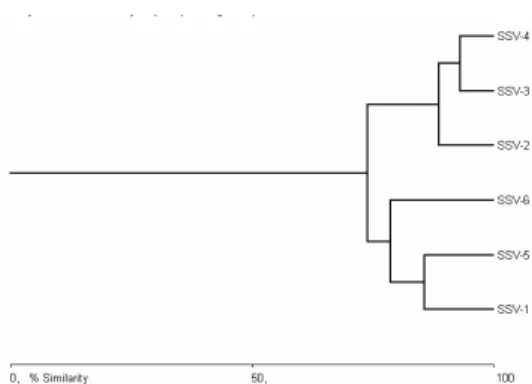
The result produced by the RTMe method was confirmed by the cluster analysis (Fig. 2). Stations SSV-2, SSV-3 and SSV-4 were grouped together, whereas stations SSV-1 and SSV-5 formed another group. Station SSV-6 placed between
these two groups, showing intermediate signs of degradation.
Figure 2 - Cluster analysis result using chemical and ecotoxicological data obtained by Cesar et al. (2006) for the Santos Estuarine System (Bray Curtis distance; Group Average Link).
Submarine Sewage Outfall of Santos
The original results for sediment contamination and physical-chemical parameters are show in the Table 3 (Abessa et al., 2005). Sediments from stations 1, 2 and 4 were composed primarily of sand, whereas those from stations 3 and 5 were sandy muds. The highest TOC levels were measured in the sediments of stations 2 and 5, respectively.
The levels of metals tended to be low in most of the samples. However, concentrations higher than TEL values were observed for Hg in stations 4 and 5 and Ni in station 5. The highest concentrations of all the metals occurred in station 5, although mostly below the TEL. The highest anionic detergent (MBAS) contents were observed in the sediments from stations 1 and 2, but it did not
cause amphipod toxicity, confirming that
measured MBAS levels were moderate in the region. Significant toxicity was observed in the
sediments from stations 3 and 4, when compared to the negative control.
Therefore, station 4 presented the chemical and ecotoxicological evidences of degradation, and station 3 presented the ecotoxicological evidences of degradation. However, Abessa et al. (2005) reported high levels of unionized ammonia in the porewater extracted from these sediments, close to the LC50-72h values to this species, which were
1.83 (0.87-3.84) mg.L-1 NH3 (Abessa, 2002). Thus,
this compound could have influenced the results. Station 5 exhibited some contaminants above TEL, but no acute toxicity, and sediments from stations 1 and 2 were considered of low contamination by Abessa et al. (2005).
The mud content correlated with the concentrations of Cd (r = 0.70) and Cr (r = 0.64). The TOC percent also correlated with these two metals (0.64 and 0.55, respectively).
Table 3. - Results of amphipod toxicity test and physical-chemical analyses in the sediments collected close to the
Submarine Sewage Outfall of Santos (from Abessa et al., 2005).
Amphipod
mortality(%) Metals (%) Metals (mg.kg
-1
) Sediment
properties Sampling
sites
Mean ± sd Al Fe Zn Ni Pb Cd Cr Co Hg TOC
(%)
Fines
(%)
MBAS
(mg.kg1)
César, A. et al. 238
A positive correlation was observed between the amphipod mortality and Hg (r = 0.82), suggesting that was one of the causes of the observed toxicity. Moreover, negative correlations were observed for Al (r = -0.70), Zn (r = -0.59), Co (r = -0.59) and TOC (r = -0.84) levels, indicating that probably there was an association between the fines and TOC with some metals.
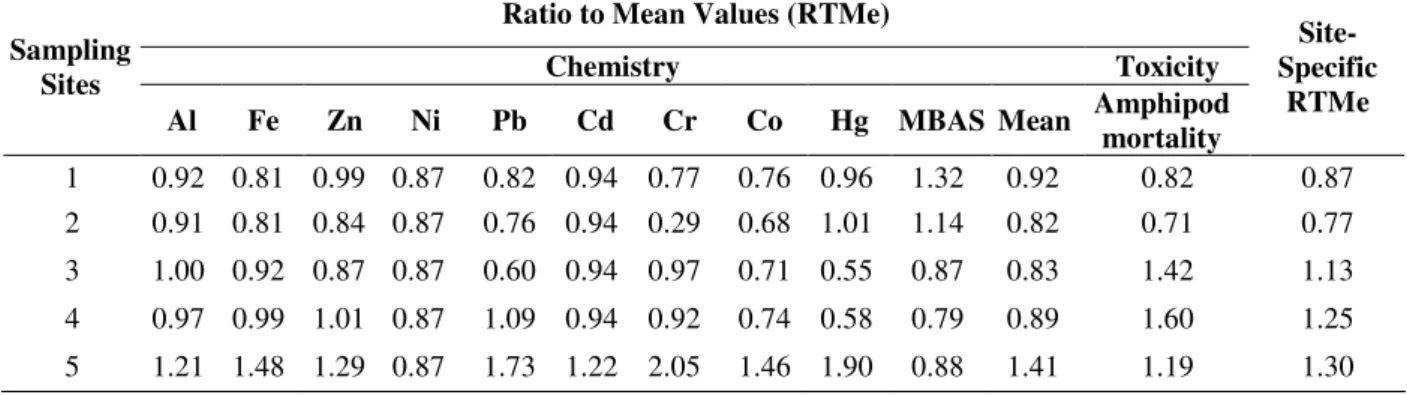
The ranking of sample based on the RTMe method (Table 4) showed better sediment quality in stations 1 and 2. Alteration in sediment quality was observed for stations 3, 4 and 5, which were situated at South, North and East of the SSOS diffusers. The highest RTMe value was obtained for Station 5.
Table 4 - Ratio to Mean Values (RTMe) calculated for each contaminant, toxicity and their combination into
Site-Specific values for the Submarine Sewage Outfall of Santos.
Ratio to Mean Values (RTMe)
Chemistry Toxicity
Sampling Sites
Al Fe Zn Ni Pb Cd Cr Co Hg MBAS Mean Amphipod
mortality
Site-Specific
RTMe
1 0.92 0.81 0.99 0.87 0.82 0.94 0.77 0.76 0.96 1.32 0.92 0.82 0.87 2 0.91 0.81 0.84 0.87 0.76 0.94 0.29 0.68 1.01 1.14 0.82 0.71 0.77 3 1.00 0.92 0.87 0.87 0.60 0.94 0.97 0.71 0.55 0.87 0.83 1.42 1.13 4 0.97 0.99 1.01 0.87 1.09 0.94 0.92 0.74 0.58 0.79 0.89 1.60 1.25 5 1.21 1.48 1.29 0.87 1.73 1.22 2.05 1.46 1.90 0.88 1.41 1.19 1.30
Figure 3. - Cluster analysis result using chemical and ecotoxicological data obtained by Abessa et
al. (2005) for the vicinity of the Submarine Sewage Outfall of (Bray Curtis distance; Group Average Link).
As mentioned by Abessa et al. (2005), the result for station 1 was unexpected, since this station was located very close to the SSOS diffusers. This could be explained by the sediment transport towards the east (i.e., towards the Station 5), that occurred after the passage of low-pressure systems. Stations 3 and 4 were under the influence of the effluent plume in normal weather conditions (Harari et al., 1997; 2000), which could help to explain the Hg contamination in the sediments from station 4 and the toxicity in both the sediments.
The ranking was confirmed and even more
weight of evidences, providing a rapid, easy and effective identification of ¨hot spots¨ from an intensive set of data in the environmental quality studies.
ACKNOWLEDGEMENTS
This work was partially funded by the Brazilian-Spanish joint project (CAPES-Brazil #099/06 - BEX 3239/06-3; BEX 3238/06-07, MEC- Spain PHB2005-0100-PC and Spanish Ministry of Education Project CTM2005- 07282-C03C01/ TECNO - UNITWIN/UNESCO/WiCop). Denis Abessa would like to thank FAPESP (98/00808-6) for the financial support.
RESUMO
O presente trabalho utilizou métodos
multivariados e matemáticos para integrar dados químicos e ecotoxicológicos obtidos para o Sistema Estuarino de Santos e para a região próxima à zona de lançamento do emissário submarino de Santos, com a finalidade de estabelecer com maior exatidão os riscos ambientais, e assim identificar áreas prioritárias e orientar programas de controle e políticas públicas. Para ambos os conjuntos de dados, as violações de valores numéricos de qualidade de sedimento tenderam a estar associadas com a ocorrência de toxicidade. Para o estuário, essa tendência foi corroborada pelas correlações entre a toxicidade e as concentrações de HPAs e Cu, enquanto para a região do emissário, pela correlação entre toxicidade e conteúdo de mercúrio no sedimento. Valores normalizados em relação às medias foram
calculados para cada amostra, permitindo
classificá-las de acordo com a toxicidade e a contaminação. As análises de agrupamento confirmaram os resultados das classificações. Para os dados de sistema estuarino, houve a separação das amostras em três categorias: as estações SSV-2, SSV-3 e SSV-4 encontram-se sob maior risco, seguidas da estação SSV-6. As estações SSV-1 e SSV-5 demonstraram melhores condições. Já em relação ao emissário, as amostras 1 e 2 apresentaram melhores condições, enquanto a estação 5 pareceu apresentar um maior risco, seguida das estações 3 e 4 que tiveram apenas alguns indícios de alteração.
REFERENCES
Abessa, D. M. S. (2002), Avaliação da Qualidade de Sedimentos do Sistema Estuarino de Santos. SP. Brasil. Doctorate Thesis. Universidade de São Paulo. Instituto Oceanográfico. São Paulo. 290p.
Abessa, D. M. S. and Sousa, E. C. P. M. (2003), Sensitivity of the amphipod Tiburonella viscana to K2Cr2O7. BrazilianArch. Biol. Technol., 46(1), 3-55.
Abessa, D. M. S.; Sousa, E. C. P. M.; Rachid, B. R. F. and Mastroti, R. R. (1998), Use of the burrowing amphipod Tiburonella viscana as a tool in marine sediments contamination assessment. Brazilian Arch. Biol. Technol., 41(2), 225-230.
Abessa, D. M. S.; Sousa, E. C. P. M.; Rachid, B. R. F. and Mastroti, R. R. (2001), Sediment toxicity in Santos estuary. SP-Brazil: preliminary results. Ecotoxicology Environ. Restaur.,4(1), 6-9.
Abessa, D. M. S.; Carr, R. S.; Rachid, B. R. F.; Sousa, E. C. P. M.; Hortelani. M. A. and Sarkis. J. E. (2005), Influence of a Brazilian Sewage Outfall on the Toxicity and Contamination of Adjacent Sediments. Marine Poll. Bull., 50, 875-885.
American Public Health Association (1999), AWWA/WPCF, Standard Methods for the Examination of Water and Wastewater, 20th ed, Washington, DC.
Cesar, A.; Pereira, C. D. S.; Santos, A. R.; Abessa, D. M. S.; Fernández, N.; Choueri, R.; DelValls, A. (2006), Ecotoxicology assessment of sediments from Santos and São Vicente Estuarine System – Brazil. Brazilian Jour. Ocean., 54 (1), 55-63
DelValls, T. A.; Chapman, P. M. (1998), Site-specific quality values for the gulf of Cádiz (Spain) and San Francisco Bay (USA). using the sediment quality triad and multivariate analysis. Ciencias Mar., 24(3), 313-336.
DelValls, T. A.; Forja. J. M.; Gómez-Parra. A. (1998), The use of multivariate analysis to link sediment contamination and toxicity data to establish sediment quality guidelines: an example in the Gulf of Cádiz (Spain). Ciencias Mar., 24(2), 127-154.
Harari, J.; Camargo, R. (1997), Simulações da circulação de maré na região costeira de Santos (SP) com modelo numérico hidrodinâmico. Pesquisas Nav., 10, 173-188.
Harari, J. Camargo, R.; Cacciari, P.L. (2000), Resultados da modelagem numérica hidrodinâmica em simulações tridimensionais das correntes de maré na Baixada Santista. Revista Brás. Rec. Hídr., 5(2), 71-87.
César, A. et al. 240
Melo, S. L. R.; Abessa, D. M. S. (2002), Testes de toxicidade com sedimentos marinhos utilizando anfípodos. In: Métodos em Ecotoxicologia Marinha: Aplicações no Brasil. eds I. A. Nascimento.; E. C. P. M. Sousa and M. G. Nipper. Artes Gráficas e Indústria Ltda. São Paulo. pp. 163-178.
Prósperi, V. A. (2002), Comparação de métodos ecotoxicológicos na avaliação de sedimentos marinhos e estuarinos. Doctorate Thesis. Universidade de São Paulo. Escola de Engenharia de São Carlos. São Carlos. 118p.
Rachid, B. R. F. (2002), Avaliação ecotoxicológica dos efluentes domésticos lançados pelos sistemas de disposição oceânica da Baixada Santista. Doctorate Thesis. Universidade de São Paulo. Instituto Oceanográfico. São Paulo. 286p.
Smith, S. L.; Macdonald, D. D.; Keenleyside, K. A.; Gaudet, C. L. (1996), The development and implementation of Canada Sediment Quality Guidelines. In: Development and Progress in Sediment Quality Assessment: Rationale. Challenges. Techniques and Strategies. eds M. Munawar and G. Dave. SPB Academic Publishing. Amsterdam. The Netherlands. pp.233-249.
U. S. Environmental Protection Agency. (1999), Integrated approach to assessing the bioavailability and toxicity of metals in surface waters and sediments (Including the metals mixtures equilibrium partitioning sediment guideline document). Briefing materials presented to the Science Advisory Board, April 6-7.