Absence of ferromagnetic order in high quality bulk Co-doped ZnO
samples
H. B. de Carvalho, M. P. F. de Godoy, R. W. D. Paes, M. Mir, A. Ortiz de Zevallos et al.
Citation: J. Appl. Phys. 108, 033914 (2010); doi: 10.1063/1.3459885
View online: http://dx.doi.org/10.1063/1.3459885
View Table of Contents: http://jap.aip.org/resource/1/JAPIAU/v108/i3
Published by the American Institute of Physics.
Related Articles
Identification of a paramagnetic recombination center in silicon/silicon-dioxide interface Appl. Phys. Lett. 100, 152107 (2012)
Magneto-mechanical resonance of a single superparamagnetic microbead trapped by a magnetic domain wall J. Appl. Phys. 111, 07B310 (2012)
Dynamics of superparamagnetic microbead transport along magnetic nanotracks by magnetic domain walls Appl. Phys. Lett. 100, 082401 (2012)
Note on de Haas-van Alphen diamagnetism in thin, free-electron films AIP Advances 2, 012105 (2012)
Irradiation enhanced paramagnetism on graphene nanoflakes Appl. Phys. Lett. 99, 102504 (2011)
Additional information on J. Appl. Phys.
Journal Homepage: http://jap.aip.org/
Journal Information: http://jap.aip.org/about/about_the_journal
Top downloads: http://jap.aip.org/features/most_downloaded
Absence of ferromagnetic order in high quality bulk Co-doped ZnO
samples
H. B. de Carvalho,1,a兲 M. P. F. de Godoy,2R. W. D. Paes,3M. Mir,1A. Ortiz de Zevallos,4 F. Iikawa,4M. J. S. P. Brasil,4V. A. Chitta,5W. B. Ferraz,6M. A. Boselli,3and
A. C. S. Sabioni3
1
Universidade Federal de Alfenas, 37130-000 Alfenas, Minas Gerais, Brazil 2
Universidade Federal do ABC, 09210-170 Santo André, Sao Paulo, Brazil 3
Universidade Federal de Ouro Preto, 35400-000 Ouro Preto, Minas Gerais, Brazil 4
Instituto de Física Gleb Wataghin, Universidade Estadual de Campinas, 13083-970 Campinas, Sao Paulo, Brazil
5
Instituto de Física, Universidade de São Paulo, P.O. Box 66318, 05315-970 São Paulo, Sao Paulo, Brazil 6
Centro de Desenvolvimento de Tecnologia Nuclear/CNEN, 31270-901 Belo Horizonte, Minas Gerais, Brazil
共Received 29 April 2010; accepted 3 June 2010; published online 11 August 2010; corrected 16 August 2010兲
Bulk Zn1−xCoxO samples were synthesized via standard solid-state reaction route with different Co
molar concentrations up to 21%. A detailed microstructural analysis was carried out to investigate alternative sources of ferromagnetism, such as secondary phases and nanocrystals embedded in the bulk material. Conjugating different techniques we confirmed the Zn replacement by Co ions in the wurtzite ZnO structure, which retains, however, a high crystalline quality. No segregated secondary phases neither Co-rich nanocrystals were detected. Superconducting quantum interference device magnetometry demonstrates a paramagnetic Curie–Weiss behavior with antiferromagnetic interactions. We discuss the observed room temperature paramagnetism of our samples considering the current models for the magnetic properties of diluted magnetic semiconductors. © 2010 American Institute of Physics.关doi:10.1063/1.3459885兴
I. INTRODUCTION
Spin injection in semiconductors is a fundamental prob-lem for developing spintronic devices due to the well known impedance mismatch between semiconductors and ferromagnetics.1 III-V diluted magnetic semiconductors
共DMS兲 2,3 was then proposed as an alternative system for spintronic devices with the advantage of introducing new functionalities that are difficult to be implemented in metallic structures, such as electrical control of both the coercivity4 and the Curie temperature.5The magnetic properties of III-V DMS are well explained by an indirect exchange mechanism in which the ferromagnetism 共FM兲 between magnetic ions are mediated by free carriers. Unfortunately the relatively low Curie temperatures共TC⬍180 K兲of III-V DMS are not
appropriate for most practical applications. The prediction of a stable long range magnetic ordering at high temperatures for other transition metal共TM兲doped semiconductors,6 spe-cifically for the Mn-doped GaN and ZnO, followed by the observation of room temperature FM共RTFM兲has stimulated a large effort on the research of those materials.
In spite of extensive studies, understanding the magnetic properties of TM-doped ZnO systems still remains a contro-versial issue, mostly due to the low-reproducibility of the results from samples grown by different preparation methods.7,8 Experimentally, there are conflicting reports pointing that samples grown under similar conditions may present ferromagnetic or paramagnetic behavior at room
temperature.9,10 The RTFM observed for some samples has been attributed to different origins, including the original model based of FM mediated by free carriers or by shallow donor–electrons forming bound polarons,11 and alternative explanations such as the formation of a magnetic secondary phase12and TM-rich nanocrystals.13A conclusive analysis on the presence of the microstructures assigned to those alterna-tive explanations of the RTFM is, however, a difficult task that requires additional analysis than standard characteriza-tion techniques.14
In the present work we report a detailed study of the microstructure and the magnetic properties of Zn1−xCoxO
bulk samples with Co molar concentrations of 4%, 8%, 12%, 15%, and 21% prepared by a standard solid-state reaction method. Magnetic results demonstrated an absence of ferro-magnetic order at room temperature in all samples. We per-formed a detailed microstructural characterization by conju-gating several different techniques, in order to understand the origin of the paramagnetic behavior of the samples consid-ering the proposed models for the magnetic properties of TM-doped ZnO.
II. EXPERIMENT
Polycrystalline Zn1−xCoxO 共x= 0.04, 0.08, 0.12, 0.15,
and 0.21兲bulk samples were prepared by the standard solid-state reaction method. Stoichiometric amounts of ZnO
共99.998%兲 and Co3O4 共99.7%兲 were mixed and ball milled
for 5 h using Zn spheres. The resulting powder was cold compacted by an uniaxial pressure of 600 MPa in the form of
a兲Electronic mail: [email protected].
pellets共green pellets兲. The green pellets were finally sintered in oxygen atmosphere at 1400 ° C for 4 h. The crystalline structure of the samples was studied using a Philips x-ray diffractometer 共XRD兲 employing FeK␣ radiation and a graphite monochromator. XRD data was recorded in the range of 2= 35.00° – 65.00° with steps of 0.01° at 1.2 s/step. Structural analysis was performed using the Rietveld method as implemented by the software package FULLPROF.15 The microstructure and the composition distribution were also characterized using a scanning electron microscope 共SEM兲
and an energy dispersive x-ray spectrometer共EDS兲. To de-termine the valence state of the Co dopant in the ZnO lattice, Co K-edge x-ray absorption near edge structure 共XANES兲
was measured in the transmittance mode at the XAS beam-line from the Brazilian Synchrotron Light Laboratory
共LNLS兲, Campinas, Brazil. Raman spectroscopy was used to study the Co incorporation on the ZnO matrix and the result-ing lattice disorder as well as to analyze the formation of segregated secondary phases. Raman was carried out at room temperature using a Jobin-Yvon-64000 micro-Raman system in the backscattering geometry using the 488 nm line of an Ar+ laser for excitation. We used an optical objective of
100⫻magnification, which gives an average laser spot size of 1 m. Magnetic measurements were performed using a superconducting quantum interference device magnetometer.
III. RESULTS AND DISCUSSION
Figure 1 shows the XRD results for the whole set of samples. The observed peaks correspond to those expected for polycrystalline wurtzite ZnO and present relative narrow line-widths. The results reveal a high crystalline quality for all samples. No indication of additional phases were ob-served within the detection limit of the measurement. The lattice parameters obtained from the XRD measurements are presented in Fig. 2. There is no significant change in the wurtzite cell lattice parameters as the Co concentration is increased. This result indicates that the ionic radii共r兲 of the Co atoms incorporated in the material should be very close to the ionic radii of Zn in the ZnO matrix. For the ZnO wurtzite structure, the Zn is tetrahedrally coordinated with valence 2+ and r= 0.60 Å. The closest ionic radii assumed
by Co is when it is also tetrahedrally coordinated with va-lence 2+共r= 0.58 Å兲.16 Therefore, our results indicates that Co replaces Zn ions in the ZnO matrix with a 2+ valence.
Figure 3 shows representative SEM images of our samples that reveal intergrannular fractured surfaces. A series of full scans over large areas confirm the absence of Co-rich nanoclusters. Furthemore, SEM results show no evidence of secondary phases in our samples. The effective Co concen-trations of the Zn1−xCoxO samples 共xE兲 were also measured
by EDS analysis and are presented in Fig.3共f兲as a function of the nominal Co concentration 共xN兲. We observe a good agreement between the measured and the nominal concentra-tion values.
XANES spectra give information on the coordination symmetry and the valence of ions incorporated in a solid. FIG. 1. 共Color online兲XRD diffratograms of polycrystalline samples. All
peaks belong to the hexagonal structure of wurtzite ZnO.
FIG. 2. 共Color online兲Lattice parameters a共a兲, c共b兲of the wurtzite struc-ture, c/a ratio共c兲, and unit-cell volume共d兲determined from the XRD for Zn1−xCoxO samples.
50mm 50mm
(a)
(a) (b)(b)
50mm 50mm
50mm 50mm
(c) (c)
50mm 50mm
(d) (d)
50mm 50mm
(e) (e)
(f)
FIG. 3. Representative scanning electron micrographs of Zn1−xCoxO
samples with共a兲x= 0.04,共b兲0.08,共c兲0.12,共d兲0.15, and共e兲0.21共mag.: 350⫻兲.共f兲Effective Co concentrations obtained from EDS共xE兲vs nominal concentration共xN兲.
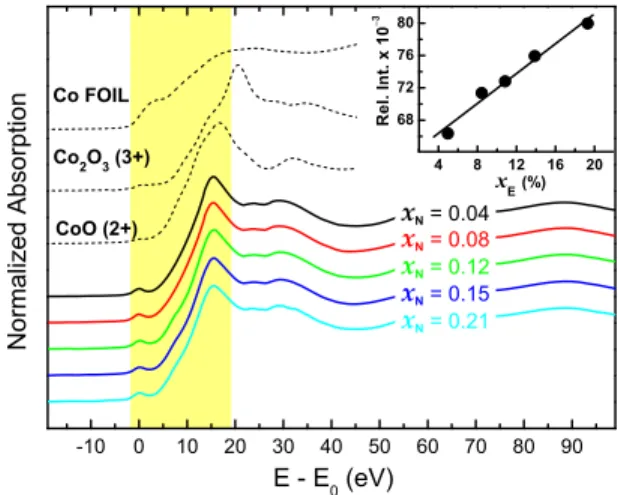
The energy of the absorption edge shifts according to the valence of the absorbing ion, since the binding energy of bound electrons rises as the valence increases. Also, the shape of the absorption edge depends on the unfilled local density of states and the coordination symmetry of the ab-sorbing element. Figure 4 shows the XANES spectra ob-tained for our Zn1−xCoxO samples at room temperature. All
spectra have similar features, except by small differences on the relative peak intensities at the pre-edge regions. This is an indication that there is no significant structural distortion around the Co ions for different doping levels. Generally, the intensity of the pre-edge peak increases linearly with the sub-stitutional incorporation of a TM in a solid due to a progres-sive participation of the 3dorbital in the bonding.17The inset of Fig.4presents in fact the linear evolution of the intensity of the pre-edge peak relative to the white line maximum. The valence of the dopant ions can be analyzed by comparing their resulting edge structure from those obtained from ref-erence samples. In Fig. 4 we also present XANES spectra from Co ions from oxides with various metal oxidation states. The comparison with the spectra from our samples indicate that Co assumes predominantly the 2+ oxidation state, which corroborates the XRD results.
Raman spectra from our set of samples are shown in Fig. 5. The Zn1−xCoxO samples, as well as ZnO, presents the
wurtzite structure for small Co compositions.18In this case, only theA1,E1, andE2modes are Raman active,19where the
A1andE1are optical phonon modes关transversal optical and longitudinal optical 共LO兲兴 and the E2 is a nonpolar mode. The frequency of ZnO modes are well established in the literature.19,20We observe a series of narrow peaks centered at 330, 380, 410, and 438 cm−1, that are assigned to the
E2共H兲−E2共L兲,A1共TO兲,E1共TO兲, andE2共H兲ZnO modes, re-spectively. The peaks are observed for all samples but they are better defined for the sample with the lowest Co content
共x= 0.04兲. We also observe a broad band at
⬃500– 600 cm−1. The broad band seems to enclose several peaks, whereas the main ones are centered at ⬃550 and 580 cm−1.The peak at ⬃580 cm−1 can be attributed to the
overlap of the LO phonons of theA1andE1modes19but the peak at⬃550 cm−1cannot be attributed to a ZnO mode; it is indexed as an additional mode 共AM兲. In pure ZnO, the
A1共LO兲andE1共LO兲modes are usually very weak due to the destructive interference between the deformation and the Frölich potentials.21Nevertheless, crystalline disorder due to impurities or defects can result in the amplification of those modes due to the breaking out of the k-conservation law, giving rise to a broad band that reflects the density of phonon states around those frequencies, as observed for Ga im-planted ZnO.22In our samples, Co atoms are also expected to introduce disorder in the crystal, which can explain the emer-gence of the broad band. For the sample with x= 0.04, the
E2共H兲 peak is dominant, but as the Co composition in-creases, the broad band becomes the dominant feature of the Raman spectra, the inset of Fig. 5 shows that the relative intensity of LO and AM mode with respect to the E2共H兲
intensity increases almost linearly with effective Co concen-tration. Similar features around 500– 600 cm−1 were
ob-served in several works on TM,18,23–25 Ce,26 and Sb-doped ZnO samples.27 In those works the main peak of the broad band is, however, at ⬃530 cm−1, and it has been attributed
to complexes involving intrinsic defects, such as oxygen va-cancies共VO兲and Zn interstitials共Zni兲. Based on correlations
between different samples procedures and their magnetic properties it has been proposed that this peak is related to the origin of RTFM on ZnO.28Recently, theoretical calculations have been presented supporting that the RTFM on Co-doped ZnO systems can be a critical combination of doping and broadening of Co-related states due to the presence of intrin-sic defects, resulting in an increase in the carrier-mediated interaction between magnetic ions.29
A significant result from the Raman data is the complete absence of peaks related to segregated secondary phases, as it has been observed for some Co-doped ZnO samples. The most common secondary phases are CoO and Co3O4.30,31
CoO presents two sharp lines at 484 共weak兲 and 691 共strong兲 cm−1associated to theAgandEgmodes and a
broad band between 500 to 600 cm−1 attributed to anhar-monic interactions.32 Co3O4 present five sharp lines at 197
FIG. 4.共Color online兲Experimental Co K-edge XANES spectra for the five Zn1−xCoxO samples共E0= 7708.8 eV兲. Spectra of metallic Co, rocksalt CoO 共valence 2+兲and Co2O3共valence 3+兲are also shown for comparison. The
inset shows the relative intensity of pre-edge peak as a function of effective Co concentration.
FIG. 5. 共Color online兲Raman scattering spectra of Zn1−xCoxO samples at
共F2g兲, 485 共Eg兲, 523 共F2g兲, 624 共F2g兲, and 693 共A1g兲.32 For both materials the peak at ⬃690 cm−1 is always the
stron-gest one. We do not observe, however, any indication of a peak at this frequency for our set of samples. Therefore, Raman scattering results corroborates with the x-ray diffrac-tion results, as it indicates that secondary phase segregadiffrac-tion is absent in our samples.
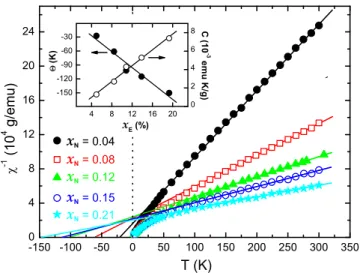
We now proceed with the magnetic characterization. The inverse of the magnetic susceptibility as a function of the temperature is presented in Fig.6for our set of samples. The diamagnetic background of the ZnO matrix 共−0.33
⫻10−6 emu/g兲 was determined by measuring an undoped ZnO sample used as a reference and then subtracting this value from the raw data. The results show a clear linear behavior for high temperatures. At this range, the magnetic susceptibility can be described using the paramagnetic Curie–Weiss equation
= C共x兲
T−⌰共x兲, 共1兲
where both the Curie–Weiss temperature, ⌰, and the Curie constant per gram,C, should present a linear dependence on the TM concentration x: ⌰=⌰0·x and C=C0·x. The con-stantsC0 and⌰0 are defined as
C0=Ngeff
2
B 2S共S+ 1兲
3kB 共2兲
and
⌰0=
2zS共S+ 1兲J1
3kB , 共3兲
whereNis the number of cations per gram,geffis the effec-tive gyromagnetic factor of the Co ion,S= 3/2 is the spin for
Co2+, B is the Bohr magneton,z is the number of nearest neighbors共z= 12 in the wurtzite structure兲,J1is the effective exchange integral constant, and kB is the Boltzmann con-stant. The values of⌰ andCobtained by fitting the results from Fig.6using Eq.共1兲are presented in the inset of Fig.6
as a function of the effective Co concentration. All samples present negatives⌰, indicating an antiferromagnetic interac-tion between Co ions. We can also determine the parameters
C0and⌰0by fitting the results presented in the inset of Fig. 6. Finally, using the known values for the other constants involved in C0 and⌰0 in the Eqs.共2兲and共3兲, we can
esti-mate the two main magnetic parameters for Co2+:geff= 2.72 andJ1/kB= −28.5⫾3.6 K. These values are in good agree-ment with other results obtained for Co2+in ZnO matrix30,33 and for other Co-doped II-VI semiconductor.34
The observed absence of magnetic order in our samples is consistent with the absence of the main structures attrib-uted to RTFM: Co-rich nanocrystals, segregated secondary magnetic phases and the specific defect related to the origin of the Raman band at⬃530 cm−1. Even though our samples
present some concentration of defects, as demonstrated by the emergence of the Raman band at⬃500– 600 cm−1, they
are not efficient on enhancing the interaction between Co atoms, and therefore, do not promote RTFM.
IV. CONCLUSION
In summary, we have presented a complete microstruc-ture and magnetic analysis of bulk Zn1−xCoxO samples
ppared through solid-state reaction method. Microstructure re-sults confirm that Co ions substitute Zn ions in the wurtzite ZnO structure with a valence 2+. There is no indication of Co-rich nanoclusters or segregated secondary phases in the samples. Magnetization measurements reveal a Curie–Weiss behavior of the susceptibility at high temperatures character-ized by the antiferromagnetic interaction between Co ions. Our results demonstrate that the substitution of Zn by the Co dopant in the wurtzite ZnO structure is not a sufficient con-dition to achieve RTFM, which seems to be critically depen-dent on the presence of some specific defects that alter the carrier distribution and affect the carrier-mediated interaction between the magnetic ions.
ACKNOWLEDGMENTS
Support from agencies FAPEMIG, CNPq and FAPESP are gratefully acknowledged. The authors also acknowledge LNLS for the XANES measurements and Professor Dr. G. M. da Costa of the Universidade Federal de Ouro Preto for the XRD measurements.
1G. Schmidt, D. Ferrand, L. W. Molenkamp, A. T. Filip, and B. J. van
Wees,Phys. Rev. B62, R4790共2000兲.
2R. Fiederling, M. Keim, G. Reuscher, W. Ossau, G. Schmidt, A. Waag,
and L. W. Molenkamp,Nature402, 787共1999兲.
3Y. Ohno, D. K. Young, B. Beschoten, F. Matsukura, H. Ohno, and D. D.
Awschalom,Nature402, 790共1999兲.
4D. Chiba, M. Yamanouchi, F. Matsukura, and H. Ohno,Science301, 943 共2003兲.
5H. Ohno, D. Chiba, F. Matsukura, T. Omiya, E. Abe, T. Dietl, Y. Ohno,
and K. Ohtani,Nature408, 944共2000兲.
6T. Dietl, H. Hono, F. Matsukura, J. Cibert, and D. Ferrand,Science287,
1019共2000兲.
7C. Liu, F. Yun, and H. Morkoç,J. Mater. Sci.: Mater. Electron.16, 555 共2005兲.
8F. Pan, C. Song, X. Liu, Y. Yang, and F. Zeng,Mater. Sci. Eng. R.62, 1 共2008兲.
9P. Sharma, A. Gupta, K. Rao, F. J. Owes, R. Sharma, R. Ahuja, J. M. O.
Guillen, B. Johansson, and G. A. Gehring,Nature Mater.2, 673共2003兲. FIG. 6.共Color online兲Inverse susceptibility vs. temperature for Zn1−xCoxO
samples. The best fit of the high temperature data to Curie–Weiss law is shown as solid lines. The inset shows⌰共full symbols兲andC共open sym-bols兲as a function ofxE, solid lines are linear fit to the data.
10G. Lawes, A. S. Risbud, A. P. Ramirez, and R. Seshadri,Phys. Rev. B71,
045201共2005兲.
11J. M. D. Coey, M. Venkatesan, and C. B. Fitzgerald,Nature Mater.4, 173 共2005兲.
12D. C. Kundaliya, S. B. Ogale, S. E. Lofland, S. Dhar, C. J. Metting, S. R.
Shinde, Z. Ma, B. Varughese, K. Ramanujachary, L. Salamanca-Riba, and T. Venkatesan,Nature Mater.3, 709共2004兲.
13T. Dietl, T. Andrearczyk, A. Lipinska, M. Kiecana, M. Tay, and Y. Wu,
Phys. Rev. B76, 155312共2007兲.
14R. Seshadri,Curr. Opin. Solid State Mater. Sci.9, 1共2005兲. 15J. Rodriguez-Carvajal,Physica B192, 55共1993兲.
16R. D. Shannon,Acta Crystallogr., Sect. A: Cryst. Phys., Diffr., Theor. Gen.
Crystallogr.A32, 751共1976兲.
17W. F. Pong, R. A. Mayanovic, K. T. Wu, P. K. Tseng, B. A. Bunker, A.
Hiraya, and M. Watanabe,Phys. Rev. B50, 7371共1994兲.
18T.-L. Phan, R. Vincent, D. Cherns, N. H. Dan, and S.-C. Yu,Appl. Phys.
Lett.93, 082110共2008兲.
19T. C. Damen, S. P. S. Porto, and B. Tell,Phys. Rev.142, 570共1966兲. 20R. Cuscó, E. Alarcón-Lladó, J. Ibáñez, L. Artús, J. Jiménez, B. Wang, and
M. J. Callahan,Phys. Rev. B75, 165202共2007兲.
21R. H. Callender, S. S. Sussman, M. Selders, and R. K. Chang,Phys. Rev.
B7, 3788共1973兲.
22F. Reuss, C. Kirchner, T. Gruber, R. Kling, S. Maschek, W. Limmer, A.
Waag, and P. Ziemann,J. Appl. Phys.95, 3385共2004兲.
23X. Wang, J. Xu, X. Yu, K. Xue, J. Yu, and X. Zhao,Appl. Phys. Lett.91,
031908共2007兲.
24J. B. Wang, G. J. Huang, X. L. Zhong, L. Z. Sun, Y. C. Zhou, and E. H.
Liu,Appl. Phys. Lett.88, 252502共2006兲.
25Z. Wang, D. Geng, W. Hu, and Z. Zhang,J. Appl. Phys.105, 123902 共2009兲.
26B. Cheng, Y. Xiao, G. Wu, and L. Zhang, Appl. Phys. Lett. 84, 416 共2004兲.
27C. Bundesmann, N. Ashkenov, M. Schubert, D. Spemann, T. Butz, E. M.
Kaidashev, M. Lorenz, and M. Grundmann,Appl. Phys. Lett. 83, 1974
共2003兲.
28V. K. Sharma and G. D. Varma,J. Appl. Phys.102, 056105共2007兲. 29E.-Z. Liu, Y. He, and J. Z. Jiang,Appl. Phys. Lett.93, 132506共2008兲. 30S. Kolesnik, B. Dabrowski, and J. Mais,J. Appl. Phys.95, 2582共2004兲. 31A. Quesada, M. A. García, M. Andrés, A. Hernando, J. F. Fernández, A.
C. Caballero, M. S. Martín-González, and F. Briones,J. Appl. Phys.100, 113909共2006兲.
32D. Gallant, M. Pezolet, and S. Simard,J. Phys. Chem. B110, 6871共2006兲. 33S.-J. Han, B. Lee, J.-S. Ku, Y. Kim, and Y. Jeong,J. Magn. Magn. Mater.
272, 2008共2004兲.
34H. Alawadhi, I. Miotkowski, A. Lewicki, A. K. Ramdas, S. Miotkowska,