Implications of selection in common bean lines in contrasting
environments concerning nitrogen levels
Isabela Volpi Furtini1*, Magno Antonio Patto Ramalho2 and Ângela de Fátima Barbosa Abreu3
Received 23 August 2013 Accepted 08 May 2014
Abstract – Grain productivities of 100 bean lines were evaluated in the presence and absence of nitrogen fertilizer in order to identify those with high nitrogen use efficiency (NUE) and to determine the correlated response observed in a stressed environment following selection in a non-stressed environment. The genetic and phenotypic characteristics of the lines, as well as the response index to applied nitrogen, were determined. The average grain productivities at both locations were 39.5% higher in the presence of nitrogen fertilizer, with 8.3 kg of grain being produced per kg of nitrogen applied. NUE varied greatly between lines. Lines BP-16, CVII-85-11, BP-24, Ouro Negro and MA-IV-15-203 were the most efficient and responsive. The results showed that it is possible to select bean lines in stressed and non-stressed environments. It was inferred that common bean lines for environments with low nitrogen availability should preferably be selected under nitrogen stress.
Key words: Phaseolus vulgaris L., nitrogen use efficiency, correlated response, selection gain.
Crop Breeding and Applied Biotechnology 14: 160-165, 2014 Brazilian Society of Plant Breeding. Printed in Brazil
ARTICLE
http://dx.doi.org/10.1590/1984-70332014v14n3a24
1 Embrapa Arroz e Feijão, Rodovia MT 222, km 2,5, CP 343, 78.550-970, Sinop, MT, Brazil. *E-mail: [email protected]
2 Universidade Federal de Lavras (UFLA), Departamento de Biologia, Setor de Genética e Melhoramento de Plantas, CP 3037, 37.200-000, Lavras, MG, Brazil 3 Embrapa Arroz e Feijão, Current address UFLA
INTRODUCTION
A range of different types of cropping systems are available for the cultivation of the common bean (Phaseolus
vulgaris L.). Although many small farmers do not apply
modern technologies in crop production, a number of large rural businesses make use of novel irrigation methods, advanced agricultural techniques and modern implements. Although P. vulgaris is a member of the family Leguminosae (Fabaceae), the quantities of nitrogen fixed is insufficient for the daily requirements of the plant (Cassini and Franco 2006, Brito et al. 2011). Thus, nitrogen supplementation to common bean cultures is essential in achieving increased yield. However, while many farmers employ fertilizers in crop production, others choose to cultivate their crops in the absence of such supplements. Considering that fertilizers represent a significant proportion of production costs (Skalsky et al. 2008), that the continuous use of N can cause environmental impacts (Hirel et al. 2007) and since farmers plant similar cultivars regardless of the cropping system used, it is important to develop bean lines that offer high nitrogen use efficiency.
The nitrogen use efficiency (NUE) of a crop may be
genetic correlation between oat lines cultivated under low and high nitrogen availability, and the responses in both environments were similar. The use of alternate direct and indirect selection procedures has been proposed by some researchers (Van Ginkel et al. 2001).
According to Falconer and Mackay (1996), indirect selection is advantageous when the square root of the heritability value (hx) obtained under non-stressed conditions is larger than that obtained under stressed conditions (hy), or when the genetic correlation between the two conditions (rxy) is strong (hy < rxyhx).
The most studies on nitrogen use efficiency (NUE) was performed with grasses, especially with crops of corn (Banziger et al. 1997, Presterl et al. 2003, Emede and Alika 2012, Weber et al. 2012) and wheat (Le Gouis et al. 2000, Brancourt-Hulmel et al. 2005). As the vast majority of common bean breeding programs in Brazil evaluates the progeny and/or lines in the presence of N, it is important to check whether the selection made under favorable conditions to culture, is also effective for stress conditions. Since information relating to these aspects of the culture of bean is limited, the objective of the present study was to identify bean lines presenting high NUE and to determine the correlated response of grain productivity observed in a stressed environment following selection in a non-stressed environment.
MATERIAL AND METHODS
The experiments were conducted in Lavras (lat 21º 14’ S, long 44º 59’ W and alt 919 m asl), on a Dystroferric Red Oxisol and in Ijaci (lat 21º 10’ S, long 44º 55’ W and alt 805 m asl), on a Red-Yellow Ultisol, both in the State of Minas Gerais, Brazil. The chemical characteristics of the soils at these two locations are presented in Table 1.
A total of 100 bean lines derived from the germplasm bank of the Universidade Federal de Lavras (UFLA) were evaluated. Most of these lines were of the carioca type and some were commercial cultivars originating from breeding programmes conducted at UFLA over the last 30 years. Each bean line was submitted to two separate, but adjacent, experiments. In the first experiment no nitrogen fertilizer was applied, whilst in the second experiment 100 kg ha-1 of nitrogen [(NH4)2SO4] was applied (1/3 before sowing, 1/3 20 days after sowing and 1/3 27 days after sowing). In both experiments, 80 kg ha-1 of phosphorus (P
2O5)and potassium (K2O) were applied to the soil before sowing.
A 10 x 10 triple lattice design was employed. The plots consisted of two lines (2 m each) spaced at 50 cm from each
other and seeds were sown at a density of 15 seeds/m. The grain yields (kg ha-1) of the bean lines were determined for each nitrogen level and location, and the results were subjected to individual and combined analysis of variance involving the two N levels per location as well as all levels and locations, according to the model:
yljtu= μ + pl+ nt+ au + qj(tu) + (pn)lt + (pa)lu + (na)tu + (pna)ltu + eljtu
in which yljtu is the observation relating to line l, repetition
j, nitrogen level t, location u; μ is the average value; pl is the effect of line l (l = 1, 2, 3,..., 100); nt is the effect of nitrogen level t (t = 1, 2); au is the effect of location u (u = 1, 2); qj(tu) is the effect of repetition j, nitrogen level t, location
u; (pn)lt is the effect of the interaction between bean lines x nitrogen level; (pa)lu is the effect of the interaction between bean lines x locations; (na)tu is the effect of the interaction between nitrogen levels x locations; (pna)ltu is the effect of the interaction between bean lines x nitrogen levels x locations; and eljtu is the experimental error eljtu
∩
N (0, σ2).Nitrogen level (presence or absence), location and the average value were considered as fixed effects, whilst the others were considered to be random effects. The genetic and phenotypic parameters were estimated from the expected mean square values according to the literature (Falconer and Mackay 1996, Bernardo 2002). The errors associated with the expected gains from selection by the expression proposed by Bridges et al. (1991) were also calculated.
The response index to applied nitrogen (α) was calculated from average grain yield values (kg.ha-1) using the equation (Thung 1990):
αi = (Nli – N2i)/Q
in which αi is the response index of line i; Nli is the average grain yield of line i in the presence of nitrogen fertilizer; N2i is the average grain yield of line i in the absence of
nitrogen fertilizer; and Q is the amount of nitrogen applied (100 kg ha-1).
RESULTS AND DISCUSSION
was good, when considering the experiments separately. The differences between the N levels were significant (P <0.01). In the mean of the two locations, the experiments with N fertilization produced 39% more than where no N was applied, ie, there was a mean grain yield increase of 826 kg ha-1, which corresponds to 8.3 kg grain per kg N applied (Table 2). Nitrogen is the most required nutrient by most crops, including common bean. For this reason, N response to nitrogen in common bean can frequently be observed (Furtini et al. 2006, Binotti et al. 2007). In a total of 80 field experiments with common bean, the response to N application was positive in 64% of the trials (Vieira 2006). However, a comparison of the response between experiments is difficult because it depends on a number of factors, related to the environment as well as the genotype.
The interaction locations x N levels was also significant (P<0.01). The response to N application was most significant in Ijaci, where grain yield increased by 11.1 kg grain per kg N (Table 2). The conditions of soil fertility at the experimental locations, although close to each other, were somewhat different (Table 1). It was therefore not surprising, that the response of the lines differed between locations.
For this kind of experiments the existence of genetic variability in the lines for the trait is essential. The differences between lines were significant in all experiments (P<0.01). The lines tested had been bred in the last 30 years in the UFLA improvement program as well as in other breeding programs in Brazil. Differences in yield, as in fact observed, had therefore been expected.
Table 1. Chemical analysis of soil sampled from the layer 0 - 20 cm in the experimental areas in Lavras and Ijaci1
Characteristics Lavras Ijaci
Values2 Evaluation2 Values2 Evaluation 2
pH (water) 5.1 Regular acidity 5.2 Regular acidity
P (mg dm-3) 13.6 Good 24.9 Very good
K (mg dm-3) 70 Regular 108 Good
Ca2+ (cmol c dm
-3) 0.8 Low 1.3 Regular
Mg2+ (cmol c dm
-3) 0.3 Low 0.4 Low
Al3+ (cmol c dm
-3) 0.6 Regular 0.3 Low
H + Al (cmolc dm-3) 5.6 Good 4.5 Regular
Total bases (cmolc dm-3) 1.3 Low 2.0 Regular
Effective CEC(cmolc.dm
-3)3/ 1.9 Low 2.3 Low
CEC at pH 7.0 (cmolc.dm-3)3/ 6.9 Regular 6.5 Regular
Base saturation (%) 18.6 Low 30.6 Low
Aluminium saturation (%) 32 Regular 13 Very low
Organic matter (dag kg-1) 2.2 Regular 1.9 Low
Residual P (mg L-1) 12.2 Good 20.5 Very good
Zn (mg dm-3) 3.8 Very good 5.0 Very good
B (mg dm-3) 0.4 Regular 0.3 Low
S (mg dm-3) 59.4 Very good 0.3 Very good
1 Chemical analyses were performed at the Departamento de Ciência do Solo, UFLA, Lavras, MG, Brazil, according to the methodology described by Empresa Brasileira
de Pesquisa Agropecuária (1997).
2 The values were interpreted following Alvarez et al. (1999). 3 Cation exchange capacity.
Table 2. Mean grain yield (kg ha-1), relation between the yield with and without N application and N response index (α) at the evaluation locations
Locations Mean grain yield With N/ Without N α
With N Without N
Lavras 2529 1991 1.27 5.4
Ijaci 3301 2187 1.51 11.1
The genetic variability between lines was also shown by the estimates of genetic variance (σ2
G) in the lines (Table 3). In all environments (locations and N levels), σ2
G differed from zero (P <0.05).
The variability between lines can also be confirmed by the estimates of heritability (h2). In all experiments, the lower limit of the confidence interval (CI) of the h2 estimates was positive. It was also inferred that the h2 estimates were similar under most conditions (Table 3).
It was often reported that h2 estimates are lower in stressed environments due to the lower accuracy under such experimental conditions (Banziger et al. 1997, Ceccarelli et al. 1998, Brancourt-Humel et al. 2005, Emede and Alika 2012). However, it was observed that the h2 estimates were similar in conditions with and without N stress (Table 2). Similar results were reported by Presterl et al. (2003). It can therefore be inferred, in principle, that the conditions for success with selection do not depend on the presence or absence of stress.
Estimates of the expected gains with selection (GS) were established for 10% of the best lines, at each N level. It appears that the estimates of GS were significant (Table 4), both with or without N application. It follows therefore that the success can be high, regardless of whether selection is performed with or without N stress.
It is questionable whether indirect selection under high N would result in gains for performance under low N. The correlated response to indirect selection only exceeds
direct trait selection, if the square root of h2, under N-stress conditions (hy) is lower than the product of genetic correlation of line performance in both conditions by the square root of heritability (hx) between lines in the presence of N (rxyhx) (Falconer and Mackay 1996). In this study, the hy estimates always exceeded the product rxyhx. Under this condition, the estimates of correlated response by the selection in the presence of N and the response to environmental stress were all lower than in direct selection (Table 3). These results are similar to those reported by Banziger et al. (1997), Brancourt-Hulmel et al. (2005), Mandal et al. (2010) and Weber et al. (2012). These authors observed that if the goal is the selection of cultivars for N-poor environments, the selection must be performedunder N stress to maximize the gain with selection.
The estimates of genetic correlation of line performance in environments with or without N application (rG) were intermediate at both locations (Table 4). The estimates of correlated response (RCy/x) by selection in the environment with N application was relatively high (Table 3). The relationship between RCy/x and the gain with direct selection in the stressed environment (GSy) showed that the highest and lowest estimates of the gain with indirect selection accounted for 62% and 46% of the gain with direct selection, respectively.
Although the correlated response to indirect selection was lower than to direct selection, it was significant (Table 4). Some lines that performed well in stressed as well as unstressed environments could therefore be identified. Based
Table 3. Heritability estimates (h2), genetic variance (σ 2
G), variance of the interaction lines x N levels (σ
2
GN), ratio between σ 2GN and σ 2G and genetic
correlation (rG) between the performance of lines with and without N fertilization, at the evaluation locations
Locations h2 (%) σ 2
G
σ 2 GN
σ 2 GN
/
σ 2 Gr G
With N Without N With N Without N
Lavras 34
(5,53)1 (39,70)58 (1294.87, 2266.73)1679.69 (3865.52, 6766.78)5014.32 (1096.53, 1919.53)1422.41 0.74 0.6
Ijaci 52
(31,66)
49 (27,64)
3406.19 (2625.82, 4596.63)
1482.94 (1143.19, 2001.22)
1498.32 (1155.05, 2021.97)
1.58 0.6
Mean 43 54 2542.94 3248.63 1460.37 1.16 0.6
1 Values in brackets indicate the estimates of the lower and upper limits of the confidence intervals, at 5% probability.
Table 4. Estimates of the expected selection gains with (GSx) and without (GSy) N application, the errors related to GS, the correlated response (RCy/x) in the environment without N (y) by selection in the environment with N (x) and relation between RCy/x and GSy, at the evaluation locations
With N (x) Without N (y)
Location GSx Error GSy Error RCy/x RCy/x/GSy
kg ha-1 --%-- kg ha-1 kg ha-1 --%-- kg ha-1
--%--Lavras 209.50 8.29 85.15 472.45 27.73 90.60 10.94 0.46
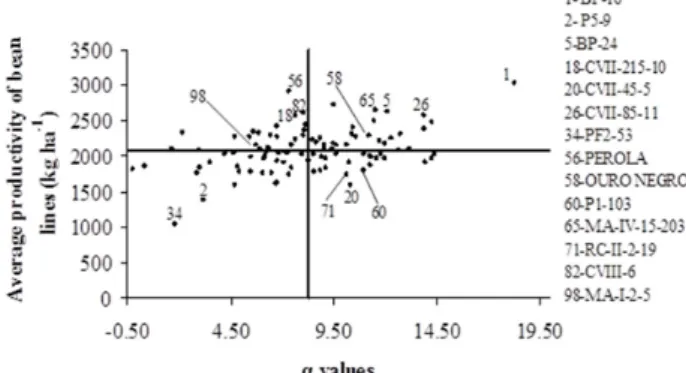
on estimates of the response index to N application associated with line yields in the nitrogen-stressed environment, the lines were grouped into four categories, according to Blair (1993), namely:
Inefficient and non-responsive (INR): lines that produced less than the overall mean of the N- stressed experiments and had a α below the overall mean of the indexes; Inefficient and responsive (IR): lines that produced less than the overall mean of the N- stressed experiments, but α exceeded the overall mean of the indexes; Efficient and non-responsive (ENR): lines that produced more than the overall mean of the N- stressed experiments and had a α below the index mean; Efficient and responsive (ER): lines that produced more than the overall mean of N-stressed experiments and had a α above the general index mean.
The lines were distributed in 29% INR, 23% IR, 21% ENR and 27% ER (Figure 1). The mean grain yield of the lines PF2-53 and P5-9, classified as INR, was low and did not respond to N fertilization. The lines CVII-45-5, P1-103 and RC-II-2-19 however, classified as IR, responded to N application, but had low mean grain yields. The lines BP-16, CVII-85-11, BP-24, Ouro Negro, and MA-IV-15-203 performed best in the category ER. The performance of the lines Pérola, CVIII-6, CVII-215-10 and MA-I-2.5 was also interesting, since they produced high grain yields in the environment under N stress, although they responded poorly to N fertilization (Figure 1).
The performance of Ouro Negro and MA-I-2.5, in response to N, has been described elsewhere (Furtini et al. 2006). Firstly, it can be inferred that these lines make better use of available soil N than the others. Possibly these lines also have greater efficiency in biological nitrogen fixation with native soil strains, since the seeds were not inoculated. For the line Ouro Negro line this last aspect has already been reported in the literature (Franco 1995).
ACKNOWLEDGEMENTS
The authors thank the Conselho Nacional de Desenvolvimento Científico e Tecnológico (CNPq) for a scholarship granted and FAPEMIG for funding the research project.
Figure 1. Response index to nitrogen (α) and mean grain yield of lines without N fertilization.
Implicações da seleção no feijoeiro efetuada em ambientes contrastantes em
níveis de nitrogênio
Resumo – A produtividade de grãos de 100 linhagens de feijoeiro foi avaliada na presença e ausência de fertilizante nitrogenado visando identificar aquelas com maior eficiência no uso de nitrogênio (EUN) e estimar a resposta correlacionada em ambientes sob baixa disponibilidade de nitrogênio, pela seleção efetuada sem o estresse do nutriente. Estimaram-se os índices de resposta à aplicação de nitrogênio e os parâmetros genéticos e fenotípicos. Na média dos locais, a produtividade de grãos obtida com N foi 39,5% acima da obtida sem N, correspondendo a 8,3 kg de grãos por kg de N aplicado. A EUN variou entre as linhagens. As linhagens BP-16, CVII-85-11, BP-24, Ouro Negro e MA-IV-15-203 foram as mais eficientes e responsivas. É possível obter sucesso com a seleção em ambientes com e sem estresse de nitrogênio, contudo a seleção de linhagens para ambientes sob baixa disponibilidade de nitrogênio deve ser realizada preferencialmente nesta condição.
Palavras-chave: Phaseolus vulgaris L., eficiência na utilização de nitrogênio, resposta correlacionada, ganho com a seleção. REFERENCES
Alvarez VVH, Novais RF, Barros NF, Cantarutti RB and Lopes AS (1999) Interpretação dos resultados das análises de solos. In. Ribeiro AC,
Guimarães PTG and AlvarezVH (ed.) Recomendações para uso
de corretivos e fertilizantes em Minas Gerais: 5ª Aproximação. Comissão de Fertilidade do Solo do Estado de Minas Gerais (CFSEMG), Viçosa, p. 25-32.
Anbessa Y, Juskiw P, Good A, Nyachiro J and Helm J (2010) Selection
efficiency across environments in improvement of barley yield for
moderately low nitrogen environments. Crop Science 50: 451-457.
Atlin GN and Frey KJ (1989) Predicting the relative effectiveness of direct versus indirect selection for oat yield in three types of stress environments. Euphytica 44: 137-142.
Banziger M, Betrán FJ and Lafitte HR (1997) Efficiency of high-nitrogen
selection environments for improving maize for low-nitrogen target
environments. Crop Science 37: 1103-1109.
Bernardo R (2002) Breeding for quantitative traits in plants. Stemma
Press, Woodbury, 368p.
S (2007) Manejo do solo e da adubação nitrogenada na cultura de feijão de inverno e irrigado. Bragantia 66: 121-129.
Blair GJ (1993) Nutrient efficiency – what to we really mean. In Randall
PJ, Delhaize E, Richard RA and Munns R (eds) Genetic aspects of plant mineral nutrition. Kluwer Academic, Dordrecht, p. 205-213.
Brancourt-Hulmel M, Heumez E, Pluchard P, Beghin D, Depatureaux C, Giraud A and Le Gouis J (2005) Indirect versus direct selection of winter wheat for low-input or high-input levels. Crop Science 45: 1427-1431.
Bridges WC, Knapp SJ and Cornelius PL (1991) Standard errors and
confidence interval estimators for expected selection response. Crop Science 31: 253-255.
Brito MMP, Muraoka T and Silva EC (2011) Contribuição da fixação biológica de nitrogênio, fertilizante nitrogenado e nitrogênio do solo
no desenvolvimento de feijão e caupi. Bragantia 70: 206-215.
Cassini STA and Franco MC (2006) Fixação biológica de nitrogênio:
microbiologia, fatores ambientais e genéticos. In Vieira C, Paula
Junior TJ and Borém A (eds) Feijão. 2nd ed., Editora UFV, Viçosa,
p. 251-312.
Ceccarelli S, Grando S and Impiglia A (1998) Choice of selection strategy in breeding barley for stress environments. Euphytica 103: 307-318.
Emede TO and Alika JE (2012) Variation in agronomic characters among
high and low nitrogen S2 maize (Zea mays L) lines grown in high and
low nitrogen environments. Maydica 57: 139-146.
Empresa Brasileira de Pesquisa Agropecuária (1997) Manual de métodos
de análise de solo. 2nd ed., Centro Nacional de Pesquisa de Solos
(EMBRAPA), Rio de Janeiro, 212p.
Falconer DS and Mackay TFC (1996) Introduction to quantitative
genetics. 4th ed., Pearson Education, Longman, 463p.
Franco AA (1995) Nutrição nitrogenada na cultura do feijoeiro. Informações Agronômicas 70: 4-5.
Furtini IV, Ramalho MAP, Abreu AFB and Furtini Neto AE (2006) Resposta diferencial de linhagens de feijoeiro ao nitrogênio. Ciência Rural 36: 1696-1700.
Gallais A, Coque M and Bertin P (2008) Response to selection of a maize population for adaptation to high or low nitrogen fertilization. Maydica 53: 21-28.
Hirel B, Le Gouis J, Ney B and Gallais A (2007) The challenge of
improving nitrogen use efficiency in crop plants: towards a more
central role for genetic variability and quantitative genetics within integrated approaches. Journal of Experimental Botany 58: 2369-2387.
Le Gouis J, Béghin D, Heumez E and Pluchard P (2000) Genetic
differences for nitrogen uptake and nitrogen utilization efficiencies
in winter wheat. European Journal of Agronomy 12: 163-173.
Lopes AS and Guilherme LRG (2000) Uso eficiente de fertilizantes e
corretivos agrícolas: aspectos agronômicos. ANDA, São Paulo, 72p.
Mandal NP, Sinha PK, Variar M, Shukla VD, Perraju P, Mehta A, Pathak AR, Dwivedi JL, Rathi SPS, Bhandarkar S, Singh BN, Singh DN, Panda S, Mishra NC, Singh YV, Pandya R, Singh MK, Sanger RBS, Bhatt JC, Sharma RK, Raman A, Kumar A and Atlin G (2010) Implications of genotype×input interactions in breeding superior genotypes for favorable and unfavorable rainfed upland environments. Field Crops Research 118: 135-144.
Presterl T, Seitz G, Landbeck M, Thiemt W, Schmidt W and Geiger
HH (2003) Improving nitrogen use efficiency in European maize:
estimation of quantitative genetic parameters. Crop Science 43: 1259-1265.
Skalsky SA, Jacobs JJ, Menkhaus DJ and Stevens WB (2008) Impact of
fuel and nitrogen prices on profitability of selected crops: a case of
study. Agronomy Journal 100: 1161-1165.
Thung M (1990) Phosphorus: a limiting nutrient in bean (Phaseolus
vulgaris L.) production in Latin America and field screening for
efficiency and response. In El Bassam N, Dambroth M and Loughman
BC (eds.)Genetic aspects of plant mineral nutrition. Kluwer,
Dordrecht, p. 501-521.
Van Ginkel M, Ortiz-Monasterio I, Trethowan R and Hernandez E (2001) Methodology for selecting segregating populations for improved
nitrogen-use efficiency in bread wheat. Euphytica 119: 223-230.
Vieira C (2006) Adubação mineral e calagem. In Vieira C, Paula Junior TJ
and Borém A (eds.) Feijão. 2nd ed., Editora UFV, Viçosa, p. 115-142.
Weber VS, Melchinger AE, Magorokosho C, Makumbi D, Bänziger M
and Gary Atlin N (2012) Efficiency of managed-stress screening of