Printed in Brazil - ©2006 Sociedade Brasileira de Química 0103 - 5053 $6.00+0.00
Article
*e-mail: [email protected]
Kinetics of Antimony(V) Reduction by L-Cysteine. Pharmacological Implications and
Application to the Determination of Antimony in Pentavalent Antimonial Drugs
Fernanda B. de Oliveira,a Dante A. Schettini,a Cláudio S. Ferreira,b Breno Rates,a
Olguita G. F. Rocha,c Frédéric Frézarda and Cynthia Demicheli*,b
a
Departamento de Fisiologia e Biofísica, ICB and bDepartamento de Química, ICEx
Universidade Federal de Minas Gerais, Av. Antônio Carlos 6627, 31270-901 Belo Horizonte - MG, Brazil
c
Laboratório de Análise de Traces Metálicos, Fundação Centro Tecnológico de Minas Gerais, Belo Horizonte - MG, Brazil
Como o antimônio é a espécies ativa no medicamento leishmanicida, antimoniato de meglumina (AM), o conhecimento da concentração exata do metal é crítico para o seu uso experimental e clínico. Por outro lado, o papel da cisteína no metabolismo dos antimoniais deve ser esclarecido. No presente trabalho, a reação de redução do SbV pela cisteína foi
caracterizada cineticamente. As ordens de reação com relação ao Sb e à cisteína foram iguais a 1,0 e 3,3, respectivamente. A constante de velocidade da reação de redução foi dependente do pH. Essa reação foi usada para reduzir o SbV no AM, para subseqüente determinação fotométrica
do SbIII com o cromóforo vermelho de bromopirogalol. Eficiências de redução de 100% foram
alcançadas em pH 3. Soluções apresentando concentrações de Sb baixas como 0,5 mmol L-1
foram dosadas com sucesso. O método foi também aplicado para a determinação de Sb em formulações lipossomais do AM.
Since antimony is the active species in the antileishmanial drug meglumine antimoniate (MA), the knowledge of the exact metal concentration is critical for its experimental and clinical use. On the other hand, the involvement of thiols, such as cysteine (Cys), in the metabolism of this drug remains to be clarified. In the present work, the reduction reaction of SbV by Cys was
kinetically characterized. The reaction orders with respect to Sb and Cys were equal to 1.0 and 3.3, respectively. The rate constant for the reduction reaction was pH-dependent. This reaction was exploited to effectively reduce SbV in MA, for the subsequent photometric determination
of SbIII using the chromogen bromopyrogallol red. Reduction efficiencies of 100% were achieved
at pH 3. Solutions with Sb concentration as low as 0.5 mmol L-1 were successfully assayed. The
method was also applied to the determination of Sb in liposomal formulations of MA.
Keywords: cysteine, antimony, reduction, liposomes, meglumine antimoniate
Introduction
Pentavalent antimonials, including meglumine antimoniate, are the drugs of choice for the treatment of leishmaniases.1 Since antimony is the active species, the
knowledge of the exact metal concentration in commercial formulations is critical for its clinical use. Indeed, its concentration was found to vary from one lot to another in commercial formulations.2 Moreover, the determination
of SbV concentration in the liposomal formulations of
antimonial drugs is essential for their pharmacological evaluations and therapeutic use.3
The most common analytical methods used to determine Sb are atomic absorption spectroscopy, plasma atomic emission spectrometry, ICP mass spectrometry, neutron activation analysis and voltammetry.2 However,
these methods usually require the pre-digestion of the organic material present in the sample, are time-consuming and are neither cost-effective nor appropriate for routine analysis.
A photometric assay has been also proposed for SbV.2,4
As a first step, SbV was reduced to SbIII by iodide in acidic
ascorbic acid and the resulting solution was neutralized with sodium hydroxide. Finally, SbIII concentration was
determined photometrically, exploiting the specific interaction of SbIII with the chromogen bromopyrogallol
red (BPR) and the fact that the absorbance of BPR at 560 nm decreases proportionally to the amount of SbIII in the
analyte solution, as a consequence of the formation of the 1:1 BPR-SbIII complex.4 However, the quantification
of SbV using this procedure was complicated by the fact
that its reduction by iodide was only 72% efficient. In previous studies, L-cysteine (Cys) was proposed as a pre-reducing agent of SbV for its determination by
flow-injection hydride generation atomic-absorption spectrometry and atomic-emission spectrometry.5
Since Cys is the predominant thiolin the lysosomes of mammalian cells,6 in which
Leishmania parasites reside,7 and SbIII is much more active than SbV against the
parasite,8 the pharmacological relevance of the reduction
reaction of SbV by Cys has been investigated.9 It was
suggested that this reaction may contribute to the conversion of SbV to SbIII, previously demonstrated in cell
extracts, the vertebrate host and the parasite.10 The
reduction of SbV by Cys was found to occur at 37°C at
both pH 5 and pH 7, but was favored at acidic pH.9 Other
physiologically-relevant thiols were also evaluated:9
glutathione, which is the main thiol in the cytosol of
mammalian cells;11 and the glutathione-spermine
conjugate, trypanothione (T(SH)2), which is the
predominant thiol within the parasite.12 Strikingly, the
initial rates of reduction of SbV were much greater in the
presence of Cys and T(SH)2 than in the presence of glutathione.9 These data supported the hypothesis that SbV
is reduced in vivo by T(SH)2 within Leishmania parasites and by Cys within the acidic compartments of mammalian cells where the parasites reside. On the other hand, recent studies have also suggested the participation of enzymes in the process of reduction of SbV to SbIII 13 and the possible
role of SbV-ribonucleoside complexes in the mode of action
of pentavalent antimonials.14
Further progress towards the elucidation of the pharmacological importance of Cys, as well as the use of this thiol in analytical procedures, depends on the full kinetic characterization of this reaction.
In the present work, the reaction of SbV with Cys
was kinetically characterized. As a consequence, a new insight into the pharmacological role of Cys was achieved and the photometric assay for SbV was improved. Cys
was also chosen for this assay because of its low cost and the relatively high rate of reduction promoted by this thiol. The resulting method was successfully applied to the determination of Sb in meglumine antimoniate
and in liposomal formulations of the antimonial compound.
Experimental
Photometric determination of SbIII and influence of Cys
concentration
The procedure used to determine SbIII was described
in detail previously.9 It is based on the specific interaction
of SbIII with BPR. The absorbance of BPR at 560 nm
decreases proportionally to the amount of SbIII in the
analyte solution, as a consequence of the formation of the 1:1 BPR-SbIII complex. Briefly, 0.5 mL of analyte
solution was prepared from 0.1 mL of 0.1 mol L-1
phosphate, 0.01 mL of 5% (m/v) tartrate, 0.05 mL of 350 µmol L-1 BPR solution in 1:1 water/ethanol (v/v) and
0.34 mL of water. The pH was then adjusted to 6.8 using sodium hydroxide. The absorbance was registered, at 560 nm before (Ao) and after (Am) adding 5 µL of the
sample to be analyzed, so as to obtain a SbIII concentration
in the range of 1.2×10⁻⁶ to 25×10-6 mol L-1. For each
experiment, a calibration curve was established, in the presence of the same amount of Cys as that used in the reduction step. Potassium antimony(III) tartrate was used as the source of SbIII and the change in BPR absorbance
(Ao-Am) was plotted as a function of SbIII concentration.
Materials
N-methyl-D-glucamine (NMG, 99%), SbCl5 (99%),
bromopyrogallol red (BPR, 70%) and potassium antimony(III) tartrate (>99%) were obtained from Aldrich Chemical Co. (Milwaukee, Wis) and potassium hexahydroxo-antimoniate (KSb(OH)6, >99%) from Fluka Chemie GmbH (Switzerland). Cholesterol (CHOL), dicetylphosphate (DCP), L-cysteine (Cys, 98%) and Triton X-100 (>99%) were purchased from Sigma Co. (St. Louis, MO, USA). Distearoylphosphatidylcholine (DSPC) was obtained from Avanti Polar Lipids Inc. (Alabaster, AL, USA). An antimony standard (SbCl3 in 24% HCl, Titrisol®) was purchased from
MERCK (São Paulo, SP, Brazil). Double-distilled-deionized water was used throughout the experiments.
Preparation of meglumine antimoniate and of liposomal formulations
Meglumine antimoniate was synthesized, according to Demicheli et al.,15 from an equimolar mixture in water
water. After precipitation with acetone, the resulting product was dried. Meglumine antimoniate product contained 29% of Sb by weight, as determined by inductively coupled plasma optical emission spectrometry (ICP-OES) using a Perkin Elmer plasma emission spectrometer, model Optima 3000.
Liposomal formulations of meglumine antimoniate, DRVs and FDELs, were prepared from DSPC, CHOL and DCP (molar ratio of 5:4:1) in the absence or presence of sucrose, as described previously.3 The concentration of Sb
in the liposomal samples was determined by ICP-OES, after submission of the samples to digestion with concentrated nitric acid. Sb concentrations in the range of 8 to 16 g L-1
and Sb/lipid mass ratio in the range of 0.2 to 0.35 were found.
Determination of the linear range of the photometric assay and of the interference of Cys
The linear range and sensitivity of the method were evaluated through the linear regression of the (Ao-Am) vs.
[SbIII] data, in the concentration range of 1.2×10⁻⁶ to
25×10-6 mol L-1, and the determination of the linear
correlation coefficient and the slope of the curve. To determine the interference of Cys on these parameters, the thiol was introduced at varying concentrations (0, 0.8, 2 or 4 mmol L-1) in the analyte BPR solution.
Determination of the partial orders of the reduction reaction
Two different experiments were performed. In the first one, Sb concentration was kept constant at 1 mmol L-1 and
Cys concentration was varied form 5 to 12.5 mmol L-1. In
the second one, Cys concentration was kept constant at 10 mmol L-1 and Sb concentration was varied from 0.5 to 2
mmol L-1. All aqueous solutions contained 0.1 mol L-1 KCl,
0.02 mol L-1 phosphate and 0.02 mol L-1 acetate. The pH
was adjusted to 5. Reaction was run at 37°C and under argon to prevent the oxidation of Cys by oxygen. The initial rate of SbV reduction (
Vi) was calculated from the
concentration of SbIII determined photometrically, as
described above, in the initial conditions of reaction. The reaction was considered in initial conditions when the amount of reduced Sb did not exceed 10% of the total SbIII
amount at equilibrium. The reaction partial orders, n and m, with respect to Cys and Sb respectively, were determined from the following equations:
Vi = kap[Cys]n[Sb]m (1)
ln(Vi ) = n ln([Cys]) + m ln([Sb]) + ln(kap) (2)
where [Cys] = initial molar concentration of Cys, [Sb] = initial molar concentration of Sb and kap = apparent rate
constant for reduction.
Determination of the activation energy of the reduction reaction
The reaction medium contained 5 mmol L-1 Cys and 1
mmol L-1 Sb, in the presence of 0.1 mol L-1 KCl, 0.02 mol
L-1 phosphate and 0.02 mol L-1 acetate. The pH was
adjusted to 5 and solutions were kept under argon. The reaction was run at 15°C, 25°C, 37°C or 47°C. The apparent rate constants for reduction (kap) were calculated using equation (1) and the concentration of SbIII,
determined photometrically, as described above, in the initial conditions of reaction. The activation enthalpy (ΔH*) was obtained from the slope of the plot of arrhenius
equation:
ln(kap) = ln[ω exp(ΔS */
R)] – ΔH*/
RT (3)
Influence of pH on the rate of SbV reduction
The reaction medium contained 5 mmol L-1 Cys, 1
mmol L-1 Sb, 0.1 mol L-1 KCl, 0.02 mol L-1 phosphate and
0.02 mol L-1 acetate. Different samples were prepared with
a pH value varying from 3 to 6 (with intervals of 0.25 pH units) and the reaction was run under argon. The apparent rate constant for reduction (kap) was calculated using equation (1) and the concentration of SbIII determined
photometrically, as described above, in the initial conditions of reaction.
Efficiency of SbV reduction in meglumine antimoniate:
influence of pH, time of reaction, SbV concentration and
temperature
To evaluate the influence of pH, temperature, time of reaction and SbV concentration on the efficiency of SbV
reduction in meglumine antimoniate, aqueous solutions containing meglumine antimoniate and 0.05 mol L-1 Cys
were freshly prepared and reaction was run under argon. In the study of the influence of pH and time of reaction, meglumine antimoniate was added at 0.5 mmol L-1 of Sb,
pH was adjusted at 5, 6 or 7 and the reaction was run at 50°C for 1 or 3 h.
In the study of the influence of SbV concentration and
temperature, meglumine antimoniate was added at a Sb concentration varying from 0.05 to 0.5 mmol L-1, pH was
Each sample was prepared in quadruplicates. The concentration of SbIII was then determined using the BPR
photometric assay, as described above.
Procedure for determination of SbV in samples of liposomal
meglumine antimoniate
Samples of liposomal meglumine antimoniate, prepared as described above at a lipid concentration typically in the range of 30 to 65 g L-1, were diluted
five-fold in water and then mixed with an equal volume of 20% (m/v) Triton X-100 aqueous solution. The mixture was then incubated for 1 h at 60°C to induce the release of the encapsulated antimonial compound. 50 µL of the resulting suspension was then mixed with 250 µL of a freshly-prepared Cys solution at pH 3 and 200 µL of water. The resulting solution was then immediately incubated for 1 h at 60°C under argon to promote the reduction of SbV into SbIII. The concentration of SbIII was then
determined photometrically, as described above. To determine the possible interference of the liposome matrix (selectivity) and the precision of the method, samples with varying concentrations of Sb (from Titrisol® standard) (0.04, 0.08, 0.12, 0.16 and 0.2 mol L-1)
were prepared in water, in the absence or presence of empty liposomes made from DSPC, CHOL and DCP (molar ratio of 5:4:1) at a final lipid concentration of 65 g L-1. For each Sb concentration, seven identical samples
were prepared independently. These samples were treated as described above (treatment with Triton X-100 and Cys). After measurement of the sample-induced change in BPR absorbance, (Ao-Am) was plotted as a function of
the final Sb concentration in the cuvet. The Snedecor F Test was then applied to compare the variances, followed by the student t Test to compare the means. The mean (M) and standard deviation (D) of the measurements obtained for each Sb concentration were used to calculate the relative standard deviation (%RSD) for a confidence level of 95%, as follows:%RSD = (D/M)×100.
To evaluate the accuracy of the method, samples with Sb concentrations (from Titrisol® standard) of 0.02 (sample
1), 0.08 (sample 2) and 0.16 mol L-1 (sample 3) were
prepared in the presence of empty liposomes made from DSPC, CHOL and DCP (molar ratio of 5:4:1) at a final lipid concentration of 65 g L-1. To samples 1, 2 and 3, known
amounts of Sb were added at the final concentrations of 0.02, 0.04 and 0.04 mol L-1, respectively. These samples
were then treated as described above (treatment with Triton X-100 and Cys) and SbIII concentration was determined
photometrically using the BPR assay. The recovery was then calculated from%R = (C1-C2/C3), where C1 = Sb
concentration determined in the sample after addition,
C2 = Sb concentration determined in the sample before
addition; C3 = concentration of added Sb. In addition to the study of Sb recovery, the values of SbV concentration
determined for four different liposomal preparations of meglumine antimoniate were compared to those obtained by the classical ICP-OES method.
Results and Discussion
Kinetics of SbV reduction by Cys
Previous studies have established that Cys can promote the reduction of SbV into SbIII in potassium antimoniate
and meglumine antimoniate,5,9 however, this reaction was
not fully characterized kinetically.
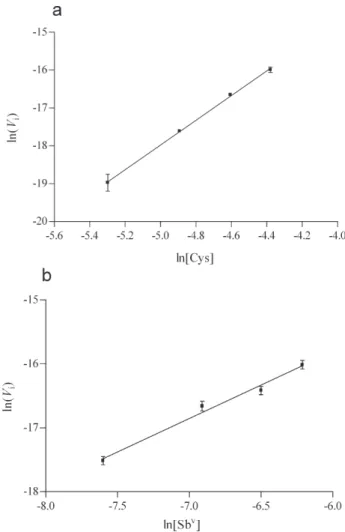
As a first step, experiments were performed to determine the partial orders of the reaction with respect to Cys and antimoniate (Sb). Figures 1a and 1b show the plots of ln(Vi) as a function of ln([Cys]) and ln([Sb]),
respectively. Linear relationships were obtained and the slopes gave the partial orders of reaction: m = 3.26 ± 0.16 and n = 1.05 ± 0.07. Therefore, the following relation could be established: Vi = kap[Cys]3.3 [Sb]
Using these data, the apparent rate constant for SbV
reduction (kap) could also be estimated at pH 5 and 37 °C:
kap = 256 ± 37 (mol L-1)-3.3 s-1
It is noteworthy that it is the first time that this reaction is fully characterized kinetically. The demonstration of the strong dependence of the rate of reaction upon the concentration of Cys is an important contribution of the present study. The high order of the reaction in Cys, together with the fact that it is fractional, indicates that we are not dealing with a simple single-step mechanism. Although two Cys molecules would theoretically be sufficient to promote the reduction of SbV into SbIII, the
high order of reaction in Cys suggests that at least one additional Cys molecule is involved in the composition of the rate-limiting transition state.
Determination of kap at different temperatures and the
plot of arrhenius equation (equation 3), as shown in Figure 2, allowed for the calculation of the activation enthalpy for SbV reduction: ΔH* = 42.4 ± 2.8 kJ mol-1.
As the rate of SbV reduction was found previously to
depend on pH,9k
ap was determined at different pH values
in the range of 3 to 6. Figure 3 displays the plot of kap as a
function of pH. kap was found to be maximum at a pH value of about 4.7 and kap was significantly lower at both lower and higher values of pH.
of about 4.0 and 5.5, that can be attributed to changes in the mechanism of the reaction. Two downward bends were also observed at pH values of about 4.6 and 5.1, that may be explained, either by a titration of the reagents and/or by a change in rate-limiting step.16 Titration of the reagents
Cys and SbV is unlikely, especially if we consider their
reported pKa values. The carboxylic acid group of Cys has a pKa in range of 1.7 to 2.1. Moreover, Sb(OH)5 and Sb(OH)6– are considered to be the predominant acid and
base SbV species in aqueous solution,17 which are in
equilibrium according to the following reaction (pKa{[Sb(OH)6–]/[Sb(OH)
5]}≈2.7):
Sb(OH)5+ H2O ↔ Sb(OH)6– + H+ (4)
Since Cys is considered as the predominant thiolin
the lysosomes of mammalian cells6 and Leishmania
parasites reside inside the phagolysosomes of macro-phages,7 Cys may be involved in the in vivo reduction of
SbV into more toxic SbIII 10 and, ultimately, in the
mechanism of action of pentavalent antimonial drugs againt leishmaniasis.
The pH value of the lysosomes, in the range of 4.5 to 5, is expected to favour the reduction reaction. However, whether or not such a reaction effectively takes place, depends on the local concentrations of Sb and Cys and on the state of complexation of Sb. As reported previously,
the complexation of SbV with N-methyl-D-glucamine
slows down the reduction reaction by a 7-fold factor.9 On
the other hand, a recent study aimed to the speciation of Sb in the serum and urine of humans submitted to chemotherapy with meglumine antimoniate indicated a partial dissociation of the drug into antimoniate.18 The
concentration of Sb in the lysosomes of infected cells during antimonial chemotherapy is not known precisely. However, considering that the Sb concentration achieved in the serum of humans during treatment is about 0.15 mmol L-1 and that mammalian cells exposed to meglumine
Figure 1. Plots of the logarithm of the initial rate of reduction of SbV by
Cys (Vi/mol L-1 s-1) determined at pH 5 and 37 °C as a function of the
logarithm of Cys molar concentration (a) ([Sb] = 1 mmol L-1) and Sb
molar concentration (b) ([Cys] = 10 mmol L-1). SbV was presented as
potassium antimoniate. Data are shown as means ± SD (n = 3).
Figure 2. Arrhenius plot obtained with the initial rate of SbV reduction
(Vi/mol L-1 s-1). [Sb] = 1 mmol L-1, [Cys] = 5 mmol L-1, pH 5. Data are
shown as means ± SD (n = 3).
Figure 3. Influence of pH on the apparent rate constant (kap/(mol L-1)-3.3 s-1)
for the reduction of SbV by Cys at 37 °C. SbV was presented as potassium
antimoniate exhibit comparable intra- and extra-cellular concentrations at equilibrium,19,20 one can assume a Sb
concentration of 0.15 mmol L-1 inside the lysosomes. Since
the effective concentration of SbIII against
Leishmania
parasites is about 0.04 mmol L-1 and macrophages retain
Sb for at least three days after a short exposure to the antimonial drug,8,21 one can infer that a minimum rate of
reduction of 0.013 mmol L-1 day-1 would be necessary to
achieve efficacy against the intracellular parasite. Using equation (1) and kap = 256 (mol L
-1)-3.3 s-1 (37 °C, pH 5)
and assuming a SbV concentration of 0.15 mmol L-1, one
can estimate that the intralysosomal Cys concentration should be at least 3 mmol L-1 to reach such a rate of
reduction.
Values for the concentration of Cys inside lysosomes have not been published so far, however, considering the millimolar range of glutathione concentration in the cytosol (2 to 10 mmol L-1),11 one would expect a similar
range of Cys concentration.
Application of the reduction reaction of SbV by Cys to the
determination of Sb in meglumine antimoniate
In the present study, a novel procedure has been evaluated for the determination of SbV in meglumine
antimoniate. Two steps are proposed. As a first step, SbV
is reduced to SbIII by Cys. As a second step, SbIII
concen-tration is determined exploiting the specific interaction of SbIII with BPR.4
Since Cys and SbIII are expected to form a Sb(Cys) 3
complex,22 competition should take place between Cys
and BPR for the binding of SbIII. This led us to evaluate
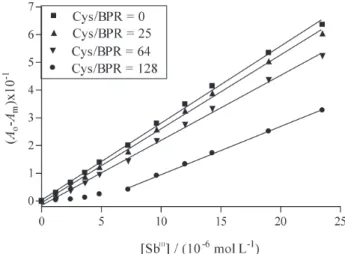
the influence of different concentrations of Cys on the linearity and sensitivity of the photometric assay. Figure 4 shows the plot of the change in BPR absorbance as a function of SbIII concentration, in the presence of varying
concentrations of Cys. In the absence of Cys, the method was linear in the range of 1.2×10⁻⁶ to 23.5×10⁻⁶ mol L-1
with a correlation coefficient of 0.9989. When the Cys/BPR molar ratio was increased from 0 to 64, the slope of the curve suffered a slight diminution but its linearity remained almost unaffected (correlation coefficient > 0.9984). On the other hand, at the Cys/BPR molar ratio of 128, the slope decreased sharply and the linearity was maintained only in the range of 7.25×10⁻⁶ to 23.5×10⁻⁶
mol L-1. According to these data, Cys/BPR molar ratio
less or equal than 64 should be used in the photometric assay and the calibration curve should be established in the presence of the same amount of Cys as that used in the reduction step.
One of the objectives of the present study was to identify some experimental conditions leading to 100% of SbV reduction in meglumine antimoniate. A previous
study has established that the initial rate of SbV reduction
was about 7-fold lower with meglumine antimoniate than with potassium antimoniate,9 most probably because Sb
atom is less accessible in its complexed form.15
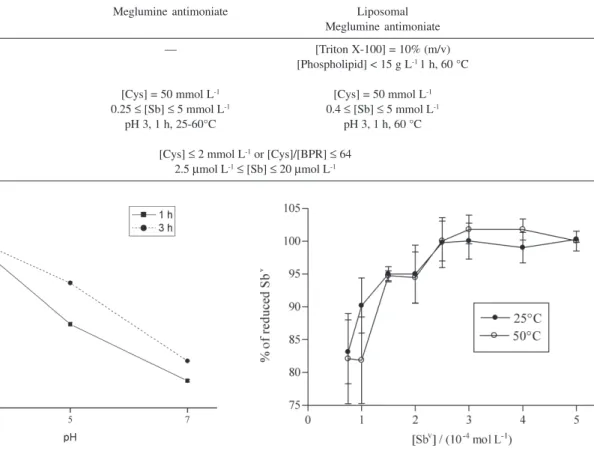
Figure 5 shows the efficiency of SbV reduction
achieved, when meglumine antimoniate at 0.5 mmol L-1
was incubated with 50 mmol L-1 Cys at 50 °C. Strikingly,
the reduction of SbV reached an efficiency of 100% only
at pH 3. At pH 5 and 7, even after 3 h of incubation, the reduction of SbV was not complete. These results indicate
a strong pH-dependence of the reaction and suggest a higher reactivity of Sb(OH)5, the acid form of SbV.
The range of Sb concentration in the sample which leads to 100% of SbV reduction is also an important data
to be determined. Figure 6 shows the efficiency of SbV
reduction achieved, when meglumine antimoniate was incubated with 50 mmol L-1 of Cys at Sb concentration
varying from 0.05 to 0.5 mmol L-1 (pH 3, 25 °C or 50 °C).
It can be observed that the efficiency of SbV reduction
was less than 100% at Sb concentration below 0.25 mmol L-1. This concentration limit was identical at 25 °C and
50 °C. From this data, specific experimental conditions allowing for the determination of SbV in meglumine
antimoniate could be defined. Those are summarised in Table 1.
It is noteworthy that these conditions may also apply to the determination of Sb in other SbV complexes, even
though the method would still require validation.
When compared to the method proposed by Rath et
al.,2 our method presents the significant advantages of
Figure 4. Influence of the Cys/BPR ratio on the calibration curve, repre-senting the change in BPR absorbance at 560 nm (A0-Am) as a function of SbIII concentration. Linear curve fits were performed using all the data in
being simpler (two-step vs. three-step method) and offering a 100% reduction efficiency of SbV.
Application of the reduction reaction of SbV by Cys to the
determination of Sb in liposomal formulations of meglumine antimoniate
We described previously the preparation of liposomal formulations of meglumine antimoniate, DRVs and FDELs, from DSPC, CHOL and DCP (molar ratio of 5:4:1) in the absence or presence of sucrose, which have been evaluated in dogs for their pharmacokinetics.3
Because of the high concentration of lipid in these liposomal preparations and the high phase transition temperature of the phospholipids used in their composition, the acid digestion of these samples is a time-consuming process. Therefore, there is a great need for simpler and more rapid procedures.
The experimental conditions proposed for the determination of SbV in liposomal meglumine antimoniate
are also summarised in Table 1. When compared to the assay used for meglumine antimoniate, an additional step
was included to permit the release of encapsulated meglumine antimoniate from liposomes. The temperature of 60 °C is important to allow for the action of Triton X-100, which is more effective above the phase transition temperature of DSPC (55 °C).
In order to investigate the possible interference of the liposome matrix (method selectivity), samples with varying concentration of Sb were prepared in water in the absence or presence of empty liposomes at a final lipid concentration of 65 g L-1. These samples were treated with
Triton X-100 and Cys and were then evaluated by the BPR photometric assay. Figure 7 compares the changes in absorbance as a function of Sb concentration, in the absence and in the presence of the liposome matrix. Application of the F Test indicated that the variances did not differ significantly. Application of the student t Test showed that the means were not significantly different, demonstrating the absence of interference of the liposome matrix in the photometric assay.
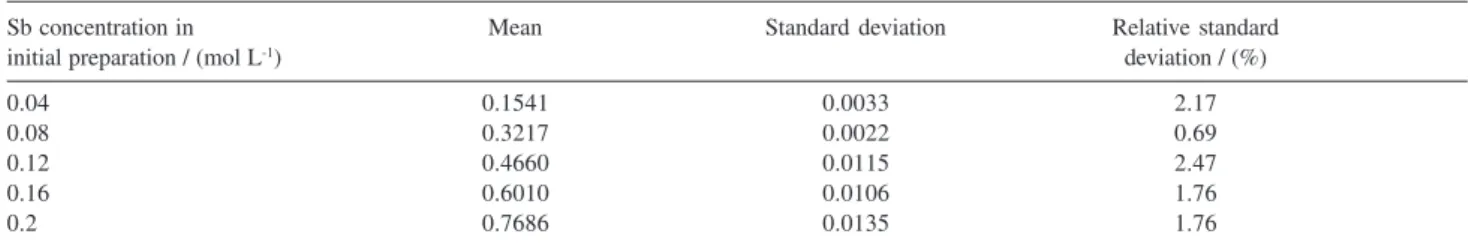
The precision of the method was also evaluated, by calculating the relative standard deviations for measurements performed with samples containing Table 1. Recommended experimental conditions for the determination of SbV in meglumine antimoniate, either free or encapsulated in liposomes
Meglumine antimoniate Liposomal Meglumine antimoniate
Step 1. Lysis of liposomes — [Triton X-100] = 10% (m/v)
[Phospholipid] < 15 g L-1 1 h, 60 °C
Step 2. Reduction of SbV [Cys] = 50 mmol L-1 [Cys] = 50 mmol L-1
into SbIII by Cys 0.25 ≤ [Sb] ≤ 5 mmol L-1 0.4 ≤ [Sb] ≤ 5 mmol L-1
pH 3, 1 h, 25-60°C pH 3, 1 h, 60 °C
Step 3. Photometric [Cys] ≤ 2 mmol L-1 or [Cys]/[BPR] ≤ 64
determination of SbIII 2.5 µmol L-1≤ [Sb] ≤ 20 µmol L-1
Figure 5. Influence of pH and reaction time on the reduction efficiency of SbV in the form of meglumine antimoniate by Cys. [Cys] = 50 mmol L-1,
[Sb] = 0.5 mmol L-1, pH = 5. Data are shown as means ± SD (n = 4).
Figure 6. Influence of SbV concentration and temperature on the
reduc-tion efficiency of SbV in the form of meglumine antimoniate by Cys.
[Cys] = 50 mmol L-1, time of reaction = 1 h. Data are shown as means
liposomes (65 g L-1) and at different levels of Sb
concentration. Table 2 shows the results of analysis of the method precision. Since the relative standard deviations were inferior to 5%, the method was considered precise. The accuracy of the method was also satisfactory, since the recoveries of known amounts of SbV after addition to
Sb-containing samples and empty liposomes varied between 96 and 104%. The Sb concentration values determined by the proposed method (Triton/Cys/BPR) and
by conventional ICP-OES after nitric acid digestion of the samples are shown in Table 3 for comparison. Importantly, the concentrations of Sb determined by the two methods were found to be very similar for the four different liposomal formulations.
Conclusions
In the present work, the reduction reaction of SbV by
Cys was kinetically characterized. The reaction orders with respect to Sb and Cys were equal to 1.0 and 3.3, respectively. The rate constant for the reaction of reduction was found to be pH-dependent. According to these data, the pharmacological relevance of this reaction depends on the Cys concentration in the macrophage lysosomes. It is suggested that Cys should have a concentration of at least 3 mmol L-1 in order to exert a significant
phar-macological role. This reaction was exploited to effectively reduce SbV in meglumine antimoniate, for the
subsequent photometric determination of SbIII using BPR.
In the case of meglumine antimoniate, reduction efficiencies of 100% were achieved at pH 3 in the presence of 50 mmol L-1 Cys and Sb concentrations higher than
0.25 mmol L-1. The photometric assay was linear in the
range of 1.2×10⁻⁶ to 23.5×10⁻⁶ mol L-1 of SbIII with a
correlation coefficient higher than 0.998, even in the presence of Cys at a Cys/BPR ratio of 64. Aqueous solutions with Sb concentration as low as 0.5 mmol L-1
were successfully assayed. The method was also applied to the determination of Sb in liposomal formulations of Table 3. Sb concentration values determined in different liposomal formulations of meglumine antimoniatea by the Triton/Cys/BPR method and with the
conventional ICP-OES method
Liposomal preparation [Sb]/(mol L-1) [Sb]/(mol L-1)
by Triton/Cys/BPR method by ICP-OES method
DRV liposomes 0.097 0.095
DRV liposomes, prepared in the presence of sucrose 0.076 0.072
FDEL liposomes 0.067 0.069
FDEL liposomes, prepared in the presence of sucrose 0.069 0.071
aLiposomal formulations were made from DSPC, CHOL and DCP (molar ratio of 5:4:1) in the absence or presence of sucrose, as described previously.3
Table 2. Precision of the Triton/Cys/BPR method for the determination of SbV concentration in liposomal formulations of meglumine antimoniatea
Sb concentration in Mean Standard deviation Relative standard
initial preparation / (mol L-1) deviation / (%)
0.04 0.1541 0.0033 2.17
0.08 0.3217 0.0022 0.69
0.12 0.4660 0.0115 2.47
0.16 0.6010 0.0106 1.76
0.2 0.7686 0.0135 1.76
aThe mean and standard deviation refer to the measurement (A
o-Am) of 7 preparations, prepared independently, containing empty liposomes at 65 g L -1 of
lipid; Relative standard deviation (%) = (standard deviation/mean)×100.
Figure 7. Change in BPR absorbance at 560 nm (A0-Am) as a function of the final Sb concentration. Samples with varying concentration of Sb (stan-dard, Titrisol®) (0.04, 0.08, 0.12, 0.16 and 0.2 mol L-1) were prepared in
water, in the absence or presence of empty liposomes made from DSPC, CHOL and DCP (molar ratio of 5:4:1) at a final lipid concentration of 65 g L-1. For each Sb concentration, seven identical samples were prepared
meglumine antimoniate. In this case, an additional step was introduced before the reduction step, consisting of the Triton X-100-induced release of encapsulated Sb. The latter method showed good precision and accuracy.
Acknowledgments
This work was supported by the Brazilian agencies, CNPq, MCT, CAPES and FAPEMIG. F.B.O., B.R., D.A.S. and C.S.F. were recipients of studentships from CNPq.
References
1. Berman, J. D.; Clin. Infect. Dis.1997, 24, 684.
2. Rath, S.; Jardim, W. F.; Dórea, J. G.; Fresenius J. Anal. Chem. 1997, 358, 548.
3. Frézard, F.; Michalick, M. S. M.; Soares, C. F.; Demicheli, C.;
Braz. J. Med. Biol. Res.2000, 33,841; Schettini, D. A.; Costa Val, A. P.; Souza, L. F.; Demicheli, C.; Rocha, O. G. F.; Melo, M. N.; Michalick, M. S. M.; Frézard, F.; Braz. J. Med. Biol. Res. 2005, 38, 1879; Frezard, F.; Schettini, D. A.; Rocha, O. G. F.; Demicheli, C.; Quim. Nova2005, 28, 511; Schettini, D. A.; Ribeiro, R. R.; Demicheli, C.; Rocha, O. G. F.; Melo, M. N.; Michalick, M. S. M.; Frézard,F.; Int. J. Pharm. 2006, 315, 140. 4. Christopher, D. H.; West, T. S.; Talanta1966, 13, 507. 5. Welz, B.; Sucmanova, M.; Analyst1993, 118, 1417; Chen, H.
W.; Brindle, I. D.; Zheng, S. G.; Analyst1992, 117, 1603. 6. Gainey, D.; Short, S.; McCoy, K. L.; J. Cell. Physiol.1996,
168, 248.
7. Alexander, J.; Russell, D. G.; Adv. Parasitol.1992, 31, 175. 8. Roberts, W. L.; Berman, J. D.; Rainey, P. M.; Antimicrob. Agents
Chemother.1995, 39, 1234.
9. Frézard, F.; Demicheli, C.; Ferreira, C. S.; Costa, M. A. P.;
Antimicrob. Agents Chemother. 2001, 45, 913; Ferreira, C. S.; Martins, P. S.; Demicheli, C.; Brochu, C.; Ouellette, M.; Frézard, F.; BioMetals2003, 16, 441; Yan, S. C.; Li F.; Ding, K. Y.; Sun, H. Z.; J. Biol. Inorg. Chem. 2003, 8, 689.
10. Goodwin, L. C.; Page, J. E.; Biochem. J. 1943, 22, 236; Burguera, J. L.; Burguera, M.; Petit de Pena, Y.; Lugo, A.; Anez, N.; Trace Elem. Med. 1993, 10, 66; Shaked-Mishan, P.; Ulrich, N.; Ephros, M.; Zilberstein, D.; J. Biol. Chem. 2001, 276, 3971. 11. Meister, A.; J. Biol. Chem.1988, 263, 17205.
12. Fairlamb, A. H.; Cerami, A.; Annu. Rev. Microbiol. 1992, 46, 695. 13. Zhou, Y.; Messier, N.; Ouellette, M.; Rosen, B. P.; Mukhopadhyay, R.; J. Biol. Chem.2004, 279, 37445; Denton, H.; McGregor, J. C.; Coombs, G. H.; Biochem. J.2004, 381, 405.
14. Demicheli, C.; Frezard, F.; Lecouvey, M.; Garnier-Suillerot, A.; Biochim. Biophys. Acta2002, 1570, 192 ; Chai, Y.; Yan, S.; Wong, I. L. K.; Chow, L. M. C.; Sun, H.; J. Inorg. Biochem. 2005, 99, 2257; Demicheli, C.; Santos, L. S.; Ferreira, C. S.; Bouchemal, N.; Hantz, E.; Eberlin, M. N.; Frezard, F.; Inorg.
Chim. Acta2006, 359, 159; Hansen, H. R.; Pergantis, S. A.;
Anal. Bioanal. Chem.2006, 385, 821; Ferreira, C. S.; Pimenta, A. M. C., Demicheli, C., Frezard, F.; Biometals2006,19, 573. 15. Demicheli, C.; Ochoa, R.; Lula, I. S.; Gozzo, F. C.; Eberlin,
M.; Frézard F.; Applied Organomet. Chem. 2003, 17, 226. 16. Loudon, G. M.; J. Chem. Educ.1991, 68, 973.
17. Filella M.; May, P. M.; Geochim. Cosmochim. Acta2003, 67, 4013. 18. Miekeley, N.; Mortari, S. R.; Schubach, A. O.; Anal. Bioanal.
Chem.2002, 372, 495.
19. Chulay, J. D.; Fleckenstein, L.; Smith, D. H.; Trans. Roy. Soc.
Trop. Med. Hyg.1988, 82, 69.
20. Dzamitika, S. A.; Falcão, C. A. B.; de Oliveira, F. B.; Marbeuf, C.; Garnier-Suillerot, A.; Demicheli, C.; Rossi-Bergmann, B.; Frezard, F.; Chem. Biol. Int.2006, 160, 217.
21. Sereno, D.; Cavaleyra, M.; Zemzoumi, K.; Maquaire, S.; Ouaissi, A.; Lemesre, J. L.; Antimicrob. Agents Chemother. 1998, 42, 3097.
22. Sun, H. Z.; Yan, S. C.; Cheng, W. S.; Eur. J. Biochem. 2000,
267, 5450.
Received: June 9, 2006