Vol.56, n.4: pp. 673-678, July-August 2013
ISSN 1516-8913 Printed in Brazil BRAZILIAN ARCHIVES OF
BIOLOGY AND TECHNOLOGY A N I N T E R N A T I O N A L J O U R N A L
Influence of NaNO
3Concentration and Incident Light
Intensity on
Nannochloropsis oculata
Lipid Accumulation
Lara Regina Soccol Gris, Anderson de Campos Paim, Marcelo Farenzena, Jorge Otávio
Trierweiler
*Departamento de Engenharia Química; Universidade Federal do Rio Grande do Sul; Rua Engenheiro Luiz Englert, s/nº; 90040-040; Porto Alegre - RS - Brasil
ABSTRACT
This study aimed at evaluating the best conditions for lipid accumulation in the marine microalga Nannochloropsis oculata in an airlift photobioreactor. Experiments were carried out following a central composite design with the following variables: temperature (19 to 29°C), sodium nitrate concentration (NaNO3) in the culture medium (f/2)
(25 to 125 mg.L-1) and incident light intensity (49 to 140 µE.m-2s-1). The maximum lipid production was 132.4 mg.L-1 under the following conditions: 27°C, NaNO3 concentration 105 mg.L-1 and 122 µE.m-2.s-1, which was 30% of dry
weight of the biomass.
Key words:Nannochloropsis oculata, Airlift Photobioreactor, Central Composite Design, Lipid
*Author for correspondence: [email protected]
INTRODUCTION
The global demand for energy is expanding quickly and, according to the U.S. Energy Information Administration (2011), this expansion will continue over the next 25 years. Total global energy consumption will double by 2035, compared to 1990. Developing countries such as Brazil, Russia, China, and India have been highlighted as potentially high energy consumers. The development of new renewable energy sources is, thus, a significant option to ensure the safe growth of a nation, leading to fewer limitations in energy availability.
Among different sources of renewable energy, microalgae biofuels have emerged as a technically viable alternative, mainly due to their high efficiency as oil producers and given that, compared to oil crops, they require less fertile land and less water for their cultivation and their
production is possible on non-arable land. Furthermore, there is the appeal of CO2 bio-mitigation and wastewater treatment, since the nutrients for microalgae cultivation (especially nitrogen and phosphorus) may be obtained from the organic effluent from agri-food industries (Chisti 2007; Brennan and Owende 2010).
discussed the generation of biofuels from different
microalgae, which include Nannochloropsis
oculata - mainly because of its high growth rate and lipid content (Roncarati et al. 2004).
Several studies have been made on the effects of cultivation variables on N. oculata production. Flynn et al. (1993) studied the effect of carbon-nitrogen on algae growth; Converti et al. (2009) studied the effect of nitrogen and temperature on the growth and lipid content; Spolaore et al. (2006) studied the effects of pH, temperature, aeration rate, and incident light intensity; and Rodolfi et al. (2009) achieved a Nannochloropsis sp lipid content of around 60% under the conditions of nutrients limitations. The aim of this work was to study the effect of temperature, nitrogen, and incident light intensity on the growth and lipid content of N. oculata using a central composite design.
MATERIALS AND METHODS
Algal Strain and Inoculum Preparation
The strain of N. oculata was obtained from the Laboratory of the Ecology of Phytoplankton and Marine Microorganisms (Federal University of Rio Grande, Brazil). Cultures were maintained in an autoclaved f/2 culture medium using artificial seawater (marine salt Red Sea, salinity 33 ± 1 g.L -1
) and enriched with nutrients (Lourenço 2006). They were kept in 6L Erlenmeyer flasks (working volume 4L), with aeration (filtered air without CO2 enrichment, 0.25 VVM, i.e., 1L.min-1) in a refrigerated incubator. Incident light intensity was fixed at approximately 98 µE.m-2.s-1. The cells were maintained at a controlled temperature (25 ± 1°C) and photoperiod (12 h light/12 h dark). Every 10 days, the cultures were sub-cultured and re-inoculated into a fresh medium (1/10 dilution).
Experimental System and Experimental Design Experiments were conducted in batch mode with
12 rectangular internal loop airlift
photobioreactors (optical path 6 cm, height 35 cm and working volume 3.2 L). Heat transfer was carried out by pumping a controlled temperature water stream through stainless steel tubes (1/2″), located at the downcomer. Photoperiod was kept
constant (12 h light/12 h dark) and
photobioreactors were illuminated from one side (riser) by two fluorescent cool lamps (Universal Duramax Super Daylight 20W, Brazil). Incident light intensity was measured from the light-attached surface of the photobioreactor using a luximeter (Instrutherm LD-200, Brazil).
Agitation was provided by continuous air injection (without additional CO2) into two porous stones placed at the bottom of the riser of each system. An aeration rate of 800 mL.min-1 (0.25 vvm) was measured with gas flow meters (rotameters) (Dwyer Instruments, Inc). The overall volumetric mass transfer coefficient of the liquid phase (kLa) was determined using the Dynamic method (Chisti 1989) at 19°C and an aeration rate of 750 ml.min-1, where kLa was equal to 28.62 h
-1 .
A central composite design (divided into two blocks) was performed to evaluate the effects of temperature, sodium nitrate concentration in the f/2 medium and incident light intensity on final biomass and lipid concentration. Each batch of photoautotrophic cultivation was carried out for 11 days. Independent variable values are shown in Table 1. The central values were chosen on the basis of data reported in the literature (Spolaore et al. 2006; Chiu et al. 2009; Converti et al. 2009). The pre-cultured N. oculata was inoculated in
photobioreactors at an initial biomass
concentration (calculated dry weight of microalgal biomass per liter) of 26.84 ± 1.00 and of 21.46 ± 0.77 mg.L-1 in the experimental blocks 1 and 2, respectively.
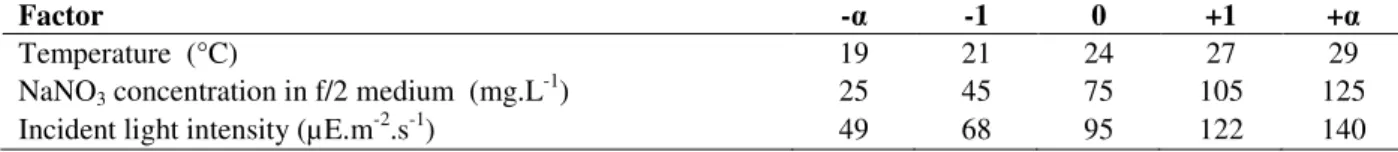
Table 1 - Quantitative values of the encoded factor level.
Factor -α -1 0 +1 +α
Temperature (°C) 19 21 24 27 29
NaNO3 concentration in f/2 medium (mg.L-1) 25 45 75 105 125
Incident light intensity (µE.m-2.s-1) 49 68 95 122 140
Analytical Methods
Samples (4.0 mL) were withdrawn daily at the same time to monitor the cell growth. Biomass density was evaluated by measuring the optical
density at 570 nm. (Pró-Análise UV-1600 spectrophotometer, Brazil).
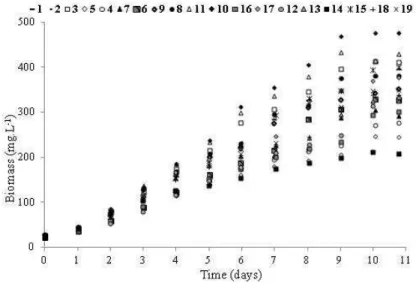
when required. For each block of the experiments, a calibration curve of cell dry weight (filtration on Macherey-Nagel GF-3 filters, Germany) versus absorbance was established. Therefore, for each batch experiment, growth curves (Fig. 1) and final biomass concentration were determined according to culture absorbance. The pH was monitored daily using indicator paper (Merck, range 0-14, USA) and remained between 7.0 and 8.0 throughout the entire experimental period.
Lipid extraction was conducted according to a modified Folch method, combined with ultrasound (Brum et al. 2009; Lee et al. 2010). Dry biomass was obtained by centrifugation (3044g, 5 min, 10°C) and lyophilization (to a constant weight). A sample (500 mg) was macerated with a chloroform/methanol solution (2:1, v/v, total 30 ml) in a porcelain crucible and subsequently sonicated for 90 min (Ultrasonic Bath Unique 1400A MaxiClean 40 kHz, Brazil). The solid content of the sample was removed by
centrifugation (2214 g, 8 min, 4°C) and the phase containing the lipids was subjected to additions of 6.0 mL 0.88% KCl solution, followed by chloroform/methanol (1:1, v/v, total 4.0 mL), and finally by hand agitation (in triplicate). The remaining lipid phase was filtered with anhydrous Na2SO4, recovered in a previously weighed balloon and submitted to solvent evaporation in a rotary evaporator (70°C, vacuum). Then, the lipid-containing balloon was kept in a desiccator for 10 min and then weighed to determine the lipid mass. Statistical analysis was performed using Statistica 10.0 (StatSoft Incorporation) software. The linear, quadratic and interaction factors of the variables were calculated. The significance level (α) was equal to 0.05%, which confirmed the significance of the results for the response variables with 95% confidence. A p-value of less than 0.05 was considered to indicate the significance. F-tests were carried out to evaluate the significance of the fitted models at 5% (Montgomery 2001).
Figure 1 - Growth curves for experiments 1 to 19.
RESULTS AND DISCUSSION
Two equations were created, one for each block,
which related N. oculata final biomass
concentration (y, in mg.L-1) to optical density (x), with R2 = 99.2% and 97.9%, respectively:
04 . 9 70 .
247 −
= x
y (1) 76
. 8 10 .
259 −
= x
y (2)
Dry weight determinations were made from the tests coded as experiments 10 and 11 (Table 2) in
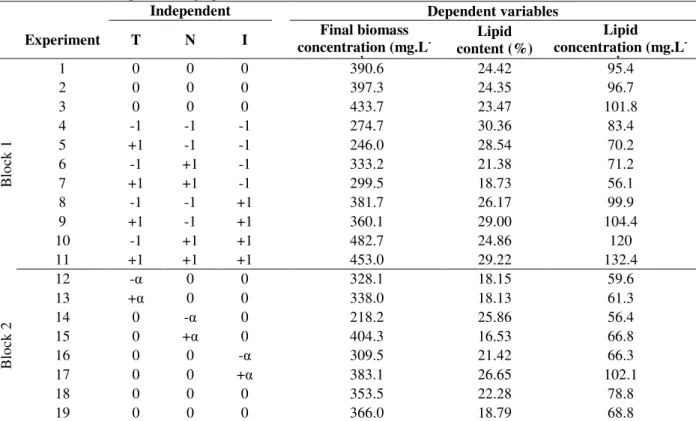
Table 2 - Central composite design parameter levels (encoded values).
Independent variables*
Dependent variables Experiment T N I concentration (mg.LFinal biomass
-1
)
Lipid content (%)
Lipid concentration (mg.L
-1 ) B lo ck 1
1 0 0 0 390.6 24.42 95.4
2 0 0 0 397.3 24.35 96.7
3 0 0 0 433.7 23.47 101.8
4 -1 -1 -1 274.7 30.36 83.4
5 +1 -1 -1 246.0 28.54 70.2
6 -1 +1 -1 333.2 21.38 71.2
7 +1 +1 -1 299.5 18.73 56.1
8 -1 -1 +1 381.7 26.17 99.9
9 +1 -1 +1 360.1 29.00 104.4
10 -1 +1 +1 482.7 24.86 120
11 +1 +1 +1 453.0 29.22 132.4
B
lo
ck
2
12 -α 0 0 328.1 18.15 59.6
13 +α 0 0 338.0 18.13 61.3
14 0 -α 0 218.2 25.86 56.4
15 0 +α 0 404.3 16.53 66.8
16 0 0 -α 309.5 21.42 66.3
17 0 0 +α 383.1 26.65 102.1
18 0 0 0 353.5 22.28 78.8
19 0 0 0 366.0 18.79 68.8
*
T = temperature, N = NaNO3 concentration in f/2 medium, I = incident light intensity.
The reduced models fitted for final biomass concentration (Equation 3) and lipid content (Equation 4) satisfactorily explained the effect of NaNO3 concentration in the f/2 medium (N) and incident light intensity (I), with an explained variation of data equivalent to 82.18 and 88.62%, respectively. The positive values of the linear regression coefficients associated with N and I (Equation 3) indicated that an increase in the final biomass concentration was favored by increasing the values of these variables. The negative value of the quadratic regression coefficient associated with N gave a parabolic data profile. The positive values of the regression coefficients associated with I (Equation 4) indicated that an increase in lipid content wasis favored by increasing the value of this variable. The same applied to the interaction effect between N and I, which showed that the lipid content increased in proportion to the combined effect of both variables. The negative value of the linear regression coefficient associated with N, however, demonstrated that the relationship between this variable and lipid content was inversely proportional, which was similar to the results obtained by Converti et al. (2009).
This inverse proportionality was consistent, since algae generally responded to nitrogen deprivation as a command to store the energy and then reacted to this response by accumulating the lipids. This happened naturally at the end of the exponential growth phase of batch culture when nutrients were scarce (Brown et al. 1997).
I N
N L
mg
biomass( . −1)=366.6+45.4⋅ −19.1⋅ 2+47.4⋅ (3)
I N I
I N
lipid(%)=22.14−2.61⋅ +1.39⋅ +1.52⋅ 2+2.21⋅ ⋅ (4)
I N I T I N T L mg
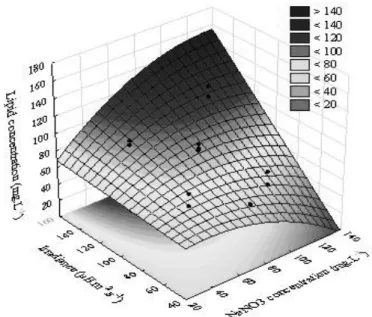
lipid( . −1)=89.25−5.38⋅ 2−4.97. 2−17.28. −5.65. . +9.30. .
(5)
The best experimental result obtained was 132.4 mg.L-1 for final lipid concentration under the following conditions: 27°C, NaNO3 concentration 105 mg.L-1 and 122 µE.m-2.s-1 (experiment number 11 in Table 2). In some Block 1experiments, the maximum lipid content reached was around 30%, which could be associated with the stress, and was an important result compared to those obtained by Converti et al. (2009), where the maximum lipid content reached was around 16%.
which was a challenge for the optimization of these two variables together. However, if one analyzes the region above the N and I upper experimental limits, an extrapolation of data suggested it as possible to obtain satisfactory results for both the responses with higher values
for these variables, as suggested in Figure 3, provided by equation 5. In this case, only significant factors were considered, with an explained variation of data equivalent to 90.94%.
This information should be taken into
consideration when planning future studies.
Figure 2 - Response surfaces for biomass concentration (a) and lipid content (b) in the reduced fitted models. Dots represent experimental data.
CONCLUSION
In this work the influence of temperature, incident light intensity and NaNO3 medium concentration on N. oculata lipid accumulation was studied. The best experimental result was 132.4 mg.L-1 for final
lipid concentration, under the following
conditions: 27°C, 122 µE.m-2.s-1 and 105 mg.L-1, respectively, corresponding to ca.30% of dry weight biomass. In the experimental design, the interaction between NaNO3 medium concentration and incident light intensity was particularly important for lipid storage. Further studies could increase the biomass and lipids productivity, making N. oculata a promising microalga for energy purposes.
ACKNOWLEDGEMENTS
The authors would like to thank the Coordenação de Aperfeiçoamento de Pessoal de Nível Superior (CAPES) for the financial grant; Professor Paulo Cesar Oliveira Vergne de Abreu, from LABFITO at FURG, for providing the N. oculata strain; and the scientific and technological initiation students, Aline Bernardi, Cauã Brum Borges, Elis Domeneghini and Leonardo Rolim, for their experimental contributions.
REFERENCES
International Energy Outlook 2011 [Internet]. U. S. Energy Information Administration - [cited 2011 October 21]. Available from: www.eia.gov.
Brennan L, Owende P. Biofuels from microalgae - A review of technologies for production, processing, and extractions of biofuels and co-products.
Renewable Sustainable Energy Rev. 2010; 14(2): 557-77.
Brown R, Jeffrey SW, Volkman JK, Dunstan GA. Nutritional properties of microalgae for mariculture.
Aquaculture. 1997; 51315-31.
Brum AAS, De Arruda LF, Regitano-d'Arce MAB. Extraction methods and quality of the lipid fraction of vegetable and animal samples. Quím Nova. 2009; 32(4): 849-54.
Chisti MY. Airlift bioreactors. London, New York: Elsevier Applied Science; 1989.
Chisti Y. Biodiesel from microalgae. Biotechnol Adv. 2007; 25(3): 294-306.
Chiu SY, Kao CY, Tsai MT, Ong SC, Chen CH, Lin CS. Lipid accumulation and CO2 utilization of Nannochloropsis oculata in response to CO2 aeration. Bioresour Technol. 2009; 100(2): 833-8.
Converti A, Casazza AA, Ortiz EY, Perego P, Del Borghi M. Effect of temperature and nitrogen concentration on the growth and lipid content of
Nannochloropsis oculata and Chlorella vulgaris for biodiesel production. Chem Eng Process. 2009; 48(6): 1146-51.
Flynn KJ, Davidson K, Leftley JW. Carbon-nitrogen relations during batch growth of Nannochloropsis oculata (Eustigmatophyceae) under alternating light and dark. J Appl Phycol. 1993; 5(4): 465-75.
Gallagher BJ. The economics of producing biodiesel from algae. Renewable Energy. 2011; 36(1): 158-62. Lee JY, Yoo C, Jun SY, Ahn CY, Oh HM. Comparison
of several methods for effective lipid extraction from microalgae. Bioresour Technol. 2010; 101(1 suppl.). Lourenço SdO. Cultivo de Microalgas Marinhas:
Princípios e Aplicações. RiMa; 2006.
Montgomery DC. Design and Analysis of Experiments. 5th ed. John Wiley & Sons, Inc; 2001.
Rodolfi L, Zittelli GC, Bassi N, Padovani G, Biondi N, Bonini G, et al. Microalgae for Oil: Strain Selection, Induction of Lipid Synthesis and Outdoor Mass Cultivation in a Low-Cost Photobioreactor.
Biotechnol Bioeng. 2009; 102(1): 100-2.
Roncarati A, Meluzzi A, Acciarri S, Tallarico N, Melotti P. Fatty acid composition of different microalgae strains (Nannochloropsis sp.,
Nannochloropsis oculata (Droop) Hibberd,
Nannochloris atomus Butcher and Isochrysis sp.) according to the culture phase and the carbon dioxide concentration. J World Aquacult Soc. 2004; 35(3): 401-11.
Spolaore P, Joannis-Cassan C, Duran E, Isambert A. Commercial applications of microalgae. J Biosci Bioeng. 2006; 101(2): 87-96.