Vol.52, n. 3: pp.555-566, May-June 2009
ISSN 1516-8913 Printed in Brazil BRAZILIAN ARCHIVES OF
BIOLOGY AND TECHNOLOGY
A N I N T E R N A T I O N A L J O U R N A L
Production of DNA Microarray and Expression Analysis of
Genes from
Xylella fastidiosa
in Different Culture Media
Regiane de Fátima Travensolo
1,2*, Maria Vitória Cecchette Gottardi Costa
1, Lucia Maria
Carareto-Alves
1, Emanuel Carrilho
2and Eliana Gertrudes de Macedo Lemos
11Departamento de Tecnologia; Universidade Estadual Paulista; Via de acesso Paulo Donato Castellane, s/n;
14884-900; Jaboticabal - SP - Brasil. 2Instituto de Química de São Carlos; Universidade de São Paulo; Av. Trabalhador São-Carlense, 400; 13560-97; São Carlos - SP - Brasil
ABSTRACT
DNA Microarray was developed to monitor the expression of many genes from Xylella fastidiosa, allowing the side-by-side comparison of two situations in a single experiment. The experiments were performed using X. fastidiosa cells grown in two culture media: BCYE and XDM2. The primers were synthesized, spotted onto glass slides and the array was hybridized against fluorescently labeled cDNAs. The emitted signals were quantified, normalized and the data were statistically analyzed to verify the differentially expressed genes. According to the data, 104 genes were differentially expressed in XDM2 and 30 genes in BCYE media. The present study showed that DNA microarray technique efficiently differentiate the expressed genes under different conditions.
Key words: DNA Microarray, Xylella fastidiosa, expression, transcriptome
* Author for correspondence: rtravensolo@yahoo.com.br
INTRODUCTION
The genome sequence determination of the
phytopathogenic bacterium X. fastidiosa strain
9a5c was a world landmark. X. fastidiosa-9a5c is associated to citrus variegated chlorosis (CVC) in sweet orange trees (Habermann et al., 2006). It has a main chromosome and two plasmids, composing a total of 2,905 genes. Half of these ORFs present similarity to unknown functions proteins (Simpson et al., 2000). Determination of which genes and under what circumstances are actively expressed represent the next great hurdle in understanding the metabolic and replicative characteristics, as well as in settling the pathogenicity mechanisms approaches.
Various methods are available for gene expression levels detection and quantification, including
northern blots (Alwine et al., 1977), S1 nuclease protection (Berks and Sharp, 1977), dotblot analysis (Lennon and Lehrach, 1991), differential display (Liang and Pardee, 1992), sequencing of cDNA libraries (Okubo et al., 1992) and serial analysis of gene expression (SAGE) (Velculescu et al., 1995). However, these methods present some drawbacks, which render them unsuitable when a large number of expression products are analyzed simultaneously (van Hal et al., 2000). DNA microarray consists of thousands of unique DNA sequences, each of them attached to a known location on a small solid surface. Labeled cDNA or DNA bind to the fixed sequences producing an indicative pattern of nucleic acid sequences, which can be qualitatively and semi-quantitatively
analyzed by a computer. Such technology hasbeen
Escherichia coli (Tao et al., 1999), Mycobacterium
tuberculosis (Wilson et al., 1999), Caulobacter
crescentus (Laub et al., 2000), Streptococcus
pneumoniae (De Saizieu et al., 2000),
Helicobacter pylori (Salama et al., 2000), Bacillus
subtilis (Yoshida et al., 2001), Klebsiella
peneumoniae (Dong et al., 2001), Salmonella
enterica (Detweiler et al., 2001), Shewanella
oneidensis MR-1 (Murray et al., 2001),
Cortnebacterium glutamicum (Lange et al., 2003),
Pseudomonas aeruginosa (Wagner et al., 2003)
and X. fastidiosa (Koide et al., 2004; Travensolo, 2004; Pashalidis et al., 2005). The DNA
microarray technique constitutes the most
promising and revolutionary ever-developed technique to study differential gene expression. In this work, the DNA microarrays technique was
applied to X. fastidiosa gene expression analyses
under different conditions (XDM2 and BCYE
media).
MATERIALS AND METHODS
Growth conditions
Genomic DNA extraction was carried out with X.
fastidiosa strain 9a5c cells grown in BCYE solid
medium (Wells et al., 1981) at 28 ºC for six days.
RNA extraction was conducted in three
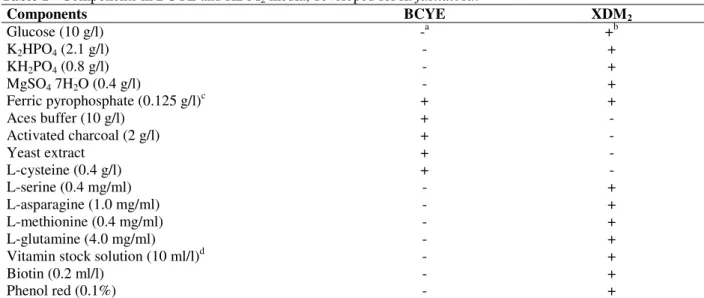
Erlenmeyer flasks containing the bacterial cells in 30 ml of XDM2 (Lemos et al., 2003) or BCYE media (Table 1) at 30 ºC in a rotatory shaker (140 rpm) for four days.
Table 1 - Components in BCYE and XDM2 media, developed for X. fastidiosa.
Components BCYE XDM2
Glucose (10 g/l) -a +b
K2HPO4 (2.1 g/l) - +
KH2PO4 (0.8 g/l) - +
MgSO4 7H2O (0.4 g/l) - +
Ferric pyrophosphate (0.125 g/l)c + +
Aces buffer (10 g/l) + -
Activated charcoal (2 g/l) + -
Yeast extract + -
L-cysteine (0.4 g/l) + -
L-serine (0.4 mg/ml) - +
L-asparagine (1.0 mg/ml) - +
L-methionine (0.4 mg/ml) - +
L-glutamine (4.0 mg/ml) - +
Vitamin stock solution (10 ml/l)d - +
Biotin (0.2 ml/l) - +
Phenol red (0.1%) - +
a
(-) components taken in the media, b(+) components added to the media, cin BCYE media, the ferric pyrophosphate concentration was 0.25 g/l and dVitamin stock solution (10 ml/l) contained 0.2 mg
D-biotin, 10 mg thiamine, 10 mg pyridoxine
hydrochloride, 5.0 mg nicotinic acid, 0.05 mg vitamin B12 and 350 mg myo-inositol.
Isolation of the genomic DNA and total RNA The genomic DNA was extracted according to the methodology described by Ausubel et al. (1992) with some modifications, which included the addition of 100 µl of RNAse solution (200 µg/ml), previously treated with proteinase K, and incubation at 37 ºC for 1 h. The RNA extraction methodology (Chomczynski and Sacchi, 1987) involved a monophasic solution of phenol and guanidine isothiocyanate - Trizol (Invitrogen, Carlsbad, CA, USA). The RNAs samples were obtained from X. fastidiosa cells grown in two
different media (XDM2 and BCYE). The cells
were treated with DNAse I, purified with the
NucleoSpin® RNA II BD Bioscience kit (Clontech,
Mountain View, CA, USA), resuspended in DEPC
treated H2O and stored at – 80 ºC. The DNA
integrity was analyzed by electrophoresis in 1.0% (w/v) agarose gel in 1 x TBE buffer (89 mM Tris, 89 mM Boric acid; 2.5 mM EDTA, pH 8.3) containing 0.5 µg/ml ethidium bromide. RNA integrity was verified in a 1.2% (w/v) agarose gel
in 10 x buffer (200 mM MOPS; 50 mMsodium
acetate; 10 mM EDTA), DEPC-treated H2O and
Synthesis of the fluorescent cDNA from total RNA
Synthesis of fluorescent cDNA was carried out with a CyScribe cDNA Post Labeling kit (GE Healthcare, Piscataway, NJ, USA) using 30 g of
total RNA, 15 g of random primers (GE
Healthcare, Piscataway, NJ, USA), 1 l of control
synthetic RNA in a final volume of 11 l.
Synthetic RNA from Lucidea Universal ScoreCard kit (GE Healthcare, Piscataway, NJ, USA) was used as the transcriptase reaction control. The mixture was incubated at 70 ºC for 5 min and cooled to room temperature for 10 min, to allow the primers and mRNA template annealing. An aliquot of 9 l of the following mix was added to each tube: 4 l 5 x CyScript buffer, 2 l 0.1 M DTT, 1 l nucleotide mix, 1 l AA-dUTP and 1 l CyScript reverse transcriptase. The reverse transcriptase reaction occurred at 37 ºC for 3 h in a
programmable thermocycler (PTC-100
Programmable Thermal Controller - MJ Research, Inc.). The reaction was neutralized with 20 l of 2 M HEPES. The cDNAs were purified by precipitation with a solution of 3 M sodium acetate and 75 l of 100% ethanol, followed by storage at – 20 ºC overnight. After centrifuging and washing with 70% (v/v) ethanol, the cDNA was
resuspended in 30 l of CyDye, which was
previously diluted in 0.1 M sodium bicarbonate buffer (pH 9.0).
The sample was kept at 25 ºC in the dark for 1 h and the labeling reaction was interrupted by adding 15 l of 4 M hydroxylamine for 15 min at 25 ºC. The sample was then resuspended in 400 l of TE buffer (10 mM Tris, 1 mM EDTA, pH 8.0) and concentrated using a YM 30 Microcon-like column (Millipore, Billerica, MA, USA). The CyDye incorporation efficiency was monitored by
absorbance measurements at different
wavelengths: 260 nm (for DNA concentration), 550 nm (for Cy3) and 650 nm (for Cy5).
Microarray construction
Specific primer pairs were designed for the whole
X. fastidiosa genome using the PRIMER3
software. These primer pairs were used to amplify
the 2,600 ORFs of X. fastidiosa-9a5cgenome. The
primer pairs were composed by 16 to 19 nucleotides and presented a Tm (melting temperature) ranged from 48 to 57 ºC. PCR reactions were carried out in 1 x PCR buffer (50 mM KCl, 200 mM Tris-HCl, pH 8.4), 2 mM
MgCl2, 10 mM dNTP, 2 U Taq DNA polimerase,
5 pMol of each primer, 60 ng of genomic DNA and pure sterile water to complete the volume to 100 l. The following reaction conditions were used: 94 ºC for 2 min, 35 cycles (94 ºC for 1 min, 58 ºC for 1 min and 72 ºC for 1 min and 30 s) and a final step of 72 ºC for 5 min. All products were analyzed by electrophoresis in 1.5% (w/v) agarose
gel in 1 x TBE buffer containing 0.5 g/ml
ethidium bromide.
The amplified products were suspended in 50%
(v/v) dimethyl sulfoxide (DMSO) to a final
concentration of 100 to 300 ng/ l. The suspension was arranged in duplicate, at 250 m of distance,
on CMT-GAPSTM silane-coated slides (Corning,
NY, USA) using an Affimetrix 417 Arrayer (Affymetrix, Santa Clara, CA, USA), according to the manufacturer’s instructions. The printed microarrays were re-hydrated (42 ºC for 10 s), dried (70 ºC for 1 min) and fixed in a cross-linked
UV camera (1300 x 100 J cm2). The arrays were
kept at 70 ºC during 2 h and then stored at room temperature under vacuum. Genetically distant negative controls were also included in this array with human (pHUM1 and pHUM7) and plant genes (707050B11 - Rubisco), as well as synthetic controls from various species, such as: human,
mouse, leaven, Arabidopsis spp., Archaeabacteria
and E. coli, which were obtained from Lucidea
Universal ScoreCard kit (GE Healthcare,
Piscataway, NJ, USA).
Hybridization and Washing
Arrays were hybridized and washed in a GeneTac Hybridization Station (Genomic Solutions, Ann Arbor, MI, USA). Initially, the arrays were denatured at 65 ºC for 5 min. A solution containing 8 µl of blocking liquid (GE Healthcare,
Piscataway, NJ, USA RPN 3601),19 l of SSC 20
Image acquisition and data analyses
Hybridized arrays were scanned with an Affymetrix 418 Array Scanner (Affymetrix, Santa Clara, CA, USA) at different wavelengths: 550 nm (Cy3) and 650 nm (Cy5). The localization and identity of each spot in the slide were defined in a
text file, which was created with the
CloneTracker2 program (BioDiscovery, El
Segundo, CA, USA). The signal of each spot was quantified with the ImaGene software (v. 4.1, BioDiscovery, El Segundo, CA, USA) where the Cy3 and Cy5 fluorescent dyes images were overlapped and the spots were classified, according to morphology and intensity. Data transformation was carried out by background signal subtraction from each spot signal using the local background, which was obtained by the
GeneSight-Lite program (BioDiscovery, El
Segundo, CA, USA). The Cy5/Cy3 signals
intensities ratio, obtained in BCYE and XDM2
media, respectively, were normalized according to the total signal intensity average. The replicas within each slide were combined to the average of their values and the statistical analysis was performed using the Significance Analysis of
Microarrays (SAM) program
(http://www-stat.stanford.edu/~tibs/SAM) (Tusher et al., 2001).
RESULTS AND DISCUSSION
Using DNA microarrays for genomic analysis of Xylella fastidiosa
Construction of DNA microarrays
X. fastidiosa-9a5c was used as the model organism
for these investigations. Therefore each of the X.
fastidiosa genome ORFs was represented by 2,600
amplicons, which were synthesized by pairs of primers. The amplifications were considered successful when only one product was visualized, within a size range of 0.3 to 1.0 kb. The final concentration of the amplified ORFs ranged from 100 to 300 ng/ l. The minimum required DNA concentration depends on some factors, such as probe length, base composition and binding capacity of the arrays substrate (Deyholos and Galbraith, 2001). The effect of probe length (0.2 – 1.2 kb) spotted in different concentrations was
shown by Heller et al. (1997). The authors
concluded that a probe concentration of 125 ng/ l, or higher, affected the signal intensities of probes shorter than 200 bp. If the DNA concentration was
lower than 100 ng/ l, loss of sensitivity and underestimation of differential expression degree
between samples were observed (Yue et al., 2001).
Human (pHUM1 and pHUM7) and plant genes (707050B11-Rubisco), as well as synthetic genes from several species (human, mouse, rat, yeast, plant and bacteria) were also included in this array
as negative controls. These controls play an
important role in microarray data analysis because they allow signal levels evaluation from nonspecific hybridization. Any spot on the array, which presents a signal not significantly stronger than the one from the negative control, should be scored as absent from the fluorescently labeled target (Holloway et al., 2002a).
The X. fastidiosa DNA arrays were made with
non-purified amplicons. Studies on microarray gene expression analysis, using non purified amplified products, have shown no significant differences between the purified and non purified PCR products. However low alteration on the hybridization signals (6%) have been observed, when compared to the purified products (Diehl et al., 2001).
The amplicons were printed on silane-coated glass microscope slides by an Affymetrix 417 Arrayer. A fraction of the ring fluid is transferred onto the microscope slide when the pins pass through the sample and push a tiny drop to the surface. This robot is designed to collect samples from 96 or 384-well microtitre plates, with four pins and rings simultaneously. Each ring collects 0.5 - 1.0 l of probe solution and the pin deposits about 50 pl of material on each slide, making 100 - 150 m diameter spots. However, the size of the resulting spot is a function of the pin diameter, the pin material, the fluid viscosity, and the dynamics of interaction between the fluid and the surface. For this reason, aqueous solutions deposited on hydrophobic or hydrophilic surfaces spread
differently before evaporation (Mace et al., 2000).
the spot morphology and the high background, which may be related to the batch variability (Ye et al., 2001).
In the present experiments, problems of spots shape variation were observed, such as deviations in circle uniformity of nearly 50% of the spots as well as absence of some spots (data not shown). Other problems associated to the irregular spot morphology were pin defects, low humidity
throughout the printing and low DNA
concentration. As quoted elsewhere, the problem of DNA concentration was corrected by gel analysis in order to quantify the amplified DNA, immediately prior to the printing.
The ideal relative humidity during the printing process should be 50 – 60% since it minimizes the formation of “doughnut” - shaped spots and improves the spot morphology homogeneity (Holloway et al., 2002b). Finally, the change of the pins for new ones had to be solved. The pins were always cleaned at the end of each cycle, allowing the same set of pins to be used in different array without cross-contamination. The hypothesis of pins damage in contact with the glass slide is strongly supported by variations in height between the slides. For this reason, both the pin strength and speed must be corrected in order to avoid its impact on deformation and the spot morphology modification.
Before robotic printing, some geometric tests were performed to determine the best spot distribution on the slides (data not shown). The linear geometry is an excellent standard for the printing of many samples (plates) and their replicas. However, the array geometry is used to control the localization of these replicates and the spaces in the slides, so that a small volume is necessary to the hybridization. In this experiment, the spots were printed in arrays of 4 x 2.
After spotting, the arrays were submitted to a heat treatment for both DNA sequences attaching to the glass surface and denaturation. The spotted amplicons were re-hydrated, dried and fixed in a cross-linked UV camera. The arrays were kept at
70 °C for 2 h and then stored at room temperature
under vacuum.
The used slides were coated with gamma-amino propyl silane because it limited the spotted DNA droplet dispersion and enhanced the slides hydrophobicity, also increasing the adherence of
the deposited DNA (Duggan et al., 1999). DNA is
bound to the substrate through the electrostatic interaction between the silane amine groups. The
positively charged primary amines attract the DNA negatively charged phosphodiester backbone (Stillman and Tonkinson, 2001). UV-irradiation enhances and stabilizes such interaction by generating free-radical-mediated coupling of thymidine residues and carbon atoms of the alkyl amine (Holloway et al., 2002a).
Synthesis of fluorescent labeled cDNA
Preparation of fluorescent labeled cDNAs was carried out by total RNA extraction, and its concentration was determined by absorbance
measurement at 260 nm (A260). One unit of
absorbance at 260 nm corresponds to 40 g of RNA per ml. The A260/A280 ratio provides an
approximate purity of RNA, but this
approximation is influenced by pH. If RNA is diluted in water, the A260/A280 ratio falls between 1.5 – 1.9. On the other hand, if RNA is diluted in 10 mM Tris-HCl buffer (pH 7.5), a value within the range 1.9 – 2.1 is expected (Wilfinger et al., 1997). The quality of RNA is critical factor for
microarray analysis. The extraction and
purification steps are particularly critical since they can cause RNA contamination, which can mediate significant non-specific binding of fluorescently labeled cDNAs to the slide surface
(Duggan et al., 1999). The RNA integrity was
checked by formaldehyde agarose gel
electrophoresis, where the occurrence of the two ribosomal subunit bands (23S and 16S containing of 2.9 and 1.5 kb, respectively) were examined. The fluorescent labeled cDNAs were prepared
from total X. fastidiosa RNA by reverse
transcription. Total RNA was used because most of the mRNAs produced by bacteria do not have a poly (A) tail and are difficultly separated. Lucchini et al. (2001) stated that cDNAs, generated by
specific primer (genome-directed primers),
showed higher sensitivity and specificity than the probes obtained by random priming. However, no satisfactory results was obtained with the synthesized primers for X. fastidiosa.
A limitation of this technology is the large amount of RNA required for hybridization. According to Ye et al. (2001), 7 - 15 g of total RNA in
combination with 6 µg of random hexamers
The used labeling kit was developed as a two-step
procedure. The first step involves the
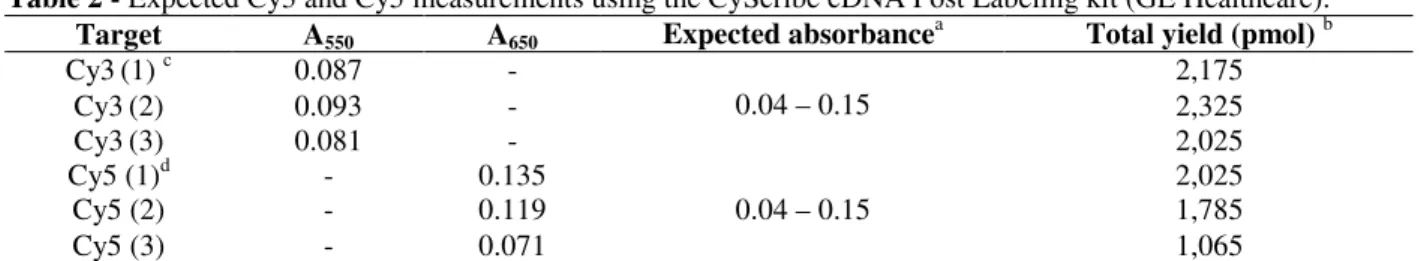
incorporation of amino allyl-dUTP (AA-dUTP) during cDNA synthesis using an optimized nucleotide mixture. The second step involves the chemically labeled amino allyl-modified cDNA using CyDye NHS-esters. Coupling reactions of amino allyl-modified cDNA were performed separately with Cy3 and Cy5 and both targets were combined in the hybridization solution. The amount of target used for hybridization depends on the array format and the labeling method. Targets containing 100 pMol of incorporated fluorescent dye were employed. Such amount was calculated
from the formulas: (OD550 x dilution factor x total
volume)/0.15 for Cy3 and (OD650 x dilution factor
x total volume)/0.25 for Cy5, where the obtained values were in pMol (Table 2).
Hybridization conditions and Image Analysis Hybridization conditions (sample concentration, ionic strength, temperature and time) depend on the fragments size present on the array. Thus, the hybridization and washing protocols used in this
study were optimized for X. fastidiosa. After
hybridization and washing, the arrays were
submitted to fluorescence reading in an
Affymetrix 418 Array Scanner at different wavelengths: 550 nm and 650 nm. The GMS 418 Array Scanner is a digital confocal laser scanning epifluorescent microscope. Either Cy3 or Cy5 fluorescent-dye tagged to sample on slides can be observed in such microscope. The Affymetrix 418 Array Scanner is capable of exciting and detecting two-channel different wavelengths. Images were obtained optically and then reported in grayscale or as false-colored data to quantify the signal intensity of each spot.
Table 2 - Expected Cy3 and Cy5 measurements using the CyScribe cDNA Post Labeling kit (GE Healthcare). Target A550 A650 Expected absorbancea Total yield (pmol)b
Cy3(1) c 0.087 - 2,175
Cy3(2) 0.093 - 2,325
Cy3(3) 0.081 -
0.04 – 0.15
2,025
Cy5 (1)d - 0.135 2,025
Cy5 (2) - 0.119 1,785
Cy5 (3) - 0.071
0.04 – 0.15
1,065
a
The expected absorbance range is indicated for the probe analysis in the AtlasTM Glass Fluorescent Labeling Kit User Manual (Clontech, Mountain View, CA, USA – www.Clontech.com); bThe yield was calculated by the values of the measured absorbance (A260) x absorbance of 1 unit at 260 nm x dilution factor. For example, the RNA concentration in XDM2 (1) was
calculated as 1,932 x 40 x 50 = 3,864 µg/µL; cCyScribe Cy3 reactive dye incorporated in XDM2 media cDNA and d
CyScribe Cy5 reactive dye incorporated in BCYE media cDNA.
Data acquisition and Normalization
There is a variety of software tools developed for array images processing. The main goal is to reduce a spot image of varied intensities into a table with intensity measurements of each spot. The localization and identity of each gene in the slide was defined in a text file created with the CloneTracker2 program. The signal was quantified with the ImaGene software, where two images
from the Cy3 and Cy5 fluorescent dyes were
overlapped and the spots classified according to morphology and intensity. The computer displays an electronic symbol as a false-color image where a red or green spot corresponds to an expression of a gene in sample 1 or 2, correspondingly, while a yellow-orange spot indicates that the gene has been expressed at similar levels in both samples. Aiming the data transformation, the background signal was subtracted from the signal of each spot
using the local background obtained by the GeneSight-Lite program. Data obtained from Cy5/Cy3 measured signal intensities ratio (from
BCYE and XDM2 media, respectively) were
normalized according to the average intensity of the total signal.
At least two sources of error are involved in the microarray experiments, such as biological (culture-to-culture variation) and operational ones (variation in the measurements themselves) which affect the measured gene expression levels (Liao and Sabatti, 2002).
systematic biases in the measured expression levels (Quackenbush, 2002). However current normalization methods are not applicable to all conditions.
Normalization can be carried out in different ways: within the slide, in order to adjust the dye incorporation efficiency; between two slides, for dye swap experiments; and across slides, for repetition of the same experiments (Yang et al., 2001). In this case, it would be employed to the entire data set (an overall normalization), instead of applying it to particular physical data subset or sub grid (a local normalization). Quackenbush (2002) suggested that the local normalization has the advantage of enabling corrections for systematic spatial variation in the array, including inconsistencies among the spotting pens used to make the array, variability in the slide surface and slight local differences in hybridization conditions across the array.
In this work, the identification of expressed genes
in three cDNA microarrays independent
experiments was focused. The replicas within and between the slides were combined by the average of their values and the statistical analysis was done using the SAM program. This method assigns a score (d) to each gene (i) based on the change in gene expression relative to the standard deviation of repeated measurements for that gene. For this purpose, 100 repeated permutations of the data were used in order to determine if the genes expression was significantly related to the response and if the significance cutoff was determined by a delta parameter ( = 0.49), which was based on the false significant number (FSN = 0.42). The genes with scores higher than a threshold or fold change (≥ 1.5 x) were deemed potentially significant and the percentage of such genes, occasionally identified, was the false discovery rate (FDR) (Fig. 1).
SAM Plot
-6 -4 -2 0 2 4 6
-5 -4 -3 -2 -1 0 1 2 3 4
Expected
O
b
s
e
rv
e
d
Significant: 134
Median # false significant: 0.42828
Delta 0.49514
Fold Change 1.50000
Figure 1 - Identification of genes with significant changes in expression measured by the SAM program. Each gene in the microarray is represented by a point. (A) green points – genes differentially expressed in the XDM2 medium and (B) red points – genes
Among the analyzed genes, approximately 5.15% (134 genes) were detected as differentially expressed under the studied media conditions. From these, 30 genes (22.4%) showed higher expression in the BCYE medium and 104 (77.6%)
in the XDM2 medium. The differentially expressed
genes were distributed among the respective
functional categories
(http://unicamp.lbi.ic.unicamp.br/xf) (Fig. 2). According to the results obtained by the
microarray analysis, bacteria cultivated in XDM2 medium expressed a higher number of significant genes than those cultivated in BCYE medium.
This was expected since XDM2 defined medium
contained a smaller variety of nutrients than BCYE complex medium. Analysis of the 14 categories revealed that eight of them (57.1 %) showed expressed genes in both the media (Table 3 and 4).
Figure 2 - Functional classes of Xylella fastidiosa 9a5c regulated genes. The differentially expressed genes were distributed in the respective functional categories and the number of genes for each category is shown.
Activities such as energy metabolism, transport,
RNA, DNA and nucleotide metabolism,
biosynthesis of amino acids, proteins and cofactors are considered essential for X. fastidiosa survival under any condition. The expression of genes
related to the glycolytic pathway
(6-phosphofrutokinase, glyceraldehydes-3-phosphate dehydrogenase, triosephosphate isomerase and pyruvate kinase type II) suggest that this pathway
is active and that glucose is degraded into pyruvate in X. fastidiosa cells.
Others functional categories were observed under particular growth condition. Activities related to toxin production (frpC, gaa and cvaB), plasmids (taxC), phage (int), cell division (ftsW) and others
(bcp) were only observed in XDM2 medium.
Among these, the depicted toxins belong to the
RTX family (gene frpC) and the production of
0 5 10 15 20 25
Energy Metabolism Transport Membrane Component and Surface Structure RNA, DNA and Nucleotide Metabolism Biosynthesis of Amino Acids and Protein Biosynthesis of Cofactors, Prosthetic Groups and Regulatory Functions Degradation of Molecules Hypothetical and Conserved Proteins Biosynthesis of Fatty Acids and Phospholipids Toxins Related to Plasmids Related to Phage Cell Division Others
Number of Genes
XDM2
colicin V (gene cvaB). The cvaB gene from E. coli, together with two other genes, cvaA and tolC mediates the elimination of colicin V (ColV) to the external environment, in order to destroy the target cell by membrane rupture (Zhong and Tai, 1998).
On the other hand, the expression of the fadG gene
can be assigned to the fatty acid biosynthesis. Such expression occurred at elevated levels in BCYE
medium. The E. coli fab genes presented higher
expression levels in the rich media, suggesting that
the regulation of the phospholipids biosynthesis
genes might be dependent on the growth speed, since they required a higher amount of membrane
compounds (Tao et al., 1999). However, it has
already been demonstrated that X. fastidiosa
growth was higher in XDM2 than in BCYE
medium in a 14 days period (Lemos et al., 2003).
Therefore fab gene expression is possibly
mediated by one or more signal molecules found in BCYE medium.
This technology has been used to study the behavior of X. fastidiosa genes under different conditions. The study presented here illustrated the best conditions to analyze the expressed genes of this important bacterium with the microarrays technology.
Table 3 -Xylella fastidiosa genes induced in XDM2 media.
Category Gene name (ORF)
Energy metabolism fumBrfbC, pfkA, gapA, acnB, petB, atpG, az1, tpiA, yahK, gcvT, mdh, , odhA
Transport f451, sac1, algS, citN, ccmA, malG, yecS, feoB, afuA, sppA, secY,
ynhE, xpsH, yheS
Membrane components and surface structure dc14, murD, XF0881, pilY1, pilP, mreB, XF2542, mrkD, pilU RNA, DNA and nucleotide metabolism holA, tgt/vacC, mutY, purE, recG, holB, metG, SCF 11.04 Biosynthesis of amino acids and proteins lysA, pspB, hisD, aroE, aroE, trpG
Biosynthesis of cofactors, prosthetic groups and regulatory functions
bioB, panC, tctD, bioA, sspB, algR, sspA, colR, ribD, folK, hemB, pilR, ribA
Degradation of molecules est, lipP
Toxins gaa, frpC, cvaB
Related to plasmid taxC
Related to phage int
Cell division ftsW
Others bcp
Hypothetical and conserved proteins hi0457, dr0620, tm1181, XF1240, XF0172, XF1753, XF2688, XF0358,
XF2687, XFa0028, XF0272, XF0201, XF2428, XF1117, XF1086, XF1798, XF2510, XF2400, XF0601, XF2449, XF0638, XF2074, XFa0018, XF2023, XF1881, XF0357, XF1323, XF2647, XF2363, XF2427, XF1854, XF0766
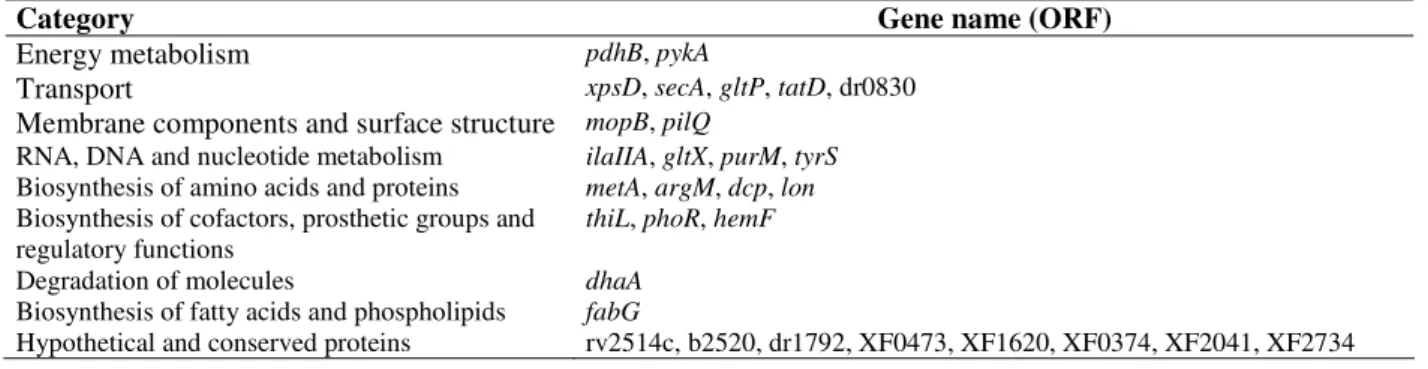
Table 4 -Xylella fastidiosa genes induced in BCYE media.
Category Gene name (ORF)
Energy metabolism pdhB, pykA
Transport xpsD, secA, gltP, tatD, dr0830 Membrane components and surface structure mopB, pilQ
RNA, DNA and nucleotide metabolism ilaIIA, gltX, purM, tyrS
Biosynthesis of amino acids and proteins metA, argM, dcp, lon Biosynthesis of cofactors, prosthetic groups and
regulatory functions
thiL, phoR, hemF
Degradation of molecules dhaA
Biosynthesis of fatty acids and phospholipids fabG
ACKNOWLEDGMENTS
We thank Geraldo Passos for helping in the microarray technique standardization. During this work, R.F.T was supported by FAPESP (00/06289-2).
RESUMO
DNA Microarray foi desenvolvida para monitorar
a expressão de muitos genes de Xylella fastidiosa,
permitindo a comparação de duas situações
distintas em um único experimento. Os
experimentos foram feitos utilizando células de X.
fastidiosa cultivada em dois meios de cultura:
BCYE e XDM2. Pares de oligonucleotídeos
iniciadores foram sintetizados, depositados em lâminas de vidro e o arranjo foi hibridizado contra cDNAs marcados fluorescentemente. Os sinais emitidos foram quantificados, normalizados e os dados foram estatisticamente analisados para verificar os genes diferencialmente expressos. De acordo com nossos dados, 104 genes foram diferencialmente expressos para o meio de cultura
XDM2 e 30 genes para o BCYE. No presente
estudo, nós demonstramos que a técnica de DNA
microarrays eficientemente diferencia genes
expressos sob diferentes condições de cultivo.
REFERENCES
Alwine, J. C.; Kemp, D. J. and Stark, G. R. (1977), Method for detection of specific RNAs in agarose gels by transfer to diazobenzyloxymethyl-paper and hybridization with DNA probes. Proc Nat Aca Sc USA,74, 5350-5354.
Ausubel, F. M; Brent, R.; Kingston, R. E., Moore, D. D, Seidman, J. G., Smith, J. A. and Struhl, K. (1992), In-
Current Protocols in Molecular Biology. ed. Greene Publishing Associates and John Wiley and Sons, pp. 387.
Berk, A .J. and Sharp, P. A. (1977), Sizing and mapping of early adenovirus mRNAs by gel electrophoresis of SI endonuclease–digested hybrids. Cell, 12, 721-732. Chomcznski, P. and Sacchi, N. (1987), Single-step
method of RNA isolation by acid guanidinium thiocyanate-phenol-chloroform extraction. Anal. Biochem., 162, 156-159.
De Saizieu, A.; Gardes, C.; Flint, N.; Wagner, C.; Kamber, M.; Mitchell, T. J.; Keck, W.; Amrein, K. E. and Lange, R. J. (2000), Microarray–based identification of a novel Streptococcus pneumoniae
regulon controlled by an autoinduced peptide. J. Bacteriol., 182, 4696-4703.
Detweiler, C. S.; Cunanan, D. B. and Falkow, S. (2001), Host microarray analysis reveals a role for the
Salmonella response regulator phoP in human macrophage cell death. Proc. Natl. Acad. Sci. USA, 98, 5850-5855.
Deyholos, M. K. and Galbraith, D. W. (2001), High – density DNA microarrays for gene expression analysis. Cytometry, 43, 229-238.
Diehl, F.; Grahlmann, S.; Beir, M. and Hoheisel, J. D. (2001), Manufacturing DNA microarrays of high spot homogeneity and reduced background signal. Nucleic Acids Res., 29, 38.
Dong, Y.; Glasner, J. D.; Blattner, F. R. and Triplett, E. W. (2001), Genomic interspecies microarray hybridization: rapid discovery of three thousand genes in the maize endophyte, Klebsiella pneumoniae
342, by microarray hybridization with Escherichia coli K-12 open reading frames. Appl. Environ.
Microbiol., 67, 1911-1921.
Duggan, D. J.; Bittner, M.; Chen, Y.; Meltzer, P. and Trent, J. M. (1999), Expression profiling using cDNA microarrays. Nat. Genet., 21, S10-S14.
Habermann, G.; Alvarez, R. C. F.; Modesto, J. C.; Fortes, A. M. T.; Rodrigues, J. D. and Ono, E. O. (2006), Rooting of healthy and CVC-affected “Valência” sweet orange stem cutting through the use of plant regulators. Braz. Arch. Biol. Technol., 49, 29-36.
Heller, R. A.; Schena, M.; Chai, A.; Shalon, D.; Bedilion, T.; Gilmore, J.; Woolley, D. E. and Davis, R. W. (1997), Discovery and analysis of inflammatory disease – related genes using cDNA microarrays. Proc. Natl. Acad. Sci. USA, 94, 2150-2155.
Holloway, A.; Murphy, M. and Chandrasekharappa, S. (2002a), Resuspending array-ready DNA for printing and storing. In: DNA Microarrays – A Molecular Cloning Manual. Bowtell, D. and Sambrook, J. Cold spring harbor laboratory press, Cold Spring Harbor, New York, pp. 712.
Holloway, A.; Murphy, M.; Massini, A.; Harris, T. and Child, G. (2002b), Care and cleaning of quill pins. In:
Koide, T.; Zaini, P. A.; Moreira, L. M.; Vêncio, R. Z. N.; Matsukuma, A. Y.; Durham, A. M.; Teixeira, D. C.; El-Dorry, H.; Monteiro, P. B.; Silva, A. C. R.; Verjovski-Almeida, S.; Silva, A. M. and Gomes, S. L. (2004), DNA Microarray-based genome comparison of a pathogenic and a nonpathogenic strain of Xylella fastidiosa delineates genes important for bacterial virulence. J. Bacteriol., 186, 5442-5449.
Lange, C.; Rittmann, D.; Wendish, V. F.; Bott, M. and Sahm, H. (2003), Global expression profiling and physiological characterization of Coyrnebacterium glutamicum grown in the presence of L – valine.
Appl. Environ. Microbiol., 69, 2521-2532.
Laub, M. T.; McAdams, H. H.; Feldblyum, T.; Fraser, C. M. and Shapiro, L. (2000), Global analysis of the genetic network controlling a bacterial cell cycle.
Science, 290, 2144-2148.
Lemos, E. G. M.; Alves, L. M. C. and Campanharo, J. C. (2003), Genomics-based design of defined growth media for the plant pathogen Xylella fastidiosa.
FEMS Microbiol. Lett., 219, 39-45. [Erratum in
FEMS Microbiol. Lett., 2004, 231, 299].
Lennon, G. G. and Lehrach, H. (1991), Hybridization analysis of arrayed cDNA libraries. Trends Genet.,7, 314-317.
Liang, P. and Pardee, A. B. (1992), Differential display of eukaryotic messenger RNA by means of the polymerase chain reaction. Science, 257, 967-971. Liao, J. C. and Sabatti, C. (2002), Microanalysis of
DNA Microarrays. ASM News, 68, 432-437.
Lucchini, S.; Thompson, A. and Hinton, J. C. D. (2001), Microarrays for microbiologists. Microbiol., 147, 403-1414.
Mace Jr., M. L.; Montagu, J.; Rose, S. D. and McGuinness, G. (2000), Novel Microarray printing and detection technology. In: Microarray Biochips Technology, ed. Mark Schena, pp. 39-64.
Murray, A. E.; Lies, D.; Li, G.; Nealson, K.; Zhou, J. and Tiedje, J. M. (2001), DNA/DNA hybridization to microarrays reveals gene – specific differences between closely related microbial genomes. Proc.
Natl. Acad. Sci. USA, 98, 9853-9858.
Okubo, K.; Hori, N.; Matoba, R.; Niiyama, T.; Fukushima, A.; Kojima, Y. and Matsubara, K. (1992), Large scale cDNA sequencing for analysis of quantitative and qualitative aspects of gene expression. Nat. Genet.,2, 173-179.
Pashalidis, S.; Moreira, L. M.; Zaini, P. A.; Campanharo, J. C.; Carareto-Alves, L. M.; Ciapina, L. P.; Vêncio, R. Z. N.; Lemos, E. G. M.; Silva, A. M. and Silva, A. C. R. (2005), Whole-genome expression profiling of Xylella fastidiosa in response to growth on glucose. OMICS, 9, 77-90.
Quackenbush, J. (2002), Microarray data normalization and transformation. Nat. Genet., 32, 496-501.
Salama, N.; Guillemin, K.; McDaniel, T. K.; Sherlock, G.; Tompkins, L. and Falkow, S. (2000), A whole-genome microarray reveals genetic diversity among
Helicobacter pylori strains. Proc. Natl. Acad. Sci.
USA, 97, 14668-14673.
Simpson, A. J. G.; Reinach, F. C.; Arruda, P. et al. (2000), The genome sequence of the plant pathogen
Xylella fastidiosa. Nature, 406, 151-159.
Southern, E.; Mir, K. and Shcheponiw, M. (1999), Molecular interactions on microarrays. Nature Genet., 21, 5-9.
Stillman, B. A. and Tonkinson, J. L. (2001), Expression microarray hybridization kinetics depend on length of the immobilized DNA but are independent of immobilization substrate. Anal. Biochem., 295, 149-157.
Tao, H.; Bausch, C.; Richmond, C.; Blattner, F. R. and Conway, T. (1999), Functional genomics: expression analysis of Escherichia coli growing on minimal and rich media. J. Bacteriol., 181, 6425-6440.
Travensolo, R. F. (2004), Análise da expressão gênica de Xylella fastidiosa por microarranjos de DNA. PhD Thesis, Faculdade de Ciências Agrárias e Veterinárias, Universidade Estadual Paulista, Jaboticabal, Brazil.
Tusher, V.; Tibshirani, R. and Chu, G. (2001), Significance analysis of microarrays applied to the ionizing radiation response. Proc. Natl. Acad. Sci.
USA, 98, 5116-5121.
van Hal, N. L.; Vorst, O.; Van Houwelingen, A. M.; Kok, E. J.; Peijnenburg, A.; Aharoni, A.; Van Tunen, A. J. and Keijer, J. (2000), The application of DNA microarrays in gene expression analysis. J.
Biotechnol., 78, 271-280.
Velculescu, V. E.; Zhang, L.; Vogelstein, B. and Kinzler, K. W. (1995), Serial analysis of gene expression. Science, 270, 484-487.
Wells, J. M.; Raju, B. C.; Nyland, G. and Lowe, S. K. (1981), Media for isolation and growth of bacteria associated with plum leaf scald and phony peach diseases. Appl. Environ. Microbiol., 42, 357-363. Wagner V.E., Bushnell D., Passador L., Brooks A.I.
and Iglewski B.H. (2003). Microarray analysis of
Pseudomonas aeruginosa quorum-sensing regulons: effects of growth phase and environment. J Bacteriol
185, 2080-2095.
Wilfinger, W. W.; Mackey, M. and Chomczynski, P. (1997), Effect of pH and ionic strength on the spectrophotometric assessment of nucleic acid purity.
BioTechniques, 22, 474.
Yang, Y. H.; Dudoit, S.; Luu, P. and Speed, T. P. (2001), Normalization for cDNA Microarrays Data,
pp. 1-12, 2001.
(http://www.stat.berkeley.edu/users/terry/zarray/html/ papersindex.html).
Ye, R. W.; Wang, T.; Bedzyk, L. and Croker, K. M. (2001), Applications of DNA microarrays in microbial systems. J. Microbiol. Methods, 47, 257-272.
Yoshida, K.; Kobayashi, K.; Miwa, Y.; Kang, C. M.; Matsunaga, M.; Yamaguchi, H.; Tojo, S.; Yamamoto, M.; Nishi, R.; Ogasawara, N.; Nakayama, T. and Fujita, Y. (2001), Combined transcriptome and proteome analysis as a powerful approach to study genes under glucose repression in Bacillus subtilis.
Nucleic Acids Res., 29, 683-692.
Yue, H.; Eastman, P. S.; Wang, B. B.; Minor, J.; Doctolero, M. H.; Nuttall, R. L.; Stack, R.; Becker, J. W.; Montgomery, J. R.; Vainer, M. and Johnston, R. (2001), An evaluation of the performance of cDNA microarrays for detecting changes in global mRNA expression. Nucleic Acids Res., 29, E41-41.
Zhong, X and Tai, P. C. (1998), When an ATPase is not an ATPase: at low temperatures the c-terminal domain of the ABC transporter cvaB is a GTPase. J Bacteriol., 180, 1347-1353.