ISSN 1415-0980 (impresso)
ISSN 2179-8087 (online)
Original Article
Spatial and Height Distribution of Harvested Rupestrian Field
Species in Preserved and Cultivated Communities
Henrique Nery Cipriani
1, Helaine de Sousa
2, Evandro Luiz Mendonça Machado
3,
Anne Priscila Dias Gonzaga
4, Lidiany Camila da Silva Carvalho
5,
Ary Teixeira de Oliveira-Filho
61Centro de Pesquisa Agroflorestal de Rondônia, Empresa Brasileira de Pesquisa Agropecuária – EMBRAPA,
Porto Velho/RO, Brazil
2Instituto Federal de Educação, Ciência e Tecnologia de Rondônia – IFRO, Porto Velho/RO, Brazil
3Departamento de Engenharia Florestal, Universidade Federal dos Vales do Jequitinhonha e Mucuri – UFVJM,
Diamantina/MG, Brazil
4Departamento de Geografia, Universidade Federal dos Vales do Jequitinhonha e Mucuri – UFVJM,
Diamantina/MG, Brazil
5Núcleo de Pesquisas de Roraima, Instituto Nacional de Pesquisas da Amazônia – INPA, Boa Vista/RR, Brazil
6Instituto de Ciências Biológicas, Universidade Federal de Minas Gerais – UFMG, Belo Horizonte/MG, Brazil
ABSTRACT
This study aimed to compare the spatial and the height distribution of three plant species between two rupestrian field communities, one preserved (A) and the other cultivated (B). One 50 × 100 m plot was delimited in each community and the populations of Eremanthus incanus, Lychnophora pinaster and Vellozia caruncularis were assessed for height and spatial distribution (using the Ripleys’s L-function). In community A, 4,098 individuals were counted, mostly L. pinaster, against 220 individuals in community B, prevailing E. incanus. An inverted-J pattern was observed for height distribution in both communities, however, with lower frequencies in B. Regular spatial distribution was found for E. incanus and V. caruncularis in community A, whereas the pattern for L. pinaster depended on the scale of analysis. The spatial distribution of all species differed between communities. The Ecological Park Quedas do Rio Bonito contributes to the conservation of these rupestrian field species.
Keywords: arnica, candeia, forest management, Conservation Unities, Ripley’s function.
1. INTRODUCTION
The rupestrian field is a highly specialized phytophysiognomy which occurs mainly on the mountains of the Southeastern, Central and Northeastern Brazil, between 21º10’ and 10º S, usually above 900 m.a.s.l. (Giulietti et al., 1997; Vasconcelos, 2011). It shows discontinuous distribution, determined by shallow soils and rock outcrops (Brasil, 1983). The rupestrian
field vegetation contains many endemic species, which are adapted to high variations of temperature and water availability, acidic and oligotrophic soils, and fire occurrence (Joly, 1970; Oliveira-Filho & Fluminhan-Filho, 1999; Romero & Nakajima, 1999; Salimena et al., 2013).
management, which increases the need for studies to aid their conservation (Mann, 2013). Among the rupestrian field species which are commonly exploited and deserves attention are Eremanthus incanus
(Less.) Less., Lychnophora pinaster Mart. and Vellozia caruncularis Mart. ex Seub.
Eremanthus incanus is an arboreal Asteraceae popularly known as “candeia” which may reach 10 m tall, with reddish-brown lanate-tomentose or gray lepidote-tomentulose stems, frequently darkened basally by fire (Macleish, 1987). As Eremanthus erythropappus
(DC.) MacLeish, the most common candeia species,
E. incanus timber is economically valuable, being exploited to produce firewood, tool grips and fence posts (Scolforo et al., 2003; Oliveira et al., 2009; Silva et al., 2012).
Lychnophora pinaster is a shrubby Asteraceae commonly known as “arnica”. According to Coile & Jones (1981), Lychnophora plants are usually much branched and pachycladous; have tomentum stems and prominent leaf scars; leaves are usually crowded on the current season’s growth; and may reach 4 m tall.
Lychnophora pinaster is widely applied to the treating of inflammatory and Chagas diseases (Chiari et al., 1991; Abreu et al., 2013), but its reckless exploitation is menacing the species conservation (Biodiversitas, 2007).
Vellozia caruncularis, popularly known as “canela-de-ema”, is a Velloziaceae shrub with showy lily-like lilac flowers, highly endemic to mountainous habitats, such as rupestrian fields and cangas (Menezes et al., 1993; Jacobi et al., 2007). The loss of habitat and the predatory exploiting are the main hazards for V. caruncularis and Velloziaceae in general (Ayensu, 1973; Lousada et al., 2011).
The analysis of the spatial and the height distribution of plants in native environments is a valuable tool to the conservation of threatened species (Niklas et al., 2003; Almeida & Cortines, 2008; Carvalho et al., 2009; Santos et al., 2011; Amaral et al., 2013; Bruzinga et al., 2013). Such studies aid the identification of disturbances on the plant population structure and subsidize the construction of sustainable management plans and policies (Kanieski et al., 2012; Samaniego & Marquet, 2013; Garzon-Lopez et al., 2014; Zhang et al., 2014).
Nevertheless, studies on this issue are still scarce for plants of rupestrian fields. Therefore, this study aimed to compare the spatial and height distribution
of three plant species between two rupestrian field communities: one legally protected and the other subjected to anthropogenic disturbances.
2. MATERIAL AND METHODS
The study was carried out in two rupestrian field communities, approximately 1.1 km apart from each other: one within a protected area (Quedas do Rio Bonito Ecological Park) and the other prone to anthropogenic disturbances, outside the Park. The Ecological Park Quedas do Rio Bonito is a 235 ha private reserve established in 1976 which protects a valuable fragment of native forest with well-represented and well-preserved plant population (Oliveira-Filho & Fluminhan-Filho, 1999), whereas its surroundings are visibly cultivated. It is located within the coordinates 21° 19’ 45” – 21° 20’ 48” S and 44° 58’ 18” – 44° 59’ 24” W, between 1,000 and 1,300 m of altitude. The local climate is a transition between Cwb and Cwa, according to the Köppen classification: temperate, with dry winter, mean annual precipitation of 1,529 mm and mean annual temperature of 19.4 °C. The predominant soils in the area are Leptosols and Cambisols, with frequent rock outcrops (Curi et al., 1990).
The area’s original vegetation comprises a mosaic of forest, savannah (cerrado) and rupestrian field fragments, with relatively frequent fire occurrence (Eiten, 1982; Oliveira-Filho & Fluminhan-Filho, 1999; Vasconcelos, 2011). In general, the rupestrian fields are associated with shallow and young soils on the mountains; whereas the savannah and forest fragments occur at lower altitudes and on the older and deeper soils (Oliveira-Filho & Fluminhan-Filho, 1999).
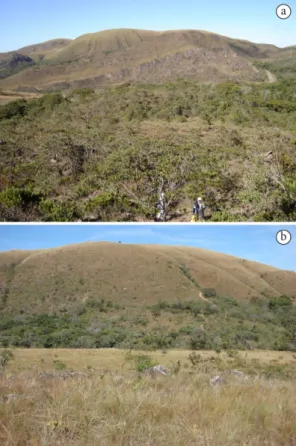
Each rupestrian field community, had one 50 × 100 m plot delimited (Figure 1). Both plots faced west and were within 1,000 and 1,200 m of altitude. The plots were set with the length uphill. They also showed rock outcrops, indicating shallow soils. The plot inside the Park (Figure 2a) is far from the entrance or roads, and can only be assessed through a hilly trail; whereas the plot outside (Figure 2b) is close to the road and has an easier access.
Within the plots, all live Eremanthus incanus,
assessed with a measuring tape considering the plot length (100 m) as the X axis and plot width (50 m) as the Y axis. The (0.0) coordinate was assigned to the northeastern corner of the plots. The height was measured with a graduated rod. Data were collected in April, 2007.
Density distributions for height classes were prepared for each species and community using five classes with 1 m of amplitude each. To offset the strong decrease in the density of individuals in the larger classes and linearize the distribution, data were transformed to ln (n+1) (Espírito-Santo et al., 2005). This transformation allows a better representation of the greater and low-density classes, facilitating graphical comparison (Oliveira-Filho et al., 2001).
The spatial distribution of the species was analyzed with the Ripley’s K (h) function (Ripley, 2004), recommended for the study of spatial patterns. The Ripley’s K (h) function (Equation 1) is a probability density function which considers the variance of the distances among all pairs of events (Moeur, 1993; Haase, 1995):
2 1 1,
( )
ˆ ( ) n n h ij
ij
i j i j
I d R
K h
w
n = = ≠
=
∑ ∑
(1)Where K hˆ( ) is the e expected number of events
(plants); h is the radius of the circle centered in each event; R is the area of the studied region (plot); n is the number of observed events; dij is the distance between the ith and jth cases;
( )
h ij
I d is an indicator function
which is 1 if dij≤h and 0 otherwise; and wij is an edge correction factor, corresponding to the proportion of the circumference of the circle centered at the ith event that is within the region R.
To compare K hˆ( ) against the random pattern, the
transformed L hˆ( ) function was used (Equation 2):
( ) ˆ( )
ˆ K h
L h h
π
= − (2)
The significance of the L hˆ( ) function deviations
was determined by the construction of an envelope of complete spatial independence among events, based on 500 independent simulations of n events in the study area. The plotting of L hˆ( ) as a function of the
distance h indicates clustered distribution at positive values, regular distribution at negative values and random distribution at values within the constructed
Figure 1. Location of the plots (white rectangles) inside and outside the Ecological Park Quedas do Rio Bonito. Each plot has 50 x 100 m (0.5 ha). The Park’s boundary is shown in white.
Figura 1. Localização das parcelas (retângulos brancos) dentro e fora do Parque Ecológico Quedas do Rio Bonito. Cada parcela possui 50 x 100 m (0,5 ha). Os limites do Parque estão representados pela linha branca.
Figure 2. General view of the plots within (a) and outside (b) Ecological Park Quedas do Rio Bonito.
envelope (Bailey & Gatrell, 1995). Data were analyzed with the aid of the Splancs package for the R software (Rowlingson & Diggle, 1993; Bivand & Gebhardt, 2000).
3. RESULTS AND DISCUSSION
A total of 4,318 individuals of the three species were surveyed in both communities, with a predominance of
L. pinaster, with 47.8% of the total frequency, summing 2,065 individuals. The second most abundant was
E. incanus, with 1,156 (26.8%) individuals, followed by V. caruncularis, with 1,097 (26.4%) plants.
All species were more frequent in the protected community, which contained 4,098 individuals, 94.9% of the surveyed plants. The most noticeable difference between communities occurred for L. pinaster, with only 2 individuals in the unprotected community, 0.1% of the total L. pinaster plants. Eremanthus incanus
was the most abundant species in the unprotected community, with 200 individuals, 17.3% of the total
E. incanus plants. Eighteen V. caruncularis individuals were observed in the unprotected community, 1.6% of the total V. caruncularis plants.
With exception of the L. pinaster population in the unprotected community, whose height distribution pattern could not be identified due to the low number of plants, the height distribution for the three species populations showed an inverted-J (negative exponential) pattern (Figure 3), the usual pattern for native tree populations (Oliveira-Filho et al., 1994; Almeida & Cortines, 2008; Sühs & Budke, 2011; Zhang et al., 2010, 2014). The higher frequency of individuals with lower height is a sign of structural stability, since mortality in the superior classes is compensated by recruitment from the inferior classes.
The species with the highest difference between plots was L. pinaster, with only two individuals found in the unprotected community, both of the lowest height class. Since all parts of L. pinaster plants are used for medical purposes, its harvesting is not selective. Therefore, there is no preference for larger individuals and all visible plants might be harvested, reducing density severely in all height classes. Similarly,
V. caruncularis plants are used mainly as ornaments and might also be collected indistinctly, but with less intensity than L. pinaster.
On the other hand, Eremanthus incanus wood is commonly used in the region as tool cables and fence posts; therefore, larger individuals are preferred by the logger. This might be the reason why the frequency of individuals in the superior height classes was so low in the unprotected community. This form of exploitation is harmful to the E. incanus native population and to the exploitation activity itself, since the spatial distribution, the regenerative potential and the maintenance of superior seed-trees in the population are neglected (Pérez et al., 2004; Silva et al., 2008).
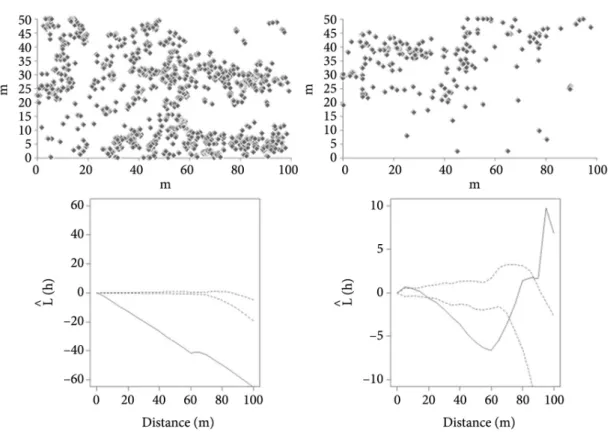
The spatial distribution of the L. pinaster population in the protected community was regular at very short (up to 10 m) and large (more than 70 m) distances, and aggregated at 10-70 m distances (Figure 4). In the
Figure 3. Height density distribution for the three species in the two rupestrian field communities. The numbers above bars indicate the observed frequency without logarithmic transformation.
protected community the E. incanus and V. caruncularis
populations showed regular distribution, with linear decrease in L hˆ( ) as h (search radius) increases
(Figures 5 and 6).
The spatial distribution of plants is influenced by biotic and abiotic factors, and their relative contribution varies with the analysis scale, i.e., the search radius (Dale, 2000; Garzon-Lopez et al., 2014). Rupestrian field areas might have microsites of more fertile and deep soils or rock cracks, promoting the occurrence of plant clusters or “isles” of vegetation. In this study, aggregated distribution in the protected community was observed only for L. pinaster, suggesting that this species is more influenced by the presence of microsites than E. incanus and V. caruncularis. Gianotti et al. (2013) found that the L. pohlii density in a rupestrian field fragment was higher in the plots with higher pH, P-rem and base saturation. Diniz et al. (2010) also observed aggregated distribution for L.
pinaster in a rupestrian field reserve and suggested that vegetative propagation might also contribute to this pattern.
In the unprotected community, the E. incanus
and V. caruncularis populations showed variable distribution patterns according to the search radius (Figures 5 and 6). At short distances (up to 20 m), the pattern for E. incanus was random, changing to regular at medium distances (20-70 m) and aggregated at higher distances. The V. caruncularis distribution pattern was aggregated at short distances (up to 35 m), random from 35 to 60 m and regular at higher distances. It was not possible to describe a pattern for L. pinaster
in the cultivated community due to the low number of individuals found (two plants, 12 m distant from each other).
The changes in the spatial distribution pattern between the protected and the unprotected communities are probably reflects of the anthropogenic activities.
Figure 4. Maps of spatial distribution and Ripley’s L hˆ( ) graphic for the Lychnophora pinaster populations. (a) and
(c): protected community. (b): unprotected community. The continuous line depicts the calculated L hˆ( ) and the
dotted lines delimit the confidence interval for random distribution.
Figura 4. Mapas de distribuição especial e gráfico da função L hˆ( ) de Ripley para as populações de Lychnophora
pinaster. (a) e (c): comunidade protegida. (b): comunidade desprotegida. A linha contínua representa o L hˆ( )
Since there is no control on the kind, intensity or frequency of those activities in the area, it is not possible to describe the relationship between the observed patterns and the disturbance factors. However, it can be inferred, from the changes in the spatial and height distributions, that such anthropogenic activities do not respect the communities’ structure.
Sustainably-managed communities usually show predictable and minimum changes on the spatial and height distribution (Scolforo, 1998). Zhang et al. (2014), for instance, observed slight modifications on the spatial and diameter distribution patterns on managed forests in China. Silva et al. (2008) observed predominance of clustered distribution for E. erythropappus in a managed site at shorter distances (h) and regular or random distribution at larges distances, reflecting the influence of the seed-tree management system in the species’ spatial distribution.
In this study, detrimental alterations in the height and spatial distribution of L. pinaster, E. incanus and
V. caruncularis disturbances were noticed in the cultivated community. The resilience of rupestrian fields is low, given the particularities of the phytophysiognomy and the high endemism (Le Stradic, 2012). Therefore, the reckless exploitation of its resources menaces the conservation of biodiversity.
The creation of conservation unities is probably the best strategy to preserve rupestrian fields (Ribeiro & Freitas, 2010; Mann, 2013). In fact, there are significant rupestrian field communities within conservation units, especially those of direct use, which allow sustainable harvesting (Ribeiro & Freitas, 2010). However, there is little information on the sustainable management of rupestrian field species in those areas. The better understanding of the population patterns in preserved and cultivated sites, preferably evaluating the impacts of specific activities, such as harvesting, would aid the
Figure 5. Maps of spatial distribution and Ripley’s L hˆ( ) graphics for the Eremanthus incanus populations. (a) and (c):
protected community. (b) and (d): unprotected community. The continuous lines depict the calculated L hˆ( ) and the
dotted lines delimit the confidence interval for random distribution.
Figura 5. Mapas de distribuição especial e gráficos da função L hˆ( ) de Ripley para as populações de Eremanthus
incanus. (a) e (c): comunidade protegida. (b) e (d): comunidade desprotegida. As linhas contínuas representam o
( ) ˆ
building of sustainable management strategies for rupestrian fields inside and outside conservation unities.
4. CONCLUSION
• The differences on the height and spatial distribution on the cultivated community are probably due to anthropogenic activities.
• The Ecological Park Quedas do Rio Bonito contribute to the conservation of Eremanthus incanus, Lychnophora pinaster and Vellozia caruncularis populations.
ACKNOWLEDGMENTS
To the owners of the private areas accessed in this study. To M.Sc. Josina Aparecida de Carvalho Leite,
from Fundação Abraham Kasinski, manager of the Ecological Park Quedas do Rio Bonito. To the two anonymous reviewers, for the enriching comments.
SUBMISSION STATUS
Received: 11 july., 2014 Accepted: 12 sept., 2015
CORRESPONDENCE TO
Henrique Nery Cipriani
Centro de Pesquisa Agroflorestal de Rondônia, Empresa Brasileira de Pesquisa Agropecuária – Embrapa, 76815-800, Porto Velho, RO, Brazil e-mail: [email protected]
Figure 6. Maps of spatial distribution and Ripley’s L hˆ( ) graphics for the Vellozia caruncularis populations. (a) and (c):
protected community. (b) and (d): unprotected community. The continuous lines depict the calculated L hˆ( ) and the
dotted lines delimit the confidence interval for random distribution.
Figura 6. Mapas de distribuição especial e gráficos da função L hˆ( ) de Ripley para as populações de Vellozia
REFERENCES
Abreu VG, Correa GM, Silva TM, Fontoura HS, Cara DC, Piló-Veloso D et al. Anti-inflammatory effects in muscle injury by transdermal application of gel with Lychnophora pinaster aerial parts using phonophoresis in rats. BMC Complementary and Alternative Medicine 2013; 13(1): 270-277. http://dx.doi.org/10.1186/1472-6882-13-270. PMid:24138803.
Almeida FS, Cortines E. Estrutura populacional e distribuição espacial de Piptadenia gonoacantha (Mart.) J.F. Macbr. Floresta e Ambiente 2008; 15(2): 18-23. Amaral LP, Ferreira RA, Watzlawick LF, Longhi SJ, Sebem E. Influência da floresta alterada na distribuição espacial de três espécies da Floresta Ombrófila Mista avaliada pela geoestatística. Revista Árvore 2013; 37(3): 491-501. http://dx.doi.org/10.1590/S0100-67622013000300012.
Ayensu ES. Biological and morphological aspects of the Velloziaceae. Biotropica 1973; 5(3): 135-149. http://dx.doi. org/10.2307/2989806.
Bailey TC, Gatrell AC. Interactive spatial data analysis. Harlow Essex: Longman Scientific & Technical; 1995. Biodiversitas. Consulta à Revisão das Listas das Espécies da Flora Ameaçadas de Extinção do Estado de Minas Gerais [online]. 2007. [cited 2014 jan. 29]. Available from: http://www.biodiversitas.org.br/listas-mg/consulta.asp
Bivand R, Gebhardt A. Implementing functions for spatial statistical analysis using the R language. Journal of Geographical Systems 2000; 2(3): 307-317. http://dx.doi. org/10.1007/PL00011460.
Brasil. Ministério das Minas e Energia. Projeto RADAM Brasil. Folhas SF. 23/24 Rio de Janeiro/Vitória: geologia, geomorfologia, pedologia, vegetação e uso potencial da terra. Rio de Janeiro: DNPM; 1983.
Bruzinga JS, Oliveira MLR, Machado ELM, Leite HG, Pereira IM, Nogueira GS. Distribuição espacial de indivíduos adultos de pequi. Scientia Forestalis 2013; 41(98): 249-256.
Carvalho LCS, Gonzaga APD, Machado ELM, Sousa H, Botrel RT, Silva VF et al. Estrutura temporal de sete populações em três fragmentos florestais no Alto Rio Grande, Minas Gerais. Cerne 2009; 15(1): 58-66.
Chiari E, Oliveira AB, Raslan DS, Mesquita AAL, Tavares KG. Screening in vitro of natural products against blood forms of Trypanosoma cruzi. Transactions of the Royal Society of Tropical Medicine and Hygiene 1991; 85(3): 372-374. http://dx.doi.org/10.1016/0035-9203(91)90296-B. PMid:1949141.
Coile NC, Jones SB. Lychnophora (Compositae: Vernonieae), a genus Endemic to the Brazilian Planalto. Brittonia 1981; 33(4): 528-542. http://dx.doi.org/10.2307/2806758.
Curi N, Lima JM, Andrade H, Gualberto V. Geomorfologia, física, química e mineralogia dos principais solos da região de Lavras (MG). Ciência e Prática 1990; 14(2): 297-307. Dale MRT. Spatial pattern analysis in plant ecology. Cambridge: Cambridge University Press; 2000. Diniz ÉS, Pavanelli AP, Soares Júnior FJ. Estrutura populacional de Lychnophora pinaster Mart. em um trecho de campo rupestre no sul de Minas Gerais, Brasil. Pesquisas. Botânica 2010; 61: 191-204.
Eiten G. Brazilian “Savannas”. In: Huntley BJ, Walker BH, editors. Ecology of tropical savannas. Berlin: Verlag; 1982. Espírito-Santo FDB, Shimabukuro YE, Aragão LEOC, Machado ELM. Análise da composição florística e fitossociológica da floresta nacional do Tapajós com o apoio geográfico de imagens de satélites. Acta Amazonica 2005; 35(2): 155-173. http://dx.doi.org/10.1590/S0044-59672005000200006.
Garzon-Lopez CX, Jansen PA, Bohlman SA, Ordonez A, Olff H. Effects of sampling scale on patterns of habitat association in tropical trees. Journal of Vegetation Science 2014; 25(2): 349-362. http://dx.doi.org/10.1111/jvs.12090. Gianotti ARC, Souza MJH, Pereira IM, Machado ELM, Vieira AD, Magalhães MR. Soil and phytosociological characterization of an area with predominance of arnica (Lychnophora pohlii sch. bip.). Revista Brasileira de Ciencia do Solo 2013; 37(3): 565-571. http://dx.doi.org/10.1590/ S0100-06832013000300002.
Giulietti AM, Pirani JR, Harley RM. Espinhaço Range region, eastern Brazil. In: Davis SD, Heywood VH, Herrera MacBryde O, Villa-Lobos J, Hamilton AC, editors. Centres of plant diversity: a guide and strategy for their conservation. Oxford: Information Press; 1997.
Haase P. Spatial pattern analysis in ecology based on Ripley’s K functon: introduction and methods of edge correction. Journal of Vegetation Science 1995; 6(4): 575-582. http://dx.doi.org/10.2307/3236356.
Jacobi CM, Carmo FF, Vincent RC, Stehmann JR. Plant communities on ironstone outcrops: a diverse and endangered Brazilian ecosystem. Biodiversity and Conservation 2007; 16(7): 2185-2200. http://dx.doi. org/10.1007/s10531-007-9156-8.
Joly AB. Conheça a vegetação brasileira. São Paulo: Polígono; 1970.
vulnerable Vellozia gigantea (Velloziaceae) associated with the landscape in the Espinhaço Range, in southeastern Brazil: implications for conservation. Genetica 2011; 139(4): 431-440. http://dx.doi.org/10.1007/s10709-011-9561-5. PMid:21387083.
Macleish NFF. Revision of Eremanthus (Compositae: Vernonieae). Annals of the Missouri Botanical Garden 1987; 74(2): 265-290. http://dx.doi.org/10.2307/2399398. Mann F. A riqueza dos campos rupestres. Revista Ecológico [online] 2013 jul. 22. [cited 2015 jan. 2]. Available from: http://www.revistaecologico.com.br/materia. php?id=67&secao=1021&mat=1111
Menezes NL, Mello-Silva R, Mayo SJ. A cladistic analysis of the Velloziaceae. Kew Bulletin 1993; 49(1): 71-92. http:// dx.doi.org/10.2307/4110200.
Moeur M. Characterizing spatial patterns of trees using stem-mapped data. Forest Science 1993; 39(4): 756-775.
Niklas KJ, Midgley JJ, Rand RH. Tree size frequency distributions, plant density, age and community disturbance: Tree size distributions. Ecology Letters 2003; 6(5): 405-411. http://dx.doi.org/10.1046/j.1461-0248.2003.00440.x. Oliveira AD, Ribeiro ISA, Scolforo JRS, Mello JM, Acerbi Junior FW, Camolesi JF. Market chain analysis of candeia timber (Eremanthus eruthropappus). Cerne 2009; 15(3): 257-264.
Oliveira-Filho AT, Vilela EA, Gavilaness ML, Carvalho DA. Comparison of the woody flora and soils of six areas of montane semideciduous forest in southern Minas Gerais, Brazil. Edinburgh Journal of Botany 1994; 51(3): 355-389. http://dx.doi.org/10.1017/S0960428600001839. Oliveira-Filho AT, Curi N, Vilela EA, Carvalho DA. Variation in tree community composition and structure with changes in soil properties within a fragment of semideciduous forest in south-eastern Brazil. Edinburgh Journal of Botany 2001; 58(1): 139-158. http://dx.doi. org/10.1017/S0960428601000506.
Oliveira-Filho AT, Fluminhan-Filho M. Ecologia da vegetação do Parque Florestal Quedas do Rio Bonito. Cerne 1999; 5(2): 51-64.
Pérez JFM, Scolforo JRS, Oliveira AD, Mello JM, Borges LFR, Camonesi JF. Sistema de manejo para a candeia - Eremanthus erythropappus (DC.) MacLeish - a opção do sistema de corte seletivo. Cerne 2004; 10(2): 257-273. Ribeiro KT, Freitas L. Impactos potenciais das alterações no Código Florestal sobre a vegetação de campos rupestres e campos de altitude. Biota Neotropica 2010; 10(4): 239-246. http://dx.doi.org/10.1590/S1676-06032010000400029. Ripley BD. Spatial statistics. Hoboken: Wiley-Interscience; 2004.
Romero R, Nakajima JN. Espécies endêmicas do Parque Nacional da Serra da Canastra, Minas Gerais. Revista Brasileira de Botanica. Brazilian Journal of Botany 1999; 22: 259-265. http://dx.doi.org/10.1590/S0100-84041999000500006.
Rowlingson BS, Diggle PJ. Splancs: Spatial point pattern analysis code in S-plus. Computers & Geosciences 1993; 19(5): 627-655. http://dx.doi.org/10.1016/0098-3004(93)90099-Q. Salimena FRG, Matozinhos CN, Abreu NL, Ribeiro JHC, Souza FS, Menini Neto L. Flora fanerogâmica da Serra Negra, Minas Gerais, Brasil. Rodriguésia 2013; 64(2): 311-320. http://dx.doi.org/10.1590/S2175-78602013000200008. Samaniego H, Marquet PA. Range structure analysis: unveiling the internal structure of species’ ranges. Theoretical Ecology 2013; 6(4): 419-426. http://dx.doi.org/10.1007/ s12080-013-0177-5.
Santos RM, Barbosa ACMC, Almeida HS, Vieira FA, Santos PF, Carvalho DA et al. Estrutura e florística de um remanescente de caatinga arbórea em Juvenília, norte de Minas Gerais, Brasil. Cerne 2011; 17(2): 247-258. http:// dx.doi.org/10.1590/S0104-77602011000200013. Scolforo JRS. Manejo Florestal. Lavras: UFLA/FAEPE; 1998. Scolforo JRS, Oliveira AD, Camolesi JF. Manejo sustentado das candeias Eremanthus erythropappus (DC.) McLeisch e Eremanthus incanus (Less.) Less. Lavras: NEMAF; 2003. Silva MA, Mello JM, Scolforo JRS, Czanck Júnior L, Andrade IS, Oliveira AD. Análise da distribuição espacial da candeia (Eremanthus erythropappus (DC.) MacLeish) sujeita ao sistema de manejo porta-sementes. Cerne 2008; 14(4): 311-316.
Silva CSJ, Oliveira AD, Rezende JLP, Mello JM, Scolforo JRS. Economic feasibility and rotation age for stands of candeia (Eremanthus erythropappus). Cerne 2012; 18(4): 695-706. http://dx.doi.org/10.1590/S0104-77602012000400020. Sühs RB, Budke JC. Spatial distribution, association patterns and richness of tree species in a seasonal forest from the Serra Geral formation, southern Brazil. Acta Botanica Brasílica 2011; 25(3): 605-617. http://dx.doi. org/10.1590/S0102-33062011000300014.