Submitted26 June 2015 Accepted 4 June 2016 Published5 July 2016 Corresponding author Hideyuki Doi,
Academic editor Jianguo Wu
Additional Information and Declarations can be found on page 11
DOI10.7717/peerj.2173
Copyright 2016 Doi and Takahara
Distributed under
Creative Commons CC-BY 4.0 OPEN ACCESS
Global patterns of conservation research
importance in different countries of the
world
Hideyuki Doi1,2and Teruhiko Takahara3,4
1Institute for Sustainable Sciences and Development, Hiroshima University, Higashi-Hiroshima, Japan 2Graduate School of Simulation Studies, University of Hyogo, Kobe, Japan
3Graduate School of Integrated Arts and Sciences, Hiroshima University, Higashi-Hiroshima, Japan 4Faculty of Life and Environmental Sciences, Shimane University, Matue, Japan
ABSTRACT
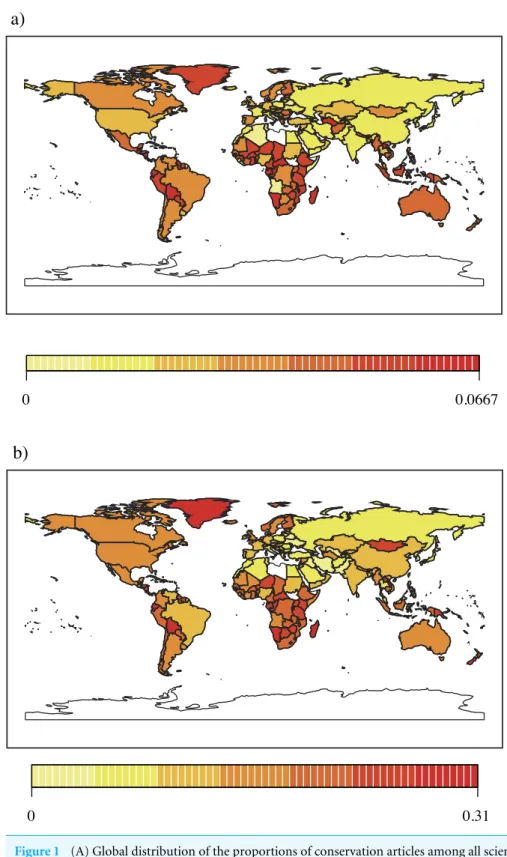
Conservation research is essential to help inform the science-based management of environments that support threatened and endangered wildlife; however, research effort is not necessarily uniform across countries globally. Here, we assessed how the research importance of conservation is distributed globally across different countries and what drives this variation. Specifically, we compared the number of conservation/ecological articles versus all scientific articles published for each country in relation to the number of endangered species, the protection status and number of ecosystems, and the economic status of each country (gross domestic product (GDP) per capita). We observed a significant and positive relationship between the proportion of conservation and ecology articles to all scientific articles with respect to the number of endangered species and the proportion of endangered species that are protected in a country, as well as GDP per capita. In conclusion, knowledge about the conservation and economic status of countries should be accounted for when predicting the research importance of conservation and ecology.
SubjectsBiodiversity, Conservation Biology, Ecology
Keywords Endangered species, Ecosystem management, Scientometric analysis, Biodiversity, Research activity, Publication, Conservation, Conservation biology
INTRODUCTION
The amount of funding and the political climate in a country represent potential factors that drive the level of conservation activity in different countries (e.g.,Amano & Sutherland,
2013;McCreless et al.,2013;Lira-Noriega & Soberón,2015). For example, conservation areas have higher management costs in politically stable countries, along with a greater numbers of citizen initiatives, such as nongovernmental organizations (NGOs) for conservation (McCreless et al.,2013). The national security of a country may also influence the level of bio-diversity conservation activity (Amano & Sutherland,2013). Success and impending oppor-tunities in biodiversity policy and management are related to gaps in biodiversity monitoring (Pereira, Navarro & Martins,2012). The status of biological conservation (e.g., protection activity and endangered species) may also be linked to the extent of conservation research activity in a given country. Thus, the global distribution of conservation research importance in different countries could help assess the global situation of biological conservation.
Three key factors may be related to the research importance of conservation in a given country: (1) biodiversity status, (2) funding and policy, and (3) economic status. The biodiversity status represents the number of endangered species and the area showing a decline in ecosystem functions and biodiversity, which may be associated with the level of conservation actions a given area (Pereira, Navarro & Martins,2012;Archer et al.,2014). The funding and policies on conservation are important factors affecting conservation activity and expanding knowledge about target species (e.g.,Kier et al.,2005;Archer et al.,
2014;Martin et al.,2014). Finally, because developing countries tend to have smaller federal budgets, their level of research activity on conservation ‘‘hot topics,’’ such as the worldwide decline in pollinators, is much lower (Archer et al.,2014).
Scientific importance and activity have been estimated using a variety of parameters, such as the number of publications (Gu,2004;Suluimanov, Frolova & Khasenova,2009), the
num-ber of researchers, and research funding provided by the government (World Bank Group,
2013;Doi, Heeren & Maurage,2014). Bibliometric analyses (e.g., assessing the number of publications) have been extensively used in scientometrics, including assessments on how the number of publications correlate with economic and biological factors, such as research funding and the traits of researchers (Grim,2008). In addition, the number of publications has been used to analyze achievements within specific scientific fields (Doi, Heeren & Maurage,2014; Nakano & Strayer,2014). Such studies primarily focused on the economic/cultural state of countries; however, analyses investigating the importance of a specific field of research remain limited, particularly with respect to the fields of conservation and ecology.
the factors that drive the research importance of conservation and the repercussions on conservation activity in the field.
MATERIALS AND METHODS
Collection of the publication dataFor all countries, we collected all publications from journals categorized as ‘‘Nature and Landscape Conservation’’ in the SCImago database (SJR: SCImago Journal & Country Rank;
retrieved on March 10, 2014; seehttp://www.scimagojr.com/countryrank.phpfor the dataset
and details) from 1996 to 2012 (Falagas et al.,2008). We also collected all publications in journals categorized as ‘‘Ecology,’’ because we assumed that many ecological studies in the ‘‘Ecology’’ category address conservation biology. The data were obtained from the Scopus
database (http://www.scopus.com). In the SCImago database, the journals were assigned
to 313 specific subject categories based on Scopus classification. The country of origin for each paper was designated using the address of all of the coauthors listed in the Scopus database. This method ensured that all of the countries of the authors who collaborated on the paper were listed in the database. Our preliminary analysis showed a remarkable correlation between the number of conservation articles in countries and the number of the outstanding citations of the conservation articles (Pearson’s correlation coefficientr=0.95;
p<0.001). Thus, we only used the number of published articles. We used the proportion of conservation or ecology articles of all scientific publications to normalize the research importance of conservation as a component of all scientific fields. We also determined the mean latitude of the country under study via Wikipedia.
Collection of data on biodiversity and protection
We collected the following data on biodiversity and protection for all countries:
(1) We used the IUCN Red List database from 2008 to obtain the total number of endangered species in each country and region (http://www.iucnredlist.org, accessed on February 21, 2014). These species included reptiles, fishes, mollusks, and other invertebrates and plants (IUCN,1994). We then calculated the percentage of endangered species that were presented in published papers versus all species documented in the 2008 Red List database for each country.
(2) We then calculated the percentage of the endangered species that protected according to the Convention on International Trade in Endangered Species (CITES)
reporting requirements (CITES, 2000). Countries that have not ratified CITES
were recorded as meeting 0% of the requirements. The data were compiled by
the creators of the NationMaster website (
http://www.nationmaster.com/country-info/stats/Environment/Endangered-species-protection, accessed on March 21, 2014). We used mean data from 1996 to 2010.
(3) We calculated the percentage terrestrial protected area using data from the World
Bank Database’s website (http://data.worldbank.org, accessed on February 21, 2014).
wildlife sanctuaries, protected landscapes, or areas managed mainly for sustainable
use. The data sources were obtained from the IUCN and UNEP-WCMC (IUCN,1994;
UNEP-WCMC,2008). The indicator of protected-area coverage was calculated using all the nationally designated protected areas recorded in the World Database on Protected
Areas (WDPA;http://www.protectedplanet.net). The terrestrial protected area was
calculated using the WDPA as the percentage of protected terrestrial biomes weighted by national biomes (%). We used mean data from 1996 to 2012.
Collection of data on economic and research activities
We collected data on economic and research expenditures for all countries. The following indicators of economic and research expenditure were retrieved from the website of the
World Bank Database (http://data.worldbank.org, accessed on September 24, 2015):
(1) We calculated the gross domestic product (GDP) per capita from 1996 to 2012. GDP is the sum of the gross value added by all resident producers in an economy plus any product tariffs and minus any subsidies not included in the value of the products. This metric was calculated without adjustment for depreciation of fabricated assets and also did not account for the depletion and degradation of natural resources. GDP per capita was calculated as GDP divided by the midyear population size in each country.
(2) The percentage of GDP dedicated to research and development expenditure (hereafter,
termedresearch expenditure) was calculated from the mean values for 1996 to 2010.
Research and development covers basic research, applied research, and experimental development. Expenditure for research and development includes current and capital expenditures (both public and private) on creative work undertaken systematically to increase knowledge, including knowledge about humanity, culture, and society, and the use of this knowledge for new practical applications.
(3) We calculated the area covered by each country using data from 2010 from World Bank Database. This value represents total area of each country excluding the area covered by national claims to continental shelf, and exclusive economic zones. Inland water bodies (major rivers and lakes) were included in most cases.
(4) We calculated the mean percentage of forested areas in each country from 1996 to 2010. The percentage of forest cover in each country is the percentage of land used for natural or planted stands of trees of at least 5 m height, whether productive or not. However, the tree stands in agricultural production systems (e.g., fruit plantations and agroforestry systems) and trees in urban parks and gardens were excluded.
(5) We calculated the mean size of the human population of each country from 1996 to 2010. The total population of each country was based on the de facto definition of population, which counts all residents, regardless of legal status or citizenship. Refugees were excluded from the count, as they are not permanently settled in the country of asylum, and are generally considered part of the population of their country of origin.
Statistical analysis
All statistical analyses were performed using R software, version 3.1.0 (R Development Core
among the compiled factors and the proportion of conservation/ecology articles among all scientific publications. We used the Poisson error distribution for GLMs with a log link function prior to analysis, and the normality of each factor was verified using the Shapiro– Wilk normality test (α=0.05). This test showed that all factors significantly deviated from the normal distribution. To account for deviation in the factors and variances, the factor values (except percentage data) were transformed using the log10(x+1) equation for the
analysis of GLMs. After transformation, we once again assessed the distribution using the Shapiro–Wilk normality test, and these transformed factors were not significant. The number of conservation and ecology articles was divided by the number of all scientific publications. Different countries had a different total number of publications; thus, we introduced an offset to GLMs, which is shown by the following equation:
Number of conservation or ecology articles
=β1log10Number of endangered species +β2Proportion of endangered species
+β3Proportion of endangered species under protection
+β4log10terrestrial protected area +β5log10Country area
+β6Percentage of forest area+β7Research expenditure
+β8log10GDP per capita+β9log10Number of population
+β10Mean latitude of country+(Intercept)+offset [log (all publications)]
where the coefficient of the offset was set to 1.0; the offset was on the log scale of the linear predictor according to the stated equation; and log was the function linking GLMs with the
Poisson error distribution (Crawley,2002). We selected the best models using downward
stepwise methods with Akaike Information Criteria (AIC), calculated using the ‘‘PseudoR2’’
function in ‘‘BaylorEdPsych’’ ver. 0.5 package. The pseudo-R2values of the models were
calculated using the ‘‘PseudoR2’’ function method of McFadden and Nagelkerke.
McFadden:R2=1−ln(LM)/ln(L0)
whereLrepresents the likelihood of the model. The rationale in the equation is that ln(L0) is
analogous to the residual sum of squares in the GLM. Thus, theR2value from this formula
corresponds to a proportional reduction in ‘‘error variance’’ and is used as a pseudo-R2
value for GLMs.
Nagelkerke:R2=1−(LR/LF)2/N/1−L2R/N
whereLrepresents the likelihood of the model, while theLRandLFindicate the likelihood of intercept in the model and that of the specified model, respectively.N indicates the number of observations. NagelkerkeR2adjusts the Cox-SnellR2andthe range of values is|1|.
Also, we tested variance inflation factors (VIFs) for the four independent factors in the
GLMs. The maximum VIF for all GLMs (maximum VIF=1.77) was less than 2.0, indicating
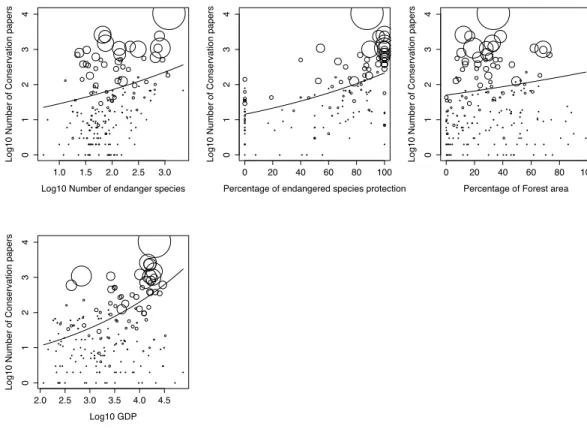
Figure 2 The relations between the proportion of conservation articles in a country and the four ex-planatory factors for the best generalized linear model (GLM).The bubble sizes indicate the number of all scientific publications in a country. The line indicates significant regression of the GLM.
RESULTS
The global distribution of the proportions of conservation and ecology articles among all publications varied among countries (Figs. 1Aand1B), with the proportion of conservation and ecology articles being particularly high in African and Asian countries. The global distribution of the proportion of conservation versus ecology articles was similar among all publications. The number of conservation articles was significantly correlated with the number of ecology articles (r=0.89,p<0.001: Pearson’s correlation coefficient).
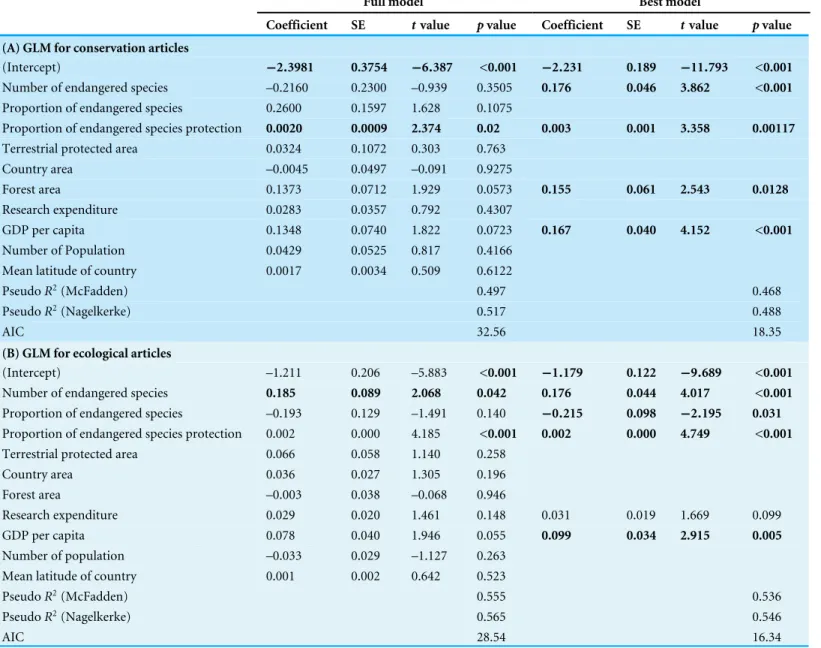
Table 1 The results of analysis of generalized linear models (GLMs) for the proportion of (A) conservation and (B) ecology articles among all scientific publications.
Full model Best model
Coefficient SE tvalue pvalue Coefficient SE tvalue pvalue
(A) GLM for conservation articles
(Intercept) −2.3981 0.3754 −6.387 <0.001 −2.231 0.189 −11.793 <0.001 Number of endangered species –0.2160 0.2300 –0.939 0.3505 0.176 0.046 3.862 <0.001 Proportion of endangered species 0.2600 0.1597 1.628 0.1075
Proportion of endangered species protection 0.0020 0.0009 2.374 0.02 0.003 0.001 3.358 0.00117
Terrestrial protected area 0.0324 0.1072 0.303 0.763
Country area –0.0045 0.0497 –0.091 0.9275
Forest area 0.1373 0.0712 1.929 0.0573 0.155 0.061 2.543 0.0128
Research expenditure 0.0283 0.0357 0.792 0.4307
GDP per capita 0.1348 0.0740 1.822 0.0723 0.167 0.040 4.152 <0.001
Number of Population 0.0429 0.0525 0.817 0.4166
Mean latitude of country 0.0017 0.0034 0.509 0.6122
PseudoR2(McFadden) 0.497 0.468
PseudoR2(Nagelkerke) 0.517 0.488
AIC 32.56 18.35
(B) GLM for ecological articles
(Intercept) –1.211 0.206 –5.883 <0.001 −1.179 0.122 −9.689 <0.001
Number of endangered species 0.185 0.089 2.068 0.042 0.176 0.044 4.017 <0.001
Proportion of endangered species –0.193 0.129 –1.491 0.140 −0.215 0.098 −2.195 0.031 Proportion of endangered species protection 0.002 0.000 4.185 <0.001 0.002 0.000 4.749 <0.001
Terrestrial protected area 0.066 0.058 1.140 0.258
Country area 0.036 0.027 1.305 0.196
Forest area –0.003 0.038 –0.068 0.946
Research expenditure 0.029 0.020 1.461 0.148 0.031 0.019 1.669 0.099
GDP per capita 0.078 0.040 1.946 0.055 0.099 0.034 2.915 0.005
Number of population –0.033 0.029 –1.127 0.263
Mean latitude of country 0.001 0.002 0.642 0.523
PseudoR2(McFadden) 0.555 0.536
PseudoR2(Nagelkerke) 0.565 0.546
AIC 28.54 16.34
Notes.
SE, Standard error.
To evaluate the explanation power for both GLMs, we calculated the McFadden and
Nagelkerke pseudo-R2values, which were around 0.5. These values indicated that the
models explained 50% of variance in the proportion of conservation and ecological articles across all countries.
DISCUSSION
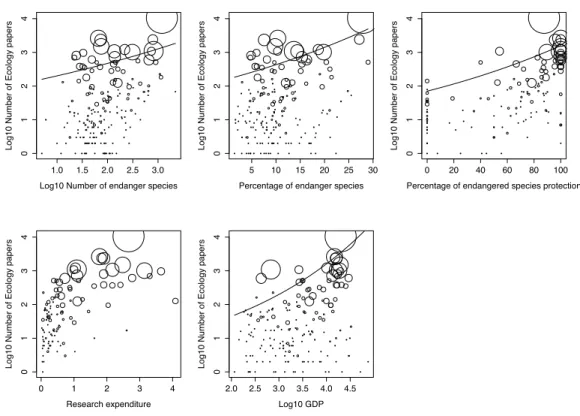
Figure 3 The relations between the proportion of ecology articles in a country and the five explanatory factors for the best generalized linear model (GLM).The bubble sizes indicate the number of all scientific publications in a country. The line indicates significant regression of the GLM.
We found that factors on endangered species, including the number of endangered species and the proportion of endangered species under protection, were positively correlated with the proportion of conservation and ecology articles among all scientific publications in each country. Countries with a higher number of recorded endangered species and a higher proportion of protected endangered species appeared to have a greater proportion of conservation and ecology articles among all scientific publications. This finding is favorable for conservation causes, because countries that need more conservation initiatives for endangered species receive a higher level of importance in conservation research. Similar results were obtained for conservation and ecology articles among all publications. For example, including the four common factors in both of the best models indicated that ecological studies might also be performed in an area that needs conservation effort. This result was probably obtained because ecological studies provide baseline knowledge (e.g., traits and distributions of species) for people working on species conservation.
the state of conservation research importance in a country, such as through the proportion of the endangered species under protection. Thus, the positive correlation of the research importance of conservation with the proportion of the endangered species under protection might indicate that the research importance of conservation increases in a country that shows a higher level of protection activity for endangered species.
We also found that the proportion of forested area represented a significant factor for the best models. Of note, mostly natural forested areas were used in the analysis, not agricultural forests. The proportion of forested area might indicate the proportion of natural habitats in different countries, because forests generally support higher biodiversity
and harbor more endangered species than other habitat types (Gentry,1992;Lindenmayer
& Franklin,2002;Laurance et al.,2012), especially in tropical regions. This observation is particularly true for south Asian and west African countries, where we also observed a higher proportion of conservation and ecology articles (e.g.,Gardner et al.,2009;Laurance et al.,
2012). Thus, forested areas might represent an explanatory factor for the higher proportion of conservation articles in south Asian and west African countries.
Conversely, countries with few endangered species and a lower level of protection activity for endangered species have a lower importance level of conservation research. In such countries, scientific efforts and funds may be concentrated in other research fields. In fact, the proportion of publications in each scientific field differs among countries (Falagas et al.,2008).
Furthermore, the importance of conservation/ecological research increased with increasing GDP on average among different countries, as well as research expenditure (especially for ecological research). Thus, economical status and research funds may be important for increasing the number of publications in conservation/ecological fields. In fact, the economy of a country might represent an important determinant of the total number of scientific publications (Moed et al.,1985;Vinkler,2008). In general, the number and quality of publications increase with research funding (Doi, Heeren & Maurage,2014;
Lin, Chen & Yang,2014). The mean latitude of a country did not show any significant correlation with these factors. However, this type of geographical characteristic might not be related to the number of conservation and ecology articles published.
The results of this study could be applied to other research fields because the level of research importance in a scientific field could be related to social issues, such as climate change. This issue could be investigated in relation to global changes in biodiversity, the generation of energy for engineering projects, or changes to food production in agricultural fields. Furthermore, research importance may be linked to the scale of the measures undertaken against education on global issues (e.g.,Bass et al.,2010;Lamanauskas,2012). Thus, integrated research, involving both bibliometric and biological/political studies, of global datasets could prove interesting.
In conclusion, we showed the global distribution in the research importance of conservation and ecology as a proportion of all articles in the field of science. Statistical modeling of various potential driving factors (conservation, economic, and social states of the countries) showed that the conservation and economic states of countries are important when predicting the research importance of conservation/ecology in the field of science. We showed that the motivation for conservation increases the research importance of conservation and ecological studies.
ACKNOWLEDGEMENTS
We thank the two United Nations agencies—the FAO and the World Bank—for making their databases freely available.
ADDITIONAL INFORMATION AND DECLARATION
Funding
The authors received no funding for this work.
Competing Interests
The authors declare there are no competing interests.
Author Contributions
• Hideyuki Doi conceived and designed the experiments, performed the experiments,
analyzed the data, wrote the paper, prepared figures and/or tables, reviewed drafts of the paper.
• Teruhiko Takahara conceived and designed the experiments, performed the experiments,
wrote the paper, reviewed drafts of the paper.
Data Availability
The following information was supplied regarding data availability:
The raw data has been supplied asTable S1.
Supplemental Information
REFERENCES
Amano T, Sutherland WJ. 2013.Four barriers to the global understanding of biodiversity
conservation: wealth, language, geographical location and security.Proceedings of the Royal Society B: Biological Sciences280:20122649DOI 10.1098/rspb.2012.2649.
Archer CR, Pirk CWW, Carvalheiro LG, Nicolson SW. 2014.Economic and ecological
implications of geographic bias in pollinator ecology in the light of pollinator
declines.Oikos123:401–407 DOI 10.1111/j.1600-0706.2013.00949.x.
Bass MS, Finer M, Jenkins CN, Kreft H, Cisneros-Heredia DF, McCracken SF, Pitman
NCA, English PH, Swing K Villa G, Di Flore A, Voigt CC, Kunz TH. 2010.Global
conservation significance of Ecuador’s Yasuní National Park.PLoS ONE5:e8767
DOI 10.1371/journal.pone.0008767.
CITES. 2000.Convention on international trade in endangered species of wild fauna and
flora. Geneva: United Nations Environment Program.
Crawley MJ. 2002.Statistical computing: an introduction to data analysis using S-PLUS.
Hoboken: John Wiley & Sons.
Doi H, Heeren A, Maurage P. 2014.Scientific activity is a better predictor of Nobel
award chances than dietary habits and economic factors.PLoS ONE9:e92612
DOI 10.1371/journal.pone.0092612.
Falagas ME, Kouranos VD, Arencibia-Jorge R, Karageorgopoulos DE. 2008.
Compar-ison of SCImago journal rank indicator with journal impact factor.FASEB Journal
22:2623–2628DOI 10.1096/fj.08-107938.
Gärdenfors U, Hilton-Taylor C, Mace GM, Rodríguez JP. 2001.The application of
IUCN Red List criteria at regional levels.Conservation Biology15:1206–1212
DOI 10.1046/j.1523-1739.2001.00112.x.
Gardner TA, Barlow J, Chandon R, Ewers RM, Harvey CA, Peres CA, Sodhi NS. 2009. Prospects for tropical forest biodiversity in a human-modified world.Ecology Letters
12:561–582DOI 10.1111/j.1461-0248.2009.01294.x.
Gentry AH. 1992.Tropical forest biodiversity: distributional patterns and their
conserva-tional significance.Oikos63:19–28DOI 10.2307/3545512.
Grim T. 2008.A possible role of social activity to explain differences in publication
output among ecologists.Oikos117:484–487DOI 10.1111/j.0030-1299.2008.16551.x.
Gu Y. 2004.Global knowledge management research: a bibliometric analysis.
Scientomet-rics61:171–190DOI 10.1023/B:SCIE.0000041647.01086.f4.
IUCN. 1994.Guidelines for protected areas management categories. Cambridge and Gland:
IUCN.
IUCN. 2013.IUCN red list of threatened species. Cambridge and Gland: IUCN.Available
atwww.iucnredlist.org.
Kier G, Mutke J, Dinerstein E, Ricketts TH, Küper W, Kreft H, Barthlott W. 2005. Global patterns of plant diversity and floristic knowledge.Journal of Biogeography
32:1107–1116DOI 10.1111/j.1365-2699.2005.01272.x.
Lamanauskas V. 2012.Development of scientific research activity as the basic
Laurance WF, Useche DC, Render J, Kalka M, Bradshaw CJ, Sloan SP, Laurance SG, Campbell M, Abernethy K, Alvarez P, Arroyo-Rodriguez V, Ashton P, Benítez-Malvido J, Blom A, Bobo KS, Cannon CH, Cao M, Carroll R, Chapman C, Coates R, Cords M, Danielsen F, De Dijn B, Dinerstein E, Donnelly MA, Edwards D, Edwards F, Farwig N, Fashing P, Forget PM, Foster M, Gale G, Harris D, Harrison R, Hart J, Karpanty S, Kress WJ, Krishnaswamy J, Logsdon W, Lovett J, Magnusson W, Maisels F, Marshall AR, McClearn D, Mudappa D, Nielsen MR, Pearson R, Pitman N, Van der Ploeg J, Plumptre A, Poulsen J, Quesada M, Rainey H, Robinson D, Roetgers C, Rovero F, Scatena F, Schulze C, Sheil D, Struhsaker T, Terborgh J, Thomas D, Timm R, Urbina-Cardona JN, Vasudevan K, Wright SJ, Arias-G JC, Arroyo L, Ashton M, Auzel P, Babaasa D, Babweteera F, Baker P, Banki O, Bass M, Bila-Isia I, Blake S, Brockelman W, Brokaw N, Brühl CA, Bunyavejchewin S, Chao JT, Chave J, Chellam R, Clark CJ, Clavijo J, Congdon R, Corlett R, Dattaraja HS, Dave C, Davies G, Beisiegel Bde M, Da silva Rde N, Di Fiore A, Diesmos A, Dirzo R, Doran-Sheehy D, Eaton M, Emmons L, Estrada A, Ewango C, Fedigan L, Feer F, Fruth B, Willis JG, Goodale U, Goodman S, Guix JC, Guthiga P, Haber W, Hamer K, Herbinger I, Hill J, Huang Z, Sun IF, Ickes K, Itoh A, Ivanauskas N, Jackes B, Janovec J, Janzen D, Jiangming M, Jin C, Jones T, Justiniano H, Kalko E, Kasangaki A, Killeen T, King HB, Klop E, Knott C, Koné I, Kudavidanage E, Ribeiro JL, Lattke J, Laval R, Lawton R, Leal M, Leighton M, Lentino M, Leonel C, Lindsell J, Ling-Ling L, Linsenmair KE, Losos E, Lugo A, Lwanga J, Mack AL, Martins M, McGraw WS, McNab R, Montag L, Thompson JM, Nabe-Nielsen J, Nakagawa M, Nepal S, Norconk M, Novotny V, O’Donnell S, Opiang M, Ouboter P, Parker K, Parthasarathy N, Pisciotta K, Prawiradilaga D, Pringle C, Rajathurai S, Reichard U, Reinartz G, Renton K, Reynolds G, Reynolds V, Riley E, Rödel MO, Rothman J, Round P, Sakai S, Sanaiotti T, Savini T, Schaab G, Seidensticker J, Siaka A, Silman MR, Smith TB, De Almeida SS, Sodhi N, Stanford C, Stewart K, Stokes E, Stoner KE, Sukumar R, Surbeck M, Tobler M, Tscharntke T, Turkalo A, Umapathy G, Van Weerd M, Rivera JV, Venkataraman
M, Venn L. 2012.Averting biodiversity collapse in tropical forest protected areas.
Nature489:290–294DOI 10.1038/nature11318.
Lin PH, Chen JR, Yang CH. 2014.Academic research resources and academic quality: a
cross-country analysis.Scientometrics101:109–123DOI 10.1007/s11192-014-1362-z.
Lindenmayer DB, Franklin JF. 2002.Conserving forest biodiversity: a comprehensive
multiscaled approach. Washington, D.C.: Island Press.
Lira-Noriega A, Soberón J. 2015.The relationship among biodiversity, governance,
wealth, and scientific capacity at a country level: disaggregation and prioritization.
AMBIO44:391–400 DOI 10.1007/s13280-014-0581-0.
Margules CR, Pressey RL. 2000.Systematic conservation planning.Nature405:243–253
DOI 10.1038/35012251.
Conservation opportunities across the world’s anthromes.Diversity and Distributions
20:745–755DOI 10.1111/ddi.12220.
McCreless E, Visconti P, Carwardine J, Wilcox C, Smith RJ. 2013.Cheap and nasty? The
potential perils of using management costs to identify global conservation priorities.
PLoS ONE8:e80893DOI 10.1371/journal.pone.0080893.
Moed HF, Burger WJM, Frankfort JG, Van Raan AF. 1985.The use of bibliometric
data for the measurement of university research performance.Research Policy
14:131–149DOI 10.1016/0048-7333(85)90012-5.
Nakano D, Strayer DL. 2014.Biofouling animals in fresh water: biology, impacts,
and ecosystem engineering.Frontiers in Ecology and Environment12:167–175
DOI 10.1890/130071.
Pereira HM, Navarro LM, Martins IS. 2012.Global biodiversity change: the bad, the
good, and the unknown.Annual Review of Environment and Resources37:25–50
DOI 10.1146/annurev-environ-042911-093511.
Primack RB. 1993.Essentials of conservation biology. Vol. 23. Sunderland: Sinauer
Associates.
R Development Core Team. 2013.R: a language and environment for statistical
comput-ing. Vienna: R Foundation for Statistical Computing.
Ratcliffe D. 2012.A nature conservation review: volume 1: the selection of biological sites of
national importance to nature conservation in Britain. Vol. 1. Cambridge: Cambridge University Press.
Suluimanov EZ, Frolova VA, Khasenova SK. 2009.The scientometric analysis
of the activity of Kazakh scientists based on the materials of the SCOPUS DB (Netherlands).Scientific and Technology Information Processing 36:290–297
DOI 10.3103/S0147688209050074.
UNEP-WCMC. 2008.State of the world’s protected areas 2007: an annual review of global
conservation progress. Cambridge: UNEP-WCMC.
Vinkler P. 2008.Correlation between the structure of scientific research, scientometric
indicators and GDP in EU and non-EU countries.Scientometrics74:237–254
DOI 10.1007/s11192-008-0215-z.
World Bank Group. 2013.World Development Report 2014: risk and
opportunity-managing risk for development. Washington, D.C.: World Bank Publications.