Impact of farm size on milk quality in the Brazilian dairy industry
according to the seasons of the year
Impacto do tamanho da propriedade na qualidade do leite na indústria leiteira brasileira de acordo com as estações do ano
Marcos Inácio Marcondes1* Virgínia Lúcia Neves Brandão2 Gustavo Antônio Torres Ferreira1 Alex Lopes da Silva1
ISSNe 1678-4596
INTRODUCTION
Milk produced in Brazil has been seen as having poor quality because it is associated with the large number of small farms and because of the absence of hygiene practices. However, there are few studies proving or quantifying the lower quality of the milk produced on small properties, as described by ALLORE et al. (1997), where they affirm that
smaller herds would be more affected by higher levels of somatic cell count (SCC) than larger ones (BATTAGLINI et al., 2013; FRANÇA et al., 2017). Yet, consultants from several regions report the existence of small farms producing milk with high quality, or no correlation between farm range production and milk quality (BORGES et al., 2013; INGHAM et al., 2011), which reinforces the importance of studies tracing the quality profile of Brazilian dairy farms.
1Departamento de Zootecnia, Universidade Federal de Viçosa (UFV), 36570-000, Viçosa, MG, Brasil. E-mail: marcosinaciomarcondes@gmail.com. *Corresponding author.
2Department of Animal Sciences, University of Florida, Gainesville, Florida, United States of America.
ABSTRACT: Milk produced in Brazil has been seen as having poor quality and is associated with a large number of small farms. However,
there are few studies demonstrating lower quality of milk of small properties. Thus, this study aimed to evaluate the relationship between production scale on dairy farms and milk quality, how it behaviors throughout the year and set goals to improve quality according to each strata. A total of 21,917 analysis of 409 farmers conducted from January 2005 to December 2014 were used. To study the database, the properties were divided according to monthly average daily milk yield: 10 to 100; 100 to 200; 200 to 500; 500 to 1,000; and 1,000 to 5,000L of milk day-1. The data showed that dairy farming is predominantly carried out on small-scale production properties; however, the highest volumes are produced by a small number of producers. Additional data reveals that milk quality can vary because of distinct factors as nutritional condition and feed supply. Quality of the milk produced should be a matter of concern for the entire milk-production chain, because it still has problems such as high total bacterial count, high somatic cell count and low solids.
Key words: milk production, milk quality, somatic cell count, total bacterial count.
RESUMO: O leite produzido no Brasil é visto como tendo má qualidade e associado a grande número de pequenas propriedades. No entanto,
não há estudos que demonstram menor qualidade do leite dessas pequenas propriedades. Assim, este estudo teve como objetivo avaliar a relação entre a escala de produção e qualidade do leite, como é o comportamento ao longo do ano, e definir metas para melhorar a qualidade de acordo com cada estrato. Utilizou-se um total de 21.917 análises de 409 agricultores realizadas de Janeiro/2005 a Dezembro/2014. As propriedades foram divididas de acordo a produção de leite: 10 a 100; 100 a 200; 200 a 500; 500 a 1000; e 1000 a 5000L de leite dia-1. Os dados mostraram que a produção leiteira é predominantemente realizada em pequenas propriedades; no entanto, os volumes mais elevados são produzidos por um pequeno número de produtores. Dados adicionais revelam que a qualidade do leite pode variar devido a fatores como condição nutricional e alimentos para animais. Concluiu-se que a qualidade do leite deve ser um motivo de preocupação para toda a cadeia de produção de leite, porque ainda tem problemas tais como elevada contagem bacteriana total e contagem celular somática e baixo teor de sólidos.
Palavras-chave: produção de leite, qualidade do leite, contagem de células somáticas, contagem bacteriana total.
Milk is considered to be of good quality when it contains properties such as pleasant taste, high nutritive value, absence of pathogens and contaminants, low SCC, and low microbial load. Thus, a study evaluating the contents of protein, fat, SCC, and total bacterial count (TBC) should comprehend a large portion of the abovementioned concepts and aim to fill the current gaps in the international literature. Moreover, it is of utmost importance to isolate the effects caused by the challenges of small and large producers from temporal effects present on any property.
The average composition of the milk is 87.4% water and 12.6% total solids, and of this amount of total solids, 3.9% are fat, 3.2% are protein, 4.6% are lactose, and 0.90% are minerals and vitamins (HARDING, 1995). However, standard composition presents variations influenced by several factors, e.g. individual, breed, herd, region, year, month, SCC, lactation period, age, and milking period (GONZÁLEZ et al., 2001). Despite the current common knowledge on the variation of SCC, TBC, fat and protein across the year and milk production, only a few studies have studied deeply these issues, even acknowledging its importance (GONÇALVES et al., 2014; BORGES et al., 2013). Thus, our objectives were to divide rural properties according to daily milk production, and to evaluate milk quality within each production scale throughout the seasons. With these results, we aimed to establish improvement goals in milk quality applicable to each dairy production volume range. The evaluated variables were: SCC, TBC, percentage of fat, and percentage of protein in the milk.
MATERIAL AND METHODS
The study was conducted in the Central-West region of Minas Gerais State, Brazil. The used data were provided by the dairy milk industry of the region, and pertain to producers participating in the cooperative of milk producers located in the municipalities of Itaúna, Carmo do Cajuru, Itatiaiuçu, Mateus Leme, Juatuba and Igaratinga. This study utilized 21,917 analyses from 409 producers in the period of January 2005 to December 2014. It is typical from this region utilize crossbred animals. None of the herds in this analysis is composed of pure breed and the most used are Holstein and Gyr crossbreds (BORGES et al., 2013); however, the greater proportion of Holstein degree blood animals is observed for high production farms.
In farms bellow 200 liters, it is common to use a shorter forage supplementation, with elephant grass and sugar cane. For farms above 200 liters, it is usually used semi-confined system, in which animals are supplemented with elephant grass (fresh or silage) and sugar cane in the dry period (at least six months). For farms between 500 to 5,000 liters, maize silage is commonly utilized as supplementation in dry period. There is also sugar cane and sorghum silage as an option.
Milk samples were collected twice monthly directly from the cooling tanks. Each sample was collected to a previously labeled, standardized sterile bottle using a disinfected collection device and stored in a styrofoam box with ice until arriving at the laboratory. After milk homogenization, two 40-mL bottles were collected. Preservative azidiol was present in one of the bottles for TBC and the other bottle contained preservative bronopol for the SCC and analysis of concentrations of fat and protein; both preservatives were used in tablet form. The milk samples were collected directly from the expansion tanks by the milk carriers, who were trained to perform the collection, with quarterly recycling. Somatic cell count was obtained by flow cytometry, using a CombiSystem 2300 device (IDF Standard 148A:1995). Total bacterial count was performed by flow cytometry on a Bactocount IBC device (Bentley Instruments, 2002). The technique of absorption by mean infrared on a 2300 device (IDF Standard 141C, 2000) was adopted to analyze fat, protein, lactose and total solids.
The properties were divided according to the monthly average daily-milk-production into the following levels: 0 to 100; 100 to 200; 200 to 500; 500 to 1,000; and 1,000 to 5,000L of milk per day. Production strata were evaluated using a completely randomized design in a mixed model, where the production system was considered as fixed effect, and year and month associated with year were controlled as random effects of the model. The data of year and month were analyzed in a completely randomized design in an arrangement of split-plots repeated over time, having years as plots and months as sub-plots.
described by DABDOUB & SHOOK (1984), and the TBC values were transformed into base-10 logs (logTBC). However, to easy comprehension, all lsmeans were back transformed to SCC and TBC to be presented in the figures.
RESULTS AND DISCUSSION
In the division of the farms per production stratum, we can observe that within the analyzed period, 11.32% of the samples were from producers who account for 44.25% of the production. In contrast, the vast majority of the samples (88.68%) are from producers that correspond to 55.75% of the supplied milk (Table 1). This production structure observed, wherein a small portion of the producers produce a large portion of the milk volume and the majority of farmers produce a small volume, is a characteristic also present in the national population as a whole (ASSIS et al., 2005).
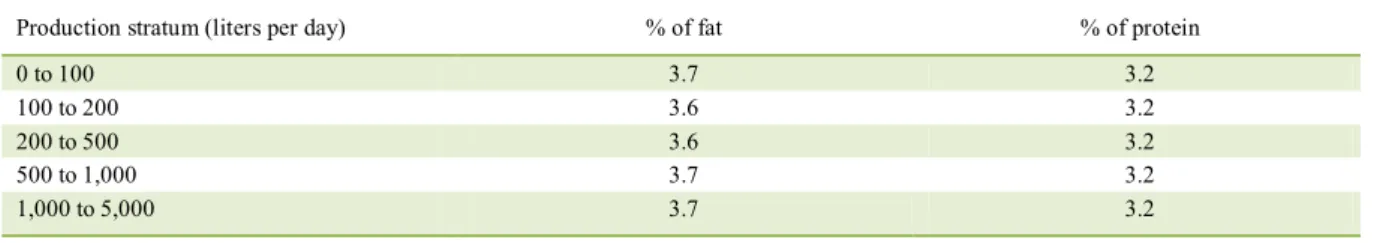
Although, the typical production system in the region consists of smaller herds using animals with higher degree of zebu blood and lower production per cow and larger herds using animals with higher degree of Holstein blood and greater production per cow, solids production (percentages of fat and protein) showed slight variations among the production strata (Table 2).
Total bacterial count decreased as the milk yield increased (Figure 1), as also observed in other studies (BUENO et al., 2008). Values reported in the present study were higher than the limit of 100,000cfu mL-1 recommended by Normative Instruction 62. We
can observe that this index needs to be improved in all analyzed strata, though most of the worst rates are reported in the smaller producers. Contamination during the milking process is the main factor to increase the TBC in milk in the industry (BUENO et al., 2008), and these results can be improved by training producers with regard to the need to adopt milking management practices all year long. Some of these
important measures are: proper cleanliness and hygiene of the milking equipment and tools; hygiene of the operators; cleanliness and hygiene of the environment; and proper handling and preparation of the animals during milking. GUERREIRO et al. (2005) obtained significant reductions in the total bacterial count after having the producers trained on the properties. It is common to observe a higher frequency of deficiency in the management of the herd and production techniques in small properties (VALEEVA et al., 2005). As the milk yield is increased, the application of important actions to improve its quality also increases (NERO et al., 2009). Thus, the actions of the industry, through its technical staff, must be applied to the producers, with greater emphasis on small-scale.
Analyzing the results of the somatic cell count within the different production strata (Figure 1), it can be concluded that it is an index in which all production levels require improvements, with no difference observed for farmers producing less than 1,000L. For those producing between 1,000 and 5,000L there was a slight decrease in SCC compared with the other groups; however, in absolute values, this variation is too small, indicating that there is also need to improve this index in this production range.
Although, this result demonstrates the need to improve SCC in all production levels, better results can be obtained with the stratification of the producers, since there will be a differentiated demand within the group. For instance, while small producers face problems in identifying and treating mastitis, use of older animals, improper handling at milking, etc., large-scale producers find greater challenges in promoting an adequate environment with a higher animal density, identifying animals with chronic mastitis, among others. The SCC control levels should be established - from the simplest to the most complex measures, and that each producer change their level when incorporating the previous management in their farm routine.
Table 1 - Division of dairy properties analyzed according to milk production.
Production stratum (L day-1) Distribution of producers (%) Milk yield (%)
0 to 100 35.9 9.0
100 to 200 29.6 17.4
200 to 500 23.2 29.3
500 to 1,000 7.9 22.5
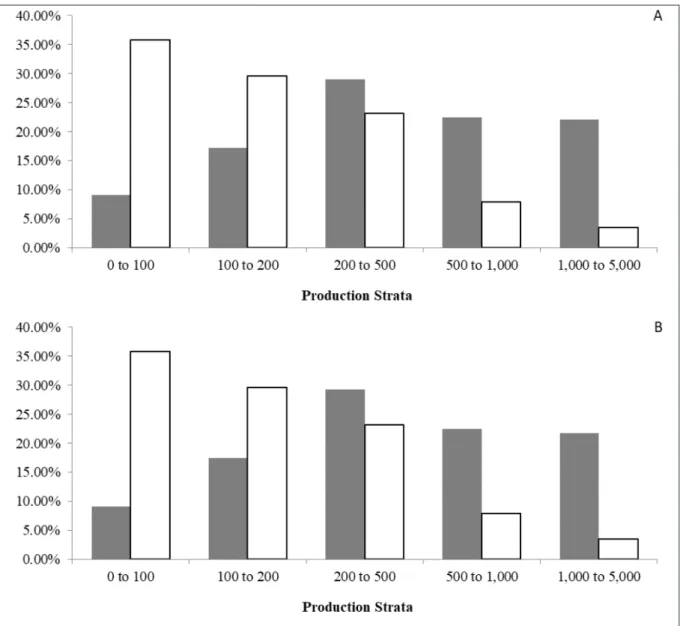
The period of the year affected milk chemical composition, and this is linked to variations in availability and quality of the feeds (GONZALEZ et al., 2004). This is related to a decrease in milk yield stemming from a lack of feed, directly linked to reduction in the pasture quality and a consequent drop in production of solids (MARCONDES et al., 2014). This scenario is very common in Brazilian farms, because of lack of feed supplementation and grass and forage management. Considering all treatments, the end of rainy season and beginning of dry season is the period with the best milk protein levels (Figure 2a); fat percentage starts to rise at the same period but is more
constant all over the dry season (producers on the strata up to 500 L) (Figure 2b).
For larger producers, 1,000 Lto 5,000L, fat percentage peak takes place in middle and end of dry season, respectively. Lower variability in fat percentage for larger producers is explained by the supply of a better-quality diet. In addition, producers in this range have greater access to technical assistance, which helps formulating and adjusting animal diets in different seasons, and systems of production, such as confined and semi-confined; this condition is rarer for smaller producers. However, for smaller producers, there is a great dependence upon the pasture. In this
Table 2 - Comparison of milk fat and protein in different properties strata.
Production stratum (liters per day) % of fat % of protein
0 to 100 3.7 3.2
100 to 200 3.6 3.2
200 to 500 3.6 3.2
500 to 1,000 3.7 3.2
1,000 to 5,000 3.7 3.2
Figure 1 - Total bacterial count (TBC; solid bar) and somatic cell count (SCC; empty bar) per production stratum. Different small letters
indicate significant production strata differences for SCC, and different capital letters indicate significant production strata
Figure 2 - Concentration of milk protein (A) and milk fat (B) in different production strata throughout the year from 2005 to 2014.
case, a nutritional deficiency that occurred because of the reduction in the pasture quality that occurs in the dry period implies a more marked reduction in protein production (MARCONDES et al., 2014). Milk protein content is affected by the dietary protein content when it is below the minimum recommended (MUHLBACH et al., 2000), which is typical of low-productivity pasture-based systems with little or no supplementation
than the first one, once that it partially matches with calving season. Intending to reduce the impact of dry season, small producers often offer chopped elephant grass (fresh); however, as a tropical forage grass, it has quality limitations during dry season, resulting in the problems indicated in figures 1 and 2. Conversely, rainy season is a problem for large-scale producers (above 500L), once it holds the lowest rates during the year, affecting the percentage of fat and protein in milk, leading to a drop. This happens because it is when the rain starts and pastures consequently start to regrow, there is an increase in animal production, which means an improvement in diet quality, at the
same time as the dilution effect increases. Overall, the largest producers showed lower variability over the year over the smaller producers (Figure 2); the average values were; however, very close to each other, and it should be stressed that the producers of highest volume were those to show the highest fat percentage.
The last two strata represent 11.3% of the producers and account for 33.25% of the volume, 44.64% of the fat, and 44.19% of the protein. From the genetic standpoint, there is a latent potential for production of solids not used in the herd of smaller producers (Figure 3), which can be improved by the action of technicians and training of producers,
enhancing the quality of milk and milk products. In this context, another complicating factor for the small producer is that the cost with collection is much higher than that for the bigger producer, especially when considering that there is no differential in solids production (Table 2) to favor the small producer, which could promote a compensating effect. These data are of great importance for the dairy industry as they make it possible to evaluate the profitability of each producer, especially if inserted in the context of the milk-collection logistics.
CONCLUSION
It can be concluded that dairy activity is mostly developed on small properties, but the largest volumes (and solids) are produced by a small number of producers. Also, considering the seasons and the strata, the percentage of milk fat and protein increase at the end of the rainy period and beginning of dry season on strata between 100 and 1,000; however, when these two variables are within the strata 5,000 they present more constancy over the year. Finally, the quality of the milk produced should be a matter of concern for the entire milk-production chain, because it still presents problems such as high total bacterial count, high somatic cell count and low solids content in all evaluated strata.
REFERENCES
ALLORE, H.G. et al. Effects of season, herd size, and geographic region on the composition and quality of milk in the Northeast.
Journal of Dairy Science, v.80, n.11, p.3040-3049, 1997.
Available from: <http://www.journalofdairyscience.org/article/ S0022-0302(97)76271-4/fulltext>. Accessed: Apr. 13, 2015. doi: 10.3168/jds.S0022-0302(97)76271-4.
ASSIS, A.et al. Milk production systems in Brazil. Juiz de Fora: Embrapa Gado de Leite, 2005. 5p. (Technical circular 85).
BATTAGLINI, A.P.P. et al. Dissemination of good production practices and characterization of dairy production. Archivos
de Zootecnia, v.62, n.237, p.151-154, 2013. Available from:
<http://scielo.isciii.es/scielo.php?script=sci_arttext&pid =S0004-05922013000100017>. Accessed: Mar. 18, 2015. doi: 10.4321/S0004-05922013000100017.
BORGES, L.R. et al. Milk quality according to the daily range in farm production in the mesoregion central mineira and oeste of Minas Gerais regions, Brazil. Arquivo Brasileiro de Medicina
Veterinária e Zootecnia, v.65, n.4, p.1239-1246, 2013. Available
from: <http://www.scielo.br/scielo.php?script=sci_arttext&pid =S0102-09352013000400041>. Accessed: Jun. 12, 2015. doi: 10.1590/S0102-09352013000400041.
BUENO, V.F.F. et al. Total bacterial count: relationship to milk composition and period of the year in Goiás state, Brazil.
Revista Brasileira de Ciência Veterinária, v.15, n.1, p.40-44,
2008. Available from: <http://doi.editoracubo.com.br/10.4322/ rbcv.2014.194>. Accessed: Feb. 10, 2015. doi: 10.4322/ rbcv.2014.194.
DABDOUB, S.A.M.; SHOOK, G.E. Phenotypic relations among milk yield, somatic count cells, and mastitis. Journal of Dairy
Science, v.67, p.163-164, 1994.
FRANÇA, M.M. et al. Mastitis causative agents and SCC relationship with milk yield and composition in dairy cows.
Archivos de Zootecnia, v.66, p.253, p.45-49, 2017. Available from:
<https://www.uco.es/ucopress/az/index.php/az/article/view/2124>. Accessed: Jul. 23, 2017. doi: 10.21071/az.v66i253.2124.
GONÇALVES, A.C.S. et al. Technical assistance and rural extension: a case study that demonstrates its importance for the improvement of milk production. Revista Brasileira de Higiene
e Sanidade Animal, v.8, n.3, p.47-61, 2014. Available from:
<http://www.higieneanimal.ufc.br/seer/index.php/higieneanimal/ article/view/178>. Accessed: Apr. 23, 2015. doi: 10.5935/1981-2965.20140116.
GONZÁLEZ, F.H.D. et al. Uso do leite para monitorar a
nutrição e o metabolismo de vacas leiteiras. Porto Alegre:
UFRGS, 2001. 77p.
GONZALEZ, H.H. et al. Evaluation of milk quality on different months of year at Pelotas dairy basin, RS. Revista Brasileira
de Zootecnia, v.33, n.6, p.1531-1543, 2004. Available from:
<http://www.scielo.br/scielo.php?script=sci_arttext&pid =S1516-35982004000600020>. Accessed: May 25, 2015. doi: 10.1590/S1516-35982004000600020.
GUERREIRO, P.K. et al. Qualidade microbiológica de leite
em função de técnicas profiláticas no manejo e produção.
Ciência e Agrotecnologia, v.29, n.1, p.216-222, 2005.
Available from: <http://www.scielo.br/scielo.php?pid=S1413-70542005000100027&script=sci_abstract&tlng=pt>. Accessed: Feb. 11, 2015. doi: 10.1590/S1413-70542005000100027.
HARDING, F. Compositional quality: milk quality. Glasgow: Blackie Academic and Professional, 1995. 165p.
INGHAM, S. et al. Comparison of bulk-tank standard plate count and somatic cell count for Wisconsin dairy farms in three size categories. Journal of Dairy Science, v.94, n.8, p.4237-4241, 2011. Available from: <http://www.journalofdairyscience.org/ article/S0022-0302(11)00429-2/abstract>. Accessed: May 10, 2015. doi: 10.3168/jds.2011-4310.
MARCONDES, M.I. et al. Evaluation of raw milk quality in different production systems and periods of the year. Revista
Brasileira de Zootecnia, v.43, n.12, p.670-676, 2014. Available
from: <http://www.scielo.br/scielo.php?script=sci_arttext&pid =S1516-35982014001200670>. Accessed: Jun. 26, 2015. doi: 10.1590/S1516-35982014001200007.
MUHLBACH, P.R.F. Aspectos nutricionais que interferem a qualidade do leite. In: Encontro anual da ufrgs sobre nutrição de ruminantes, 73-103., 2000, Porto Alegre, Brasil. Anais... Novos
desafios para produção leiteira do Rio Grande do Sul. Porto Alegre:
Universidade Federal do Rio Grande do Sul - UFRGS, 2000.
v.29, n.2, 386-390, 2009. Available from: <http://www.scielo. br/scielo.php?pid=S01010612009000200024&script=sci_ abstract&tlng=pt>. Accessed: Mar. 23, 2015. doi: 10.1590/S0101-20612009000200024.
PERES, J.R.O. Leite como ferramenta de monitoramento nutricional. In: GONZÁLEZ, et al. Uso do leite para monitorar
a nutrição e metabolismo de vacas leiteiras. Porto Alegre:
UFRGS, 2001. p.29-43.
SAS INSTITUTE INC. SAS/STAT(r) 9.2 User’s guide. Cary, NC, 2008. Available from: <http://support.sas.com/documentation>. Accessed: Nov. 13, 2014.