ABSTRACT: Programs designed to enhance milk quality have been used to motivate dairy farm-ers to improve the quality of the raw milk they produce. The objective of this study was to evalu-ate the association between a milk quality payment program and four indicative variables of milk quality, by testing bulk tank somatic cell count (SCC), bulk tank total bacterial count (TBC), fat (FAT) and protein (PROT) percentages over three years in four dairy cooperatives in Southern Brazil. We used a multiple regression econometric model estimated from market data of milk delivered by farmers to the cooperatives. Bulk tank milk samples (n = 19,644) were monthly col-lected. The data set was analyzed for the effects of seasonality, average daily volume of milk, the award/penalty, producer, and cooperatives on SCC, TBC, FAT and PROT. Results suggested an association between the adoption of a payment program based on milk quality and the reduction of SCC and TBC. Nevertheless, the program seems to have not contributed to increase fat and protein milk percentages. This information may help the dairy industry in developing countries to conceive strategies to enhance overall milk quality.
Keywords: bacterial count, somatic cell count, premium payment, milk composition, milk production
Introduction
Milk quality is an important aspect of dairy produc-tion that affects milk processing, its technological proper-ties, and thus economical efficiency (Auldist and Hubble, 1998; Barbano et al., 2006). Dairy industries worldwide have instituted penalty and premium programs to provide incentives for dairy producers to improve milk quality (Schukken et al., 1992a,b; Nightingale et al., 2008). Most of these programs are focused on bulk tank milk qual-ity, such as total bacterial count (TBC), somatic cell count (SCC) and milk composition (percentage of fat, protein and solids non-fat) (Draaiyer et al., 2009; Dekkers et al., 1996). Premium payments motivate farmers to produce high quality milk without disrupting the milk supply chain of the market they operate (Nightingale et al., 2008). However, the degree that this inducement affects overall milk quality in developing countries is not documented in the literature. Brazilian milk ordinance currently allows an upper limit of 750,000 cells mL-1 both for bulk tank
so-matic cell and total bacterial counts (Brasil, 2002), which might compromise trading of the country’s dairy products, as legal limits for SCC and TBC at international level are generally lower. In Europe, for instance, the EEC directive 92/46 established legal limits of 400,000 cells mL-1 and
100,000 cfu mL-1, for SCC and TBC, respectively, while
the USA and Canada have limited SCC to 750,000 and 500,000 cells mL-1, respectively (Sargeant et al., 1998).
Quality premiums paid to producers have proven their effectiveness in influencing milk quality (Schukken et al., 1992a; Valeeva et al., 2007; Nightingale et al., 2008).
We hypothesized that monetary incentives offered to dairy producers can encourage them to improve overall milk quality parameters, not only those related to udder health and milk hygiene procedures (i. e., somatic cell and
total bacterial counts, respectively), but also milk com-position (percentages of milk fat and protein). Thus, the aim of this study was to evaluate the influence of a milk quality payment program adopted by a dairy central co-operative in Brazil on milk quality of dairy products by monthly testing of bulk tank somatic cells (BTSCC), bulk tank total bacterial count (BTTBC), fat (FAT) and protein (PROT) percentages during three years.
Materials and Methods
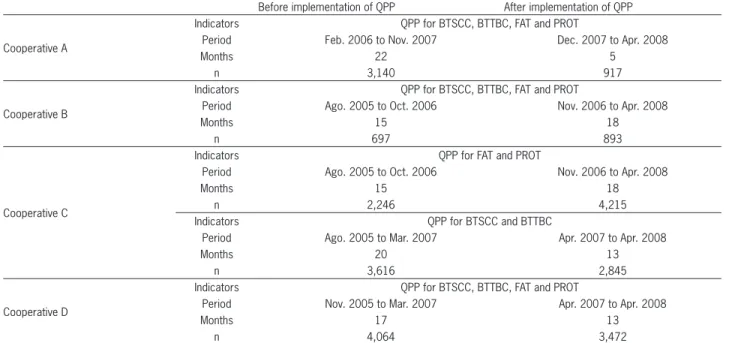
Data used for this study were collected from a dairy central cooperative in Southern Brazil, from Aug. 2005 through Apr. 2008, accumulating 19,644 observa-tions. Each observation corresponds to the total volume delivered by a producer in one month, with monthly weighted average indicators of BTSCC, BTTBC, FAT and PROT. This central cooperative was a tier of four small cooperatives (A, B, C and D) which had, respectively, 203, 92, 321 and 459 permanent dairy producers whose total milk production was delivered to the central co-operative (Table 1). Milk delivered during the period of data collection was mainly destined for powder milk production.
Bulk tank samples were monthly collected and milk composition analyses were performed using Bentley 2000 (Bentley Instruments, Chaska, MN) to determine fat and protein percentages, Somacount 300 (Bentley In-struments, Chaska, MN) and BactoScan (Foss Electric, Hillerød, Denmark) for somatic cell and total bacteria counts, respectively.
The recorded data set included producer identifi-cation (anonymous and individually identified by a nu-merical code), and the monthly producer’s BTSCC and BTTBC, FAT and PROT percentages, and whether dairy Received December 13, 2011
Accepted August 08, 2012
1USP/FMVZ – Depto. de Medicina Veterinária Preventiva e
Saúde Animal.
2USP/FMVZ – Depto. de Nutrição e Produção Animal,
Av. Duque de Caxias Norte, 225 – 13635-900 – Pirassununga, SP – Brasil.
*Corresponding author <[email protected]>
Edited by: Daniel Scherer de Moura
Quality based payment program and milk quality in dairy cooperatives of Southern
Bruno Garcia Botaro1, Augusto Hauber Gameiro2, Marcos Veiga dos Santos2*
producer had/had not achieved milk quality goals adopt-ed by the cooperative for each parameter. Observations were omitted for missing values in any analyzed category. Each producer’s daily average volume of milk (L day-1)
was obtained by dividing the total volume delivered by a producer on a monthly basis. Premium was the grant paid to the producer if quality targets were achieved.
The development of the premium program adopted by the cooperative was based on targets currently estab-lished by federal regulation (Brasil, 2002) for dairy farm-ers’ bulk tank somatic cell and total bacterial counts in the period of the study, and also balanced to fulfill market demands for milk quality. Before implementation of the premium program, the central cooperative focused on capacity-building and knowledge delivery to each of its cooperatives’ dairy extension personnel. It was intended that each one of the four cooperatives, by means of their extension personnel, would be responsible for training farmers in management practices to achieve milk qual-ity goals (Nettle et al., 2003). The adopted extension approach was based on individual on-farm guidelines,
as recommended by FAO and IDF Guide to milking hy-giene practices (FAO, 2011). After the accomplishment of the extension program, dairy farmers began to be paid according to the newly established milk payment policy (Table 2), which was applied to all dairy farmers deliver-ing milk to the cooperative.
The payment policy consisted of a fixed premium per penalty on the milk price paid to the dairy producer, according to their achievement of each bulk tank param-eter targeted by the central cooperative (Table 2), accord-ingly to the implementation schedule adopted by each of the four cooperatives. Cooperative B first implemented premiums and penalties to milk price in Nov. 2006. The cooperative C introduced incentives for FAT and PROT at the same time; later, in Apr. 2007, it included the oth-er two variables. Coopoth-erative D began to offoth-er incentives by Apr. 2007, while cooperative A started by Dec. 2007. The adopted different schedules were due to internal factors of each cooperative, e. g., number of dairy pro-ducers and number of dairy propro-ducers assisted by dairy extension personnel. Furthermore, the central
coopera-Table 1 – Sample composition.
Before implementation of QPP After implementation of QPP
Cooperative A
Indicators QPP for BTSCC, BTTBC, FAT and PROT
Period Feb. 2006 to Nov. 2007 Dec. 2007 to Apr. 2008
Months 22 5
n 3,140 917
Cooperative B
Indicators QPP for BTSCC, BTTBC, FAT and PROT
Period Ago. 2005 to Oct. 2006 Nov. 2006 to Apr. 2008
Months 15 18
n 697 893
Cooperative C
Indicators QPP for FAT and PROT
Period Ago. 2005 to Oct. 2006 Nov. 2006 to Apr. 2008
Months 15 18
n 2,246 4,215
Indicators QPP for BTSCC and BTTBC
Period Ago. 2005 to Mar. 2007 Apr. 2007 to Apr. 2008
Months 20 13
n 3,616 2,845
Cooperative D
Indicators QPP for BTSCC, BTTBC, FAT and PROT
Period Nov. 2005 to Mar. 2007 Apr. 2007 to Apr. 2008
Months 17 13
n 4,064 3,472
Number of observations (n = 19,644). QPP: Quality Premium Program; BTSCC: bulk tank somatic cells; BTTBC: bulk tank total bacterial count; FAT: fat percentage; PROT: protein percentage.
Table 2 – Premium and penalty program adopted by the central cooperative according to bulk tank somatic cell (BTSCC) and total bacterial counts (BTTBC) and stringency through the observed years of the payment policy.
Year after implementation Parameter Premium/Penalty (US$)1
+ 0.0083 + 0.0028 0.0000 - 0.0111
1st BTSCC (
×
103 cells mL-1) ≤ 400 401 up to 700 701 up to 1,000 > 1,000BTTBC (
×
103 cfu mL-1) ≤ 100 101 up to 400 401 up to 1,000 > 1,000+ 0.0139 + 0.0056 0.0000 - 0.0083
2nd BTSCC (
×
103 cells mL-1) ≤ 300 301 up to 500 501 up to 750 > 750
tive had adopted a variable BTSCC and BTTBC premi-um/penalty policy, with the level of stringency based on the targeted parameters over two years of evaluation of the payment program. For milk with fat concentration higher than 3.2 %, a premium of US$ 1.44 per kg of ex-tra fat was paid; for protein concenex-tration above 3.1 %, a premium of US$ 2.77 per kg of extra protein was paid (Note: US$ 1.00 = R$ 1.80).
All data were analyzed using SAS version 9.2 (SAS Institute, Cary, NC, USA). Descriptive analysis of milk variables by month was performed using PROC MEANS. To identify possible effects over each of these four vari-ables, ANOVA was conducted using PROC GLM. Tested effects were: seasonality, daily average volume of milk, premium payment/deduction, producer and cooperative. Seasonality was modeled as suggested by Nightingale et al. (2008), using a sine-cosine function to represent an-nual variation of the effect over variables. The seasonal function was:
β1Sin[2π × (month / 12)] + π2Cos [2π × (month / 12)]
Once relevant effects were identified, multiple linear regression models were estimated, attempting to measure such influence over the four considered milk quality variables, using PROC MIXED:
BTSCC=α+ β1 Sin (.)+β2 Cos(.)+β3 QPP+β4CoopB+β5CoopC +β6CoopD+ε
BTTBC, FAT and PROT were estimated using simi-lar models.
The econometric linear multiple regression model estimated α and β1 to β6 parameters. Seasonality effect was adjusted by β1 and β2 parameters, as previously de-scribed. The variable Quality Premium Program period (QPP) is of particular interest to this research, as it aimed to measure the effect of the premium program imple-mentation on the considered milk quality parameters. A dummy variable represented QPP, being 0 (zero) for the milk delivered before the institution of the program, and 1 (one) for milk delivered to the cooperatives af-ter the program implementation. A set of other dummy variables was included to estimate each cooperative’s influence on milk quality parameters. Once the four
co-operatives were involved (A, B, C and D), only three other dummy variables had to be include in the model to avoid perfect multicollinearity (a statistical phenomenon in which two or more predictor variables in a multiple regression model are correlated) (Greene, 1993).
The units for the dependent variables were: cells mL-1 for BTSCC, cfu mL-1 for BTTBC, and percentage (%)
for FAT and PROT. The choice of variables was based on two grounds: i) proposed by previous studies (Nightingale et al., 2008), Schukken et al. (1992a) and Schukken et al. (1992b); and ii) variables covered by the quality program of the analyzed cooperatives: the data were obtained from the cooperatives themselves, so that the variables used were those included in their programs.
Results and Discussion
The total number of observations used in this study was 19,644, collected from 1,075 dairy farmers. Average, number of observations (sample size) and stan-dard deviation for BTSCC, BTTBC, FAT and PROT of milk of the four cooperatives are shown in Table 3. Dur-ing the study, 10.4 % of the delivered milk exceeded the Brazilian BTSCC legal limit of 750,000 cells mL-1.
Simi-larly, 35.8 % was above the Brazilian BTTBC legal limit of 750,000 cfu mL-1.
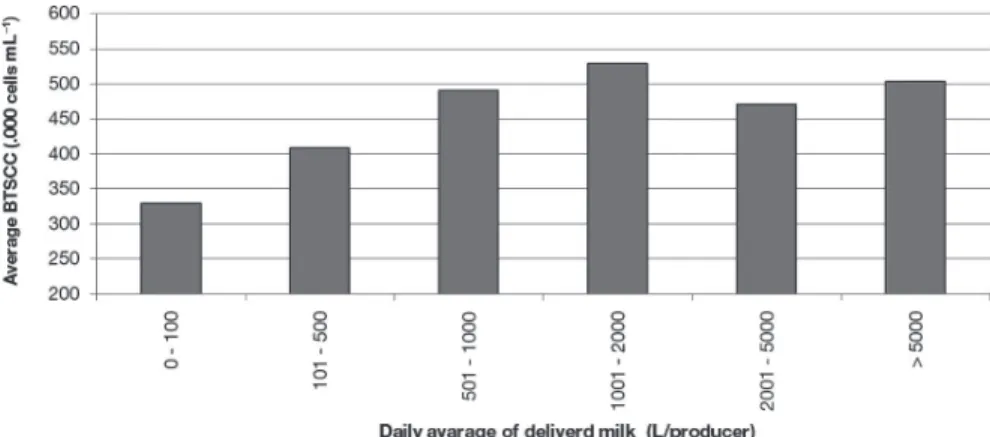
BTSCC and BTTBC were influenced by all variables included in the model (Table 4). Figure 1 shows average BTSCC and average BTTBC according to season variation in the course of the study, whilst Figure 2 illustrates the rela-tion between average BTSCC and the size of the farms, rep-resented by the daily average volume of delivered milk.
FAT of delivered milk was influenced by premium incentives and dairy producer. Seasonality and coopera-tive significantly affected fat percentage as well. Daily
Table 3 – Descriptive analysis of the bulk tank somatic cell (BTSCC), total bacterial counts (BTTBC), fat (FAT), and protein (PROT) of milk shipped by the central cooperative during the period of data collection.
Variable Mean Standard deviation
BTSCC (
×
103cells mL-1) 393.87 316.77BTTBC (
×
103cfu mL-1) 1,543.88 2,926.72FAT (%) 3.50 0.52
PROT (%) 3.22 0.17
Number of observations (n = 19,644).
Table 4 – ANOVA of seasonality, daily volume, premium/penalty, producer, cooperative on bulk tank somatic cell (BTSCC), total bacterial count (BTTBC), fat (FAT) and protein (PROT).
Cause of variation
BTSCC
P BTTBC P FAT P PROT P
Sum of squares Sum of squares Sum of squares Sum of squares
Sine 482,334 < .0001 127,269,792 < .0001 5.65 < .0001 0.351 < .0001
Cosine 182,906 0.0119 14,690,910 0.0054 9.66 < .0001 1.67 < .0001
Daily volume 252,471 0.0031 16,508,878 0.0032 0.00005 0.9510 0.028 0.0019
Premium/Penalty 21,848,213 < .0001 252,741,325 < .0001 443.46 < .0001 0.235 < .0001
Producer 301,453,198 < .0001 21,929,851 < .0001 111.51 < .0001 0.0143 < .0001
Cooperative 6,268,321 < .0001 90,934,817 < .0001 0.453 < .0001 0.0046 0.1949
volume delivered did not exert any influence on this pa-rameter. PROT was influenced by all variables included in the model, except the cooperative one.
The results for the multiple linear regression mod-els are presented in Table 5. The set of dummy values related to cooperatives was not included on the PROT model as the cooperative did not seem to affect PROT (Table 4). When data concerning the four cooperatives were considered, three dummy values had to be used (CoopB, CoopC and CoopD). Thus, the set for coopera-tive “A” was: CoopB = 0;CoopC = 0; CoopD = 0; the one related to cooperative “B” was: CoopB = 1; CoopC
= 0; CoopD = 0; and so on. The daily volume was not
included in the regression model, due to the lack of this information for some observations of the sample.
Implementation of the milk quality premium pro-gram had a significant effect on BTSCC, reducing it by more than 65,000 cells mL-1 (Table 5). The reduction of
65,000 cells mL-1 was obtained as a result of parameter
estimates (Table 5) by the regression model for binary variable that represented the beginning of the period of payment for quality. The variable had value 0 (zero) for the months before the beginning of the program, and it had value 1 (one) after it had started. The fact that the
parameter has been estimated at 65,000 suggests that - irrespective of other variables - the SCC was reduced by this magnitude after the implementation of the program. BTSCC throughout the period was 393,870 cells mL-1
(Table 3), thus suggesting that the reduction of 65,000 was representative.
The regression model could ratify the cooperative effect, with the three dummy values being similar (be-tween 84 and 88
×
103 cells mL-1), and with significanteffect on BTSCC. The estimated regression parameter for BTSCC of cooperative “A” was higher compared to the others. Considering cooperative effects, for “B”, “C” and “D” the program itself was able to reduce the original counting of somatic cell by around 16 % [88.25) for B; 84.29) for C; 65.07/(489.349-87.59) for D], whilst values observed in cooperative “A” (65.07/489.349) had achieved reductions up to 13.3 %.
BTTBC was also reduced by the milk quality pre-mium program (Table 5). Nevertheless, in contrast to the SCC, there was a wide original variation among coop-eratives. For cooperative “B”, the payment program con-tributed to a reduction of more than 90 % in the over-all BTTBC [1,044.72/(1,486.09-355.70)]. For cooperatives “C”, “D” and “A” the reductions were 39.4 % [1,044.72/ Figure 1 – Monthly average of bulk tank somatic cell count (BTSCC) and total bacterial count (BTTBC) during the study period.
(1,486.09+1,167.33)], 58.7 % [1,044.72/(1,486.09+292.89)] and 70.3 % (1,044.72/1,486.09), respectively.
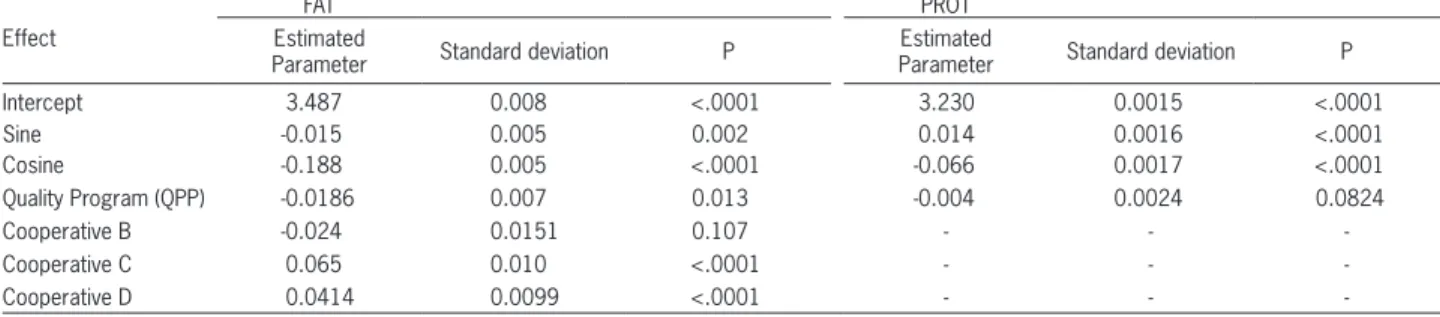
The adoption of the milk quality-based payment varied among cooperatives, and had an interestingly, small negative association between fat percentage of milk (Table 6). In contrast, seasonality influenced BTSCC and BTTBC. The cooperative effect was not uniform as well. Dairy pro-ducers from cooperatives C and D had delivered milk with higher fat percentages than those from cooperatives B and A. The reason for this could not be established, and further research is suggested to clarify this point.
Similarly to fat percentage, milk protein was not af-fected by the adoption of a quality premium program by the cooperatives considered in this study, when the mul-tiple regression model was used to evaluate it. Seasonality showed effect on protein levels (Table 4). Because the mod-el analyzed real data from the market instead of data from experimental results specifically designed for this proposal, it was not possible to control the adoption of correct and accurate recommendations for the producers.
The premium per penalty payments had signifi-cant association with quality parameters established by the central cooperative. Results of this study suggested that the producer was the only factor that influenced all dependent variables. Farmer’s average daily volume de-livered did not contribute significantly to milk quality at-tributes, in contrast to information previously shown by other studies (Nightingale et al., 2008). The BTSCC
pat-tern observed (specifically the peak in rainy seasons and the reduction in dry ones - Figure 1) was expected and followed the same trends as described in previous re-ports on similar climate conditions (Botaro et al., 2008).
Establishment of a milk quality premium program played a key role in motivating dairy producers to focus their efforts on farm management practices that control mastitis, as referred by BTSCC. Previous studies have shown the impact of penalty (Sargeant et al., 1998) and premium approaches (Nightingale et al., 2008) on lower-ing population mean SCC. Although a penalty program had shown to be effective in decreasing overall mean BMSCC (Sargeant et al., 1998), further reductions would be achieved if a combination of a penalty program for high BTSCC. Financial incentives targeting low BTSCC were adopted (Nightingale et al., 2008), as it was imple-mented by the central cooperative here studied. How-ever, the multivariate model used in the present study could not distinguish which parameter was the most ef-fective on improving mastitis control at the farm level. Another area of concern yet to be investigated is the apparent adverse effect that a BTSCC reduction pro-gram has on the increase of subclinical cases of mastitis treated during lactation. This is especially important and must be studied in this kind of scenario once the over-treatment of subclinical mastitis aiming at reducing SCC (Østerås and Sølverød, 2009) may lead to an increased risk of inhibitor violations.
Table 5 – Effects of bulk tank somatic cell count (BTSCC) and total bacterial count (BTTBC) by each of the considered factors estimated by the multiple linear regression model.
Effect
BTSCC BTTBC
Estimated
parameter Standard deviation P
Estimated
parameter Standard deviation P
--- ×
103 cells mL–1---
--- ×
103 cfu mL–1---Intercept 489,349 5.02 <.0001 1,486.09 45.53 <.0001
Sine 5.94 3.12 0.056 102.31 28.30 0.0003
Cosine -4.80 3.22 0.1364 236.64 29.25 <.0001
Quality Program (QPP) -65.07 4.66 <.0001 -1,044.72 42.21 <.0001
Cooperative B -88.25 9.38 <.0001 -355.70 85.027 <.0001
Cooperative C -84.29 6.34 <.0001 1,167.33 57.47 <.0001
Cooperative D -87.59 6.19 <.0001 292.89 56.07 <.0001
Number of observations (n = 19,644).
Table 6 – Effects on fat (FAT) and protein percentages (PROT) by each of the considered factors estimated by the multiple linear regression model.
Effect
FAT PROT
Estimated
Parameter Standard deviation P
Estimated
Parameter Standard deviation P
Intercept 3.487 0.008 <.0001 3.230 0.0015 <.0001
Sine -0.015 0.005 0.002 0.014 0.0016 <.0001
Cosine -0.188 0.005 <.0001 -0.066 0.0017 <.0001
Quality Program (QPP) -0.0186 0.007 0.013 -0.004 0.0024 0.0824
Cooperative B -0.024 0.0151 0.107 - -
-Cooperative C 0.065 0.010 <.0001 - -
-Cooperative D 0.0414 0.0099 <.0001 - -
Although BTSCC is the key regulatory component in international trading for milk (Van Schaik et al., 2002), BTTBC is another cutoff element in dairy markets. In terms of bacterial counts, approximately 36 % of all milk delivered in the considered sample was not in compli-ance with the national regulatory criteria for milk quality (< 750,000 cfu mL-1). The adoption of a combined
pro-gram targeting those variables resulted in a significant improvement of milk hygiene quality in the sampled milk of the cooperatives. Thus, a combined premium + penalty program would not only help the country’s dairy industry in achieving better quality dairy products but also in suiting requirements enforced by internal dairy regulations. Nevertheless, these efforts have contributed to neither increased FAT nor PROT percentages. On the other hand, seasonality had a higher impact on milk composition compared with udder health and milk hy-giene status (Tables 5 and 6).
There was an association between the incentive program in the cooperatives and the three out of the four considered dependent milk quality variables. Protein per-centage was the only unresponsive variable influenced by the cooperative. All the results regarding cooperatives have special importance for the Brazilian dairy industry, once the sector has been experiencing huge structural changes, such as steady increase in milk production, concentration of the processing sector (Barros et al., 2001), and stricter BTSCC and BTTBC regulations (Brasil, 2002).
The results suggest that the “producer-cooper-ative” relationship had affected milk quality, once the extension program coordinated by the cooperative cer-tainly played a central role in this process. In other words, financial rewards induce changes in milk quality, especially decreases in bulk tank somatic cell and total bacterial counts. However, some changes regarding milk composition were not quite evident by rewarding dairy producer and might be dependent on other effective long-term factors such as herd nutrition, animal breed-ing and genetics. Such strategies might be related, for instance, to dairy farmer awareness, institutional com-munication, educational activities and motivation, and shall be addressed in further studies.
Acknowledgements
To Dr. Adrian Molenaar, from AgResearch Ltd., Ruakura Research Centre (Hamilton, New Zealand), for his assistance with the textual analysis and careful Eng-lish revision of this manuscript.
References
Auldist, M.J.; Hubble, I.B. 1998. Effects of mastitis on raw milk and dairy products. Australian Journal of Dairy Technology 53: 28–36.
Barbano, D.M.; Y. Ma; Santos, M.V. 2006. Influence of raw milk quality on fluid milk shelf life. Journal of Dairy Science 89 (sup.): E15–19.
Barros, G.S.C.; Galan, V.B.; Guimarães, V.A.; Bacchi, M.R.P. 2001. Sistema agroindustrial do leite no Brasil = Dairy Agri-industrial system in Brazil. Embrapa Informação Tecnológica, Brasília, DF, Brazil (in Portuguese).
Botaro, B.G.; Lima, Y.V.R.; Aquino, A.A.; Fernandes, R.H.R.; Garcia, J.F.; Santos, M.V. 2008. Effect of beta-lactoglobulin polymorphism and seasonality on bovine milk composition. Journal of Dairy Research 75: 176–181.
Brasil. 2002. Instrução normativa nº 51, de 20 de setembro de 2002. Regulamento Técnico de Produção, Identidade e Qualidade do Leite Cru Refrigerado = Technical Regulation of Production, Identity and Quality of Refrigerated Raw Milk. Diário Oficial da União, Brasília, DF, Brazil (in Portuguese). Dekkers, J.C.M.; VanErp, T.; Schukken, Y.H. 1996. Economic
benefits of reducing somatic cell count under the milk quality program of Ontario. Journal of Dairy Science 79: 396–401. Draaiyer, J.; Dugdill, B.; Bennett, A.; Mounsey, J. 2009. Milk
testing and payment systems resource book: a practical guide to assist milk producer groups. Food and Agriculture Organization, Rome, Italy.
Food and Agriculture Organization [FAO]. 2011. Milking hygiene. In: Guide to good dairy farming practice. FAO, Rome, Italy. p. 17–21. (Animal Production and Health Guidelines, 8). Available at: http://www.fil- idf.org/Public/Download.php?media=38836 [Accessed Dec. 8, 2011]
Greene, W. 1993. Econometric Analysis. Prentice-Hall, Englewood Cliffs, NJ, USA. Nettle, R.A.; Weatherley, J.; Paine, M. 2003. Groups orone to one? Rethinking extension delivery: learningsfrom the dairy industry. Australasian Pacific Extension Network Forum, p. 26–28. Available at: http://www.regional.org.au/au/apen/2003/ refereed/075nettlera.htm [Accessed Oct. 20, 2010]
Nightingale, C.; Dhuyvetter, K.; Mitchell, R.; Schukken, Y.H. 2008. Influence of variable milk quality premiums on observed milk quality. Journal of Dairy Science 91: 1236–1244. Østerås, O; Sølverød, L. 2009. Norwegian mastitis control
program. Irish Veterinary Journal 62: 26–33.
Sargeant, J.M.; Schukken, Y.H.; Leslie, K.E. 1998. Ontario bulk milk somatic cell count reduction program: progress and outlook. Journal of Dairy Science 81: 1545–1554.
Schukken, Y.H.; Leslie, K.E.; Weersink, A.J.; Martin, S.W. 1992a. Ontario bulk milk somatic-cell count reduction program. 1. Impact on somatic-cell counts and milk quality. Journal of Dairy Science 75: 3352–3358.
Schukken, Y.H.; Leslie, K.E.; Weersink, A.J.; Martin, S.W. 1992b. Ontario bulk milk somatic cell count reduction program. 2. Dynamics of bulk milk somatic-cell counts. Journal of Dairy Science 75: 3359–3366.
Valeeva, N.I.; Lam, T.J.G.M.; Hogeveen, H. 2007. Motivation of dairy farmers to improve mastitis management. Journal of Dairy Science 90: 4466–4477.