Northeast Brazil: a general characterization
GUILHERME C. LESSA, JOSÉ M. L. DOMINGUEZ, ABÍLIO C.S.P. BITTENCOURT and ARNO BRICHTA
Laboratório de Estudos Costeiros, Centro de Pesquisa em Geofísica e Geologia, Instituto de Geociências Universidade Federal da Bahia, Campus Ondina, 40210-340 Salvador-BA, Brazil
Manuscript received on April 28, 1999; accepted for publication on September 11, 2000; presented byKenitiro Suguio
ABSTRACT
The Todos os Santos Bay, located on northeastern Brazil, is the second largest coastal bay in the country, after São Marcos Bay. The three main drainage basins convey an average of 120 m3/s of freshwater towards
the bay, the majority of it, however, held by a dam in Paraguaçu River since 1985. The original average freshwater inflow was two orders of magnitude smaller than the estimated tidal discharge through the main bay entrance, and the oceanographic characteristics of the bay, as indicated by bay salinity measurements, are clearly marine. The tides are semi-diurnal, and are amplified up the bay by a factor of 1.5. Shallow water constituents become more important as the tide propagates along Paraguaçu Channel and Paraguaçu River, where they generate time asymmetries that change between spring and neap tides. Currents in the bay are mainly bi-directional, and are stronger during the ebbing tide in most of the bay. Offshore, relatively strong tidal currents appear to be felt in a radius of about 10 km, where they are superimposed on winds driven currents orientated to the southwest.
Key words:Tides, Baía de Todos os Santos, Tidal currents.
1. INTRODUCTION
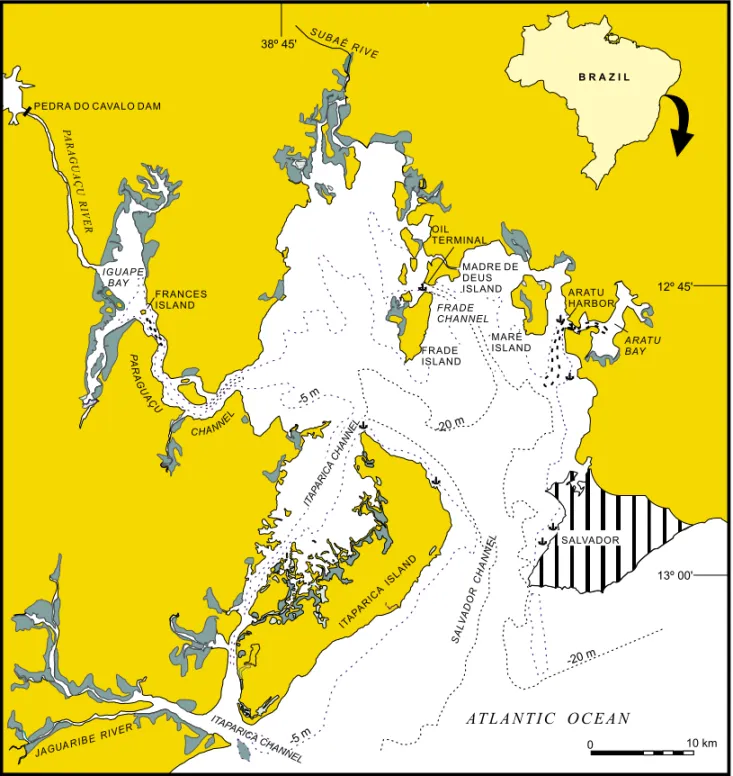
The Todos os Santos Bay (TSB) is the second largest coastal indentation of the Brazilian coastline, with an area of 1.086 km2. It is highly populated along its northern shore, where over 3 million people is devoted to fishing, agriculture and industrial activi-ties. On the water, ships transport crude oil, ore and all kinds of commodities to six different terminals (Figure 1).
Despite its social and economic significance, published information concerning the oceano-graphic characteristics of the TSB is minimal. The
Correspondence to: Guilherme C. Lessa E-mail: [email protected]
Brazilian Hydrographic Authority (DHN) published tidal current charts for Madre de Deus and Salvador harbors (Figure 1) (Diretoria de Hidrografia e Nave-gação 1963, 1975). Sparse measurements of tem-perature, salinity and suspend sediment concentra-tion along the main secconcentra-tion of the bay and Paraguaçu Channel (Figure 1) were performed by Wolgemuth et al. (1981) and Barreto and Paredes (1995), and short term (maximum of 12 hrs) current monitoring were performed close to TSB entrance and Francês Island (Wolgemuth et al. 1981, Barreto and Paredes 1995).
JAGUA RIB E RIVER
PEDRA DO CAVALO DAM
P
A R A
G UA
ÇU
CHANNE
L
P ARAGUAÇU
RIVER
SAL VADOR
CHANNEL
ITAPARICA CHANNEL
ARATU BAY
ARATU HARBOR OIL
TERMINAL
IGUAPE BAY
FRANCES ISLAND
12º 45'
13º 00' 38º 45'
ITAP ARICA
ISLAND
A T L A N T I C O C E A N S UBA É
R IVER
SALVADOR
0 10 km
-20m -20m
-5m
-5m
FRADE ISLAND
FRADE CHANNEL
MADRE DE DEUS ISLAND
MARÉ ISLAND
B R A Z I L
ITAP ARICA
CHANNEL
Fig. 1 – Location map of Todos os Santos Bay and general bathymetric contour. Darker areas are intertidal mangrove vegetation and small symbols locate maritime terminal facilities of various kinds.
et al. 1998), with great emphasis devoted to numer-ical modeling. As an additional contribution to the ongoing investigation effort, this paper presents an analysis of a significant amount of unpublished data related to water level and tidal current measurements made available by the Brazilian Hydrographic Au-thority (DHN). It is hoped that these results will help in the calibration of the numerical models and
im-prove the understanding of the water flow within the TSB.
2. STUDY AREA
water exchange between the bay and the ocean. Av-erage and maximum depths in the Salvador Channel are 25 m and 102 m, respectively, in relation to the DHN datum, herein adopted as a reference level (0 m DHN∼=1.30 m below MSL – TÁBUA DE MARÉS DE SALVADOR 1997). The Itaparica Channel, to the southwest, presents a smoother topography with an average depth of 10 m (Figure 1). Maximum depths inside the TSB are associated with the strait that separates Frades and Madre de Deus islands (over 60 m) and the entrances to Aratu Bay (30 m) and Iguape Bay (50 m) (Figure 1). Iguape Bay re-ceives the discharge from Paraguaçu River, which forms a major fluvial delta in the central part of the bay. Very shallow depths (<5m) characterizes the northern extremity of the TSB.
Well developed ebb-tidal deltas in front of both entrances of the TSB suggest ebb-dominant condi-tions for most of the bay. Both deltas appear to be associated with the hydraulic barrier imposed on the littoral drift by the tidal currents exiting the bay, given that sediment exportation by the bay itself ap-pears to be minimum (see Lessa et al. 2000). In Salvador Channel, a small flood orientated lobe in the western margin (identified in satellite images) suggests that flood tidal sediment transport prevails locally.
Coral reefs border the southeastern side of Ita-parica and Frade islands, as well as the southern side of Maré Island (Leão and Brichta 1996), all exposed to the E-SE swell. This suggests that ma-rine, and not estuama-rine, conditions exist at least in the eastern half of the TSB (see also Wolgemuth et al. 1981). The non-existence of living coral reefs in the west side of the bay seems to be more related to the a higher turbidity of the water than to variations in water temperature or salinity (Z. Leão, Geology Dept. – UFBA, per. comm. 1997).
The climate is tropical humid, with a ten-year average mean air temperature of 25.3◦C close to
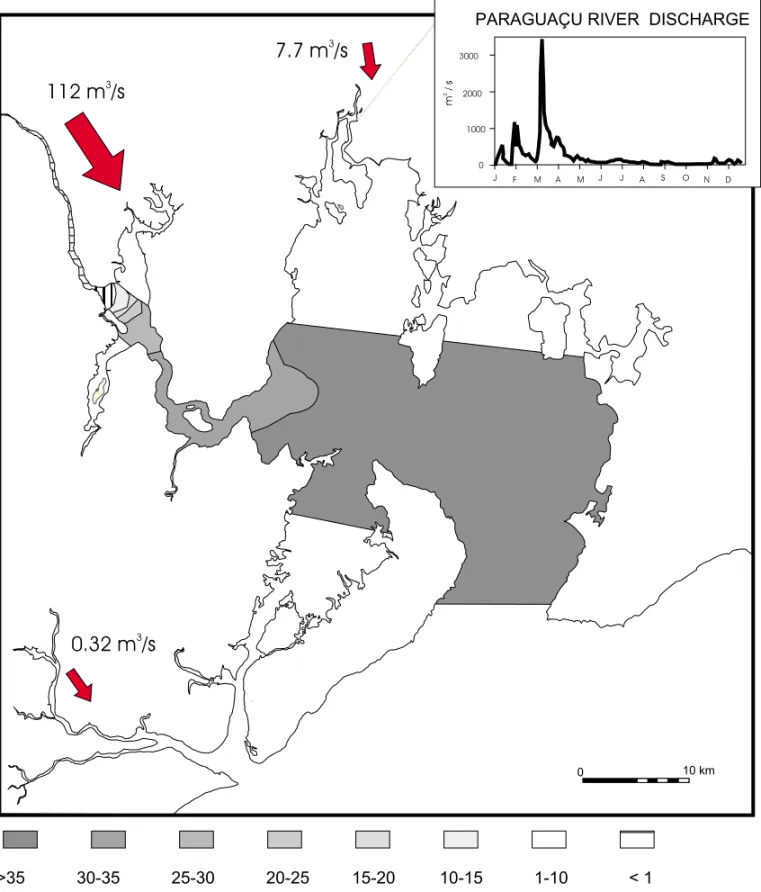
Sal-vador, and a 30 year mean rainfall of about 1900 mm/y for the bay area. Three main watersheds drain into the TSB, namely Paraguaçu, Subaé and Jaguaribe rivers (Figure 1), with long term average
discharges of 112 m3/s, 7.7 m3/s e 0.32 m3/s, respec-tively (CEPLAB 1979, Wolgemuth et al. 1981). The first two empty into the northern and western mar-gins of the TSB, whereas the third debauches very close to the mouth of the Itaparica Channel, and probably have a minor impact in the oceanographic conditions inside the TSB. Highest measured daily discharges for Paraguaçu River, 50 km upstream from TSB, was 6,253 m3/s (CEPLAB 1979). The seasonal variation of water discharge for Paraguaçu River is shown in Figure 2, with higher discharges concentrated on summer months (maximum of 3,500 m3/s in the Figure). At the Pedra do Cavalo Dam (Figure 1), built in 1980, the average maxi-mum discharge between 1992 and 1997 was 2,300 m3/s, whereas the average minimum was 50 m3/s (Mestrinho 1998). It is worth noting, however, that only a small part of the incoming discharge is re-leased downstream by the dam. Between 1994 and 1995 the average downstream freshwater release was around 50% smaller than values measured upstream, with values as low as 6% in March 1994 (Mestrinho 1998). The average tidal prism of the TSB (surface area multiplied by the average tidal range) is around 1.76×10⁹m3, which corresponds to a discharge of 39×103m3/s through the Salvador Channel. This value is about 200 times higher than the average freshwater discharge (∼=200m3/s) of the three main water courses.
Salinity and temperature variations in the main section of the TSB is clearly open marine (36.7 to 33.0 and 24◦C to 30◦C, respectively, Wolgemuth
than 1.5 in water depths ranging from 20 m to 30 m (Wolgemuth et al. 1981).
3. DATA SOURCES
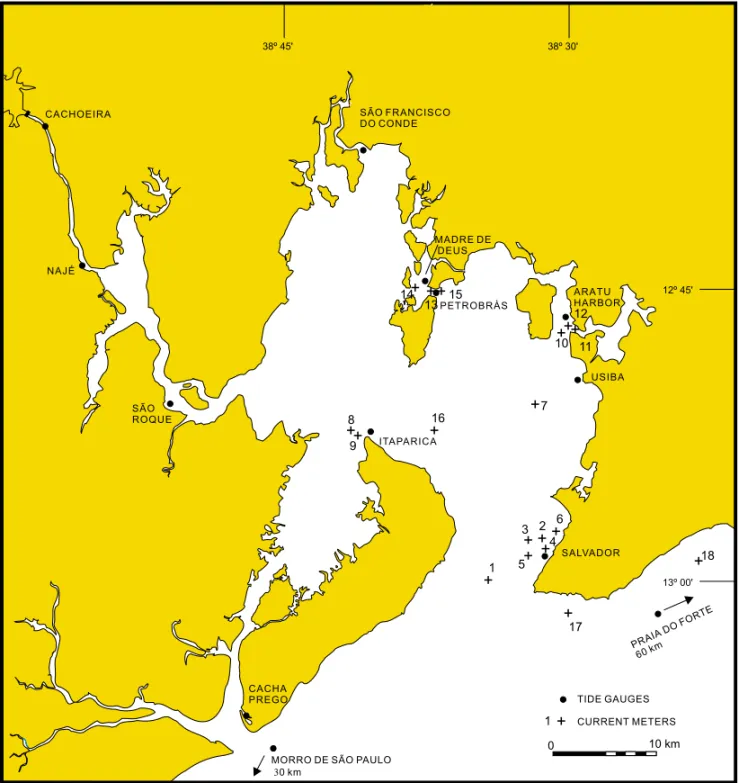
Tide gauge data was obtained from the Brazilian Hy-drographic Authority (DHN) for 11 different sites inside the TSB, and an additional 2 sites on the open coast in the proximity of the bay (Figure 3). The open ocean stations were located 60 km to the north (Praia do Forte) and 30 km to the south (Morro de São Paulo) of the TSB. The inside-bay stations are spread along the northern margin up to the mouth of Subaé River and 15 km into Paraguaçu River. Only the data from São Roque, Najé and Cachoeira (15 days long time series) were recorded simulta-neously. The station at Salvador has the longest record (1 year), whereas Cacha Prego has the short-est (8 days). The remaining stations have time series between 30 and 45 days long. Data for São Fran-cisco do Conde refer to the harmonic constants only. Because most of the time series do not overlap, the analysis of the tidal characteristics of the TSB will be based on the harmonic constituents resolved from each station. Table I shows some of the main tidal constituents for key locations inside and outside the bay.
Good quality tidal-current data was collected in several campaigns during 1974, and is also stored at DHN. Data is available for 15 points inside the TSB (Figure 3), clustering mainly in 7 areas: i) the strait between Frade and Madre de Deus islands, ii) the entrance of Aratu Bay, iii) the entrance of Ita-parica Channel, iv) the Salvador Harbor, v) one sta-tion to the south of Maré Island, vi) one stasta-tion east of Itaparica, and vii) the entrance of TSB (Salvador Channel). The existing data refer to a three-days (on average) time series of current speed and direc-tion measured with a savonius rotor, with a 1-hour measurement interval performed at 2, 3 or 4 differ-ent levels (generally 10 minutes apart), depending on the water depth. The measurement depths ap-pear to have been tied to the DHN datum, and have not been corrected for any tidal variation during the
measuring period.
Reported DHN current direction was inverted (180◦)at all measurement sites but Frade Channel,
as indicated by a comparison between the current time series and the predicted tide of the closest tide gauge (a harmonic analysis performed on the pre-dicted tide showed no difference in relation to the original constituents). Current direction was also corrected for compass deviation.
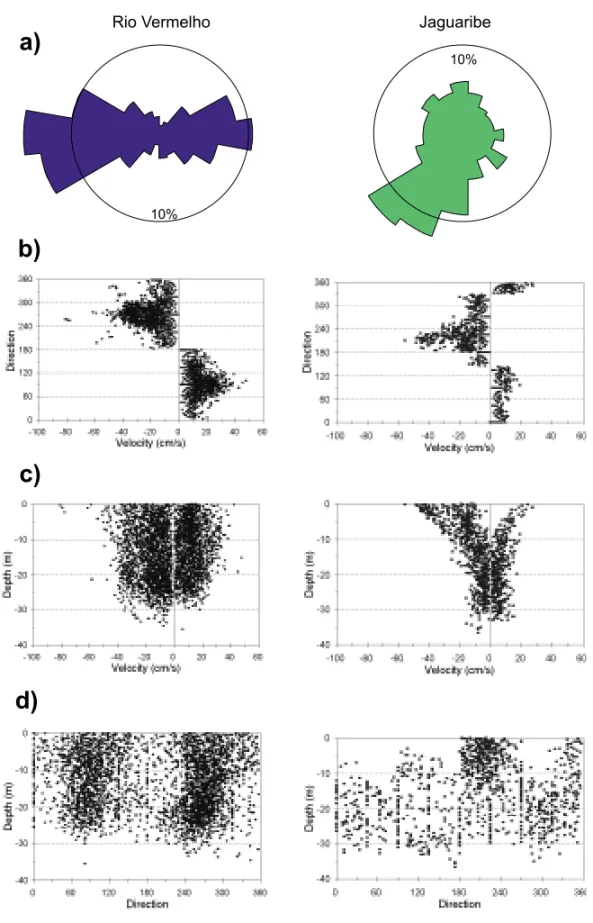
Tidal current data outside the TSB was col-lected between January and June 1993 in two sta-tions fronting Rio Vermelho and Jaguaribe beaches (Figure 3). Vertical profiling of the tidal current di-rection and velocity (at 1 m interval) was carried out with an electromagnetic current meter. Mea-surements lasted for an almost complete tidal cycle (when sea conditions allowed) and were not simul-taneous in the two stations. A 30 min interval gen-erally elapsed between the first measurement at the surface and the last close to the bottom. From the existing data, we selected only those data sets that encompassed quasi-complete tidal cycles, being 12 from Rio Vermelho and 4 from Jaguaribe. Standard wind velocity and direction for the first semester of 1993 was obtained from the meteorological station located a few kilometers from Rio Vermelho beach.
4. RESULTS AND DISCUSSION
4.1 Tides
The tide in the BTS is characteristically semi-diurnal, with form-numberK=(O1+K1)/(M2+
S2)(Pond and Pickard 1983) varying between 0,11 (ocean) and 0,04 (Najé). The analysis of the longest time series (Salvador) shows maximum tidal ranges of 2.7 during an equinoctial-spring tide. Diurnal tidal inequalities are small (∼=0.25 m) and better observed at low water.
30-35
>35 25-30 20-25 15-20 10-15 1-10 < 1
112 m /s
37.7 m /s
30.32 m /s
3PARAGUAÇU RIVER DISCHARGE
0 1000 2000
m/
s
3
J D
3000
J
M A M J A S O N F
0 10 km
Fig. 2 – Salinity distribution during a cruise in May 1977 with fresh water discharge from Paraguaçu River at around 40 m3/s (after Wolgemuth et al. 1981), average freshwater discharge into the bay (prior to the dam construction in
1985) and the variation of fresh water discharge from the Paraguaçu River during 1960 (inset).
bay. It is observed that the tide is amplified as it prop-agates inside the bay, with mean spring tide ranges
38º 30' 12º 45' 13º 00' 38º 45' + + + + + + + + + + + ++ + + 1 2 3 6 7 8 9 10 11 12 13 14 15 5 4 CURRENT METERS + 1 TIDE GAUGES CACHOEIRA NAJÉ SÃO ROQUE SÃO FRANCISCO DO CONDE ITAPARICA USIBA ARATU HARBOR SALVADOR MADRE DE DEUS PETROBRÀS
MORRO DE SÃO PAULO 0 km 3 PRAIA DOFOR TE 60km CACHA PREGO
0 10 km
+16
+
+
17
18
Fig. 3 – Location of the tidal and tidal current measurement sites.
also observed in the lower Paraguaçu River, where the mean spring tide range increases from 2.54 m in Itaparica to 2.71 m in Najé. Upstream from this point the tide range decreases slightly, reaching 2.68 m in Cachoeira.
The M2 phase angle shifts from 101◦ in the
ocean to 115◦in Madre de Deus Island and Itaparica
(Table I). The phase shift increases inside Paraguaçu
River, reaching 126◦in Najé and 142◦in Cachoeira,
TABLE I
Amplitude and phase angle of some important tidal constituents at some stations outside and inside TSB.
Name Praia do Forte Cacha Prego Aratu Salvador USIBA Madre de Deus
cm ◦ cm ◦ cm ◦ cm ◦ cm ◦ cm ◦
K1 3.7 199.0 5.12 215.46 2.87 218.56 4.1 215.4 2.5 190.9 3.3 200.7
O1 6.9 118.0 5.65 109.82 6.6 122.2 8.7 127.0 6.6 127.9
M2 67.0 101.0 69.34 125.39 82.43 116.30 78.0 110.3 82.8 107.0 91.7 112.5 S2 26.1 114.0 24.18 228.16 33.19 129.19 30.5 124.3 33.2 137.4 33.8 127.6 N2 13.5 98.0 21.96 126.70 15.75 119.22 14.5 108.9 12.6 116.1 16.7 103.8
K2 7.1 114.0 9.03 130.24 8.4 116.3 9.0 137.4 9.2 127.6
M4 2.5 142.0 1.32 306.73 1.0 291.1 1.1 301.3 3.5 300.0
MS4 0.7 166.0 2.36 146.96 1.95 56.0 1.2 15.1 2.4 57.7 2.5 20.6
M6 0.6 84.0 0.3 15.3 0.6 333.1
Name São Fco. do Conde Itaparica São Roque Najé Cachoeira
cm ◦ cm ◦ cm ◦ cm ◦ cm ◦
K1 4.8 265.0 4.63 220.72 4.7 202.0 2.6 207.0 2.5 217.0
O1 6.1 113.0 6.97 122.17 6.1 144.0 2.6 153.0 8.4 124.0
M2 96.6 112.0 89.62 110.19 93.0 113.0 100.5 126.0 99.3 142.0 S2 39.4 127.0 37.79 123.31 36.9 138.0 35.0 166.0 35.1 196.0
N2 16.65 107.98 22.3 112.0 21.9 168.0
K2 10.28 124.37 10.0 138.0 9.5 166.0 9.5 196.0
M4 3.65 287.65 5.8 312.0 6.6 302.0 14.9 273.0
MS4 2.28 0.68 4.4 40.0 4.0 131.0 6.5 257.0
M6
TABLE II
Basic tidal characteristics at different stations inside the TSB (M2refers to amplitude andM2o
to phase angle).
Tidal range (m) Time lag (hours)1
Station AVG Spring Neap AVG2 Spring3 Quadratura3
AVG AVG High tide Low tide High tide Low tide
Praia do Forte 1.47 1.86 0.81 – – – – –
Salvador 1.71 2.17 0.95 0.33 0.5 0 0.5 0
Cacha Prego 1.52 1.86 0.99 0.88 1.0><1.5 1.5 1.0 1.0
USIBA 1.82 2.32 0.99 0.22
Aratu Harbor 1.81 2.31 0.98 0.55
Madre de Deus 2.01 2.51 1.15 0.41 0.5 <0.5 0.5><1.0 <0.5 Petrobrás’ Terminal 2.07 2.53 1.23 0.51
São Francisco do Conde 2.12 2.72 1.14 0.40
Itaparica 1.97 2.54 1.03 0.33 0.5><1.0 <0.5 0.5 0 São Roque 2.04 2.59 1.12 0.43 1.0 0.5><1.0 1.5 <0.5
Najé 2.21 2.71 1.31 0.90 1.5 1.5><2.0 2 <0.5
Cachoeira 2.18 2.68 1.28 1.48 1.5><2.0 2.5><3.0 2 1.0
1approximate, relative to Praia do Forte /2estimate, based onM
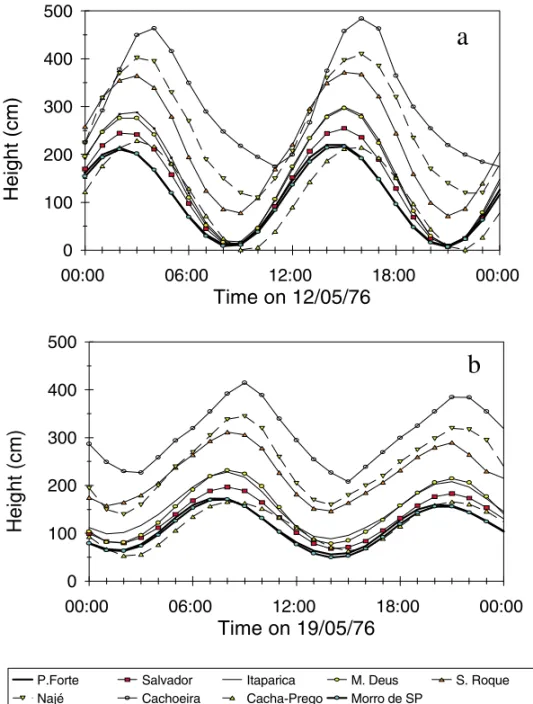
(note that meteorological/oceanographic noise is as-sumed as non-existent, since predicted and observed water levels match very closely). Figure 4 shows the results for May 12th (spring tide – a) and May 19th (neap tide – b). It must be pointed out that the water level at each station is tied to a mean level calcu-lated by the sum ofM2,S2,K2andN2, therefore not referred to a same datum. The excessive over-elevations of the mean water level observed inside the TSB, and specially along Paraguaçu River (#8, #9 and #10) is, hence, a result of an increase in the amplitude of those semi-diurnal constituents.
During spring tides (Figure 4a) the maximum tide range of 3.15 m is attained in Cachoeira, which is 0.9 m larger than that in the ocean (2.25 m). The time lags inside the TSB are small, around a few minutes only, but grow significantly upstream from Iguape Bay (Figure 1), past the river delta. Increas-ing tidal distortion along Paraguaçu River (risIncreas-ing tides take only 5 hours) maximizes low-water time lags. While high tide in Cachoeira lags behind that in the ocean by 1.5 hour (as predicted by the phase angles – Table II), low tide lags behind by about 3 hours.
Tidal propagation during neap tides is similar to that in spring tides, except for the fact that low tide in Cachoeira lags about only 1 hour behind that in the ocean. This change in the low-tide time lag between neap and spring tides is due to a change is the distortion undergone by the tide wave along the Paraguaçu River channel. The distortion appears to be caused (at least partially) by the presence of the fluvial delta prograding into Iguape Bay. Very low tide levels during spring tides significantly reduces the overall channel depth across the delta, enhanc-ing friction and retardenhanc-ing the ebb flow, thus delay-ing the low tide (Figure 4a). Phase angle relation-ship betweenM2andM4(2M2o−M4o)in Najé and Cachoeira are 50◦and 11◦, the lowest amongst the
stations, which reflect the prolonged stabilization of the water level close to low tide (Speer et al. 1991, Lessa 2000). During neap tides the channel is rel-atively deep enough at low water not to cause flow retartadion, and a significant time lag is only
ob-served in Cachoeira. This phenomena has also been reported in other estuaries (Lincoln and Fitzgerald 1988, Speer et al. 1991, Hume and Bell 1993, Lessa and Masselink 1995), all coincidentally associated with the presence of a (tidal) delta. Very shallow channel depths also contribute to a fast transfer of energy from the principal harmonic constituents to their sub-harmonics, as normally occur with M2 (Dronkers 1986, Aubrey and Speer 1985, Friedrichs and Aubrey 1988). It is observed that even though M2is amplified up the bay and into the Paraguaçu River, the ratioM4/M2 is one order of magnitude larger in Cachoeira than that in the ocean.
Tidal asymmetry in Najé and Cachoeira changes between spring and neap tides (Figure 4b). The very distorted tide waves associated with spring tides, where rising tides are much shorter than falling tides, give rise to an opposite asymmetry in Najé (with shorter falling tides) and to an almost sym-metric wave in Cachoeira. A change in the degree of asymmetry is also noticed in Najé, where the du-ration of the falling tide becomes shorter during neap tides. In summary, neap tides favor shorter falling tides whereas spring tides favor longer falling tides. A reason for this might be related to a different im-pact of the mangrove flats on the rising tide during spring and neap tides (Lessa and Masselink 1995, Lessa 2000).
Time lags between Itaparica and Cacha Prego (Table II) are in the order of 30 minutes to 1 hour, indicating that the tidal wave travels, as could be an-ticipated, faster through Salvador Channel (deeper) than through Itaparica Channel (shallower). The two tidal waves would be expected to meet behind Itaparica Island somewhere close to Funil Bridge (Figure 1), a place where sediment accumulation is suggested by satellite imagery. A similar situation in large bays with two entrances is reported by Souza (1995), Medeiros and Kjerfve (1993) and Wolanski et al. (1990).
ampli-Height (cm)
Fig. 4 – Simultaneous tidal cycles for 9 stations inside the TSB and the ocean station on the May 12th (spring tides – A) and May 19 (neap tides – B) 1976. The data belonging to São Roque, Najé and Cachoeira stations are field records, whereas the others are a result of tidal prediction. Low-and high-tide time lags between the ocean station Low-and the innermost station (Cachoeira) are also indicated.
tudes up to 12 cm are common and superimposed on a lower frequency signal with 7,5 cm in ampli-tude spanning almost 1 year. The highs observed in February and May, and the lows occurring around
and Leite 1986).
4.2 Currents
4.2.1 Open Coast
The data showed a strong influence of the tides on currents observed along the south-facing coast fronting Salvador. The tidal currents are most of the time superimposed on a wind-forced SW flow-ing current which prevails in Jaguaribe (Figure 5). Stronger tidal influence around Rio Vemelho is in-dicated by i) a clear bimodal direction distribution (Figure 5a and 5b) and ii) fast flowing currents at all depths in the water column when compared to Jaguaribe (Figure 5c). In Rio Vermelho, flooding tidal currents, with a westward orientation, are both predominant and stronger, with maximum velocities (80 cm/s) exceeding those associated with the short-lived ebbing tides (maximum velocity of 50 cm/s) at all depths (Figure 5b and 5c).
Stronger, wind-driven flow in Jaguaribe is also directed down-coast, with maximum current values of 50 cm/s close to the surface. Figure 5c and 5d show that a consistently strong flow direction is re-stricted to the upper 10 m of the water column, below which the velocities wane and deviate from that on the surface between 90◦and 180◦. The surface
cur-rent appears to change direction only when strong (above 300 cm/s) south winds set in.
Current directions in Rio Vermelho are approx-imately the same at all depths (Figure 5d), excepting at times close to high and low water when velocities is nearing zero. At these occasions the flow stars to change direction generally close to the bottom, and opposing ebbing and flooding tidal currents are then observed in the vertical profile.
Near bottom velocities up to 30 cm/s in RioVer-melho suggests that sediment entrainment and trans-portation can be active even when the wave stress on the sea bed is not taken into account (wave induced sediment entrainment appears to occur to a depth of about 20 m – Dominguez and Leão 1993). Given that availability of sediment exists, transportation would occur towards the mouth of TSB. This would
help to explain the existence of a large shoal (Banco the Santo Antônio – Figure 1), at the eastern side of the bay entrance.
4.2.2 Inside-Bay
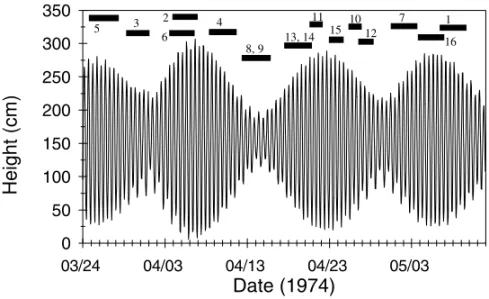
The time period for current data acquisition inside the bay is shown in Figure 6 against the predicted tides for Itaparica (see Figure 3 for location). Most of the measurements fall around spring tides, which makes it possible to correlate the current strength in different sections of the bay.
Current direction was generally concordant at different depths in most of the measurement sites, suggesting that a homogeneous water column ex-isted during the period of observation. This is in agreement with a well-mixed water column pointed out by Wolgemuth et al. (1981). Divergent current directions were associated with small current veloc-ities (< 20 cm/s) or with the proximity of slack water.
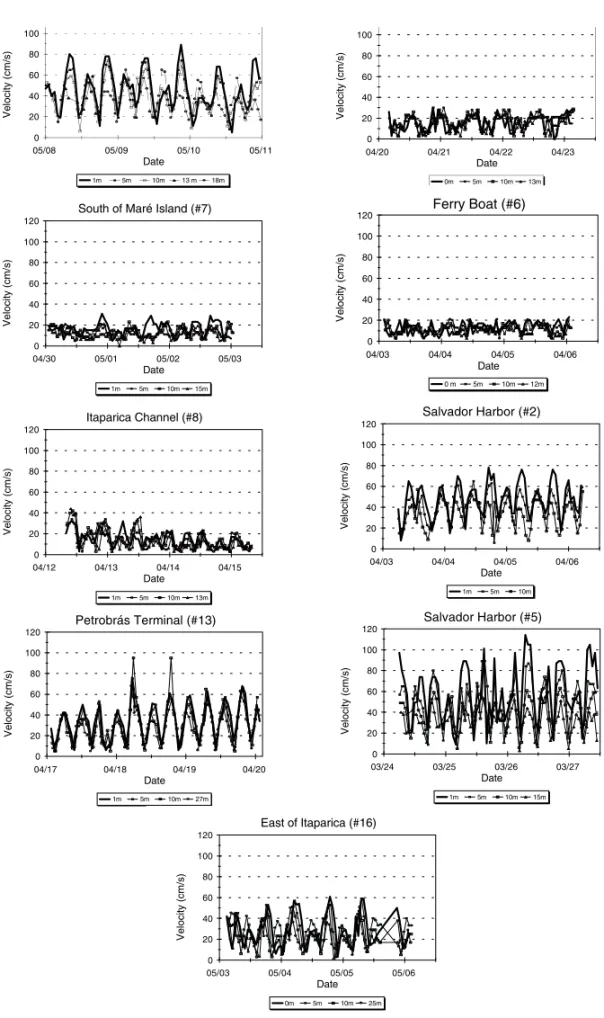
Figure 7 shows a plot of the current velocity at eight stations inside the bay. Maximum current velocities occurred close to mid-tide at all stations, indicating that tides propagate as a standing wave. Very dynamic conditions occurred at Salvador Chan-nel, Salvador Harbor (#2 and #5) and at the Petrobrás Terminal (#13), where maximum values of about 80 cm/s were observed (Figure 7). The area at or around the entrance to Aratu Bay presented very low flow velocities even at spring tides, suggesting a larger channel conveyance area in relation to the tidal prism of Aratu Bay. Relatively low flow velocities at Ita-parica Channel (#8 and also at #9) is ascribed to the neap tidal conditions, and it is expected that current velocity values double during spring tides. Overall, it appears that tidal currents inside the TSB are small, except for the area around the bay entrance and the topographic constrictions close to Frade Island.
Rio Vermelho
10%
Jaguaribe
10%
a)
b)
c)
d)
Height (cm)
Fig. 6 – Predicted tides for Itaparica (see Figure 3 for location) and the time span of current measurements for each station (for station identification see Table III).
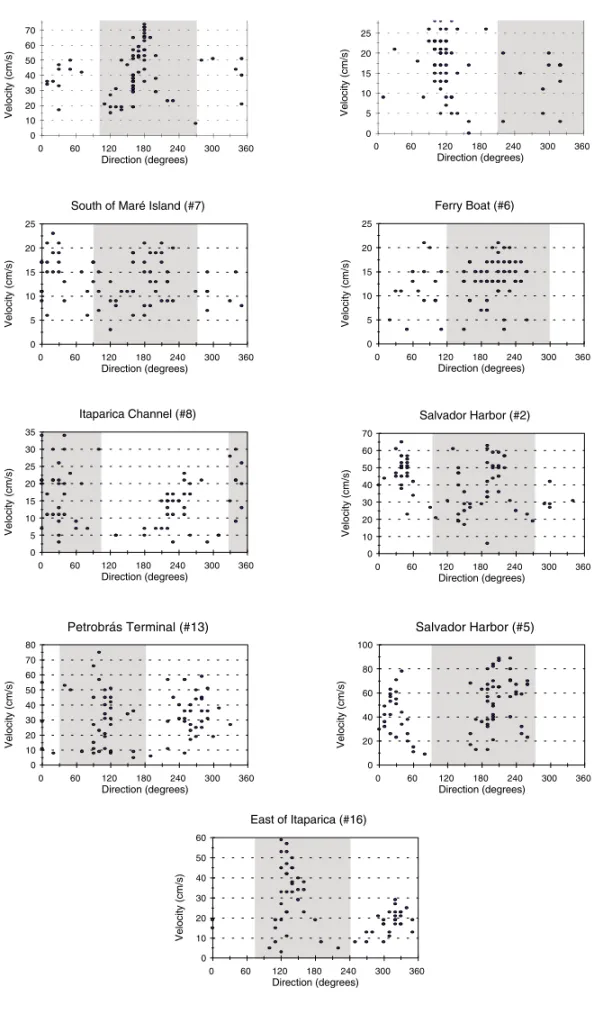
(ie., relatively broad tidal ellipse) occurs. It is ob-served that the strongest flows generally fall inside the shaded area, which indicates the direction of the ebbing tide. Stronger flood flows are only clearly indicated at Aratu Bay Channel (#11).
In well mixed tidal channels, with insignificant fresh water inflow, the existence of stronger flows in one direction (flood or ebb) is generally counterbal-anced by an extended flow time in the opposite direc-tion, so mass conservation is attained (Kjerfve 1978, Kjerfve and Proehl 1979). Figure 8 shows, however, that stations #11, #1 and #16 present a larger number of data points falling within the area of current dom-inance. It thus suggests that the measurements were performed in areas of the cross-sections where flood (#11) or ebb (#1, #16) tidal flows were dominant. This indicates that lateral flow inhomogeneities are present at some cross-sections inside the bay, situa-tion similar to that identified in the Paranaguá Bay estuary (Lessa et al. 1998).
5. CONCLUSIONS
Water circulation inside the Todos os Santos Bay appears to be driven primarily by tides, since the average fresh water input is 2 orders of magnitude
smaller than the average tidal discharge through Sal-vador Channel. Therefore, the water column is well mixed and currents are mostly bi-directional, ex-cepting in the central, more exposed part of the bay where rotating currents occur. Although the bay is well mixed, the tidal current data indicate that lateral flow inhomogeneities probably exist in some cross sections, such as at the bay entrance.
Wind shear seems to play an important role in the circulation of the more superficial layers, as in-dicated by flows with opposing direction in the first few meters of the water column. Seasonal circu-lation patterns might, therefore, be more related to the changing wind field between summer and win-ter than to varying fresh wawin-ter discharge rates, espe-cially if it is remembered that most of the fresh water inflow during summer is now buffered by Pedra do Cavalo Dam.
by larger tidal ranges in São Francisco do Conde (northern extremity) and along Paraguaçu Channel and Paraguaçu River. The two tidal waves that prop-agate along Itaparica Channel, entering it via Ita-parica and Cacha Prego, are likely to form a nodal point somewhere around Funil Bridge, where a shal-lower zone and possibly faster sedimentation is indi-cated by the satellite imagery. Along the Paraguaçu River the tides are modulated by the water depth over the river delta, which changes between spring and neap conditions.
Ebb dominant conditions seem to prevail in most part of the bay, as implied by the direction of the strongest currents, the morphology of sub-tidal channel junctions and the sedimentary deposits, es-pecially the ebb tidal deltas at both entrances. Given that coarse sediment yield to the bay is presently in-significant (Lessa et al. 2000), the presence of the tidal deltas appears to be the result of the obstruction of a longshore sediment transport by currents exit-ing the bay. Measurements of the coastal currents close to the bay indicate that the combination of the tidal currents with a SW, wind-driven current create large, westward orientated flow velocities capable of transporting sediments towards the bay mouth.
6. ACKNOWLEDGMENTS
G. Lessa, A. Bittencourt and J. Dominguez are un-der a CNPq (Brazilian Research Council) research scholarship.
RESUMO
Localizada no Estado da Bahia, a Bahia de Todos os San-tos (BTS) é a segunda maior reentrância costeira na costa brasileira, após a Baía de São Marcos, no Maranhão. Três grandes bacias de drenagem convergem para a BTS, con-tribuindo com uma descarga média anual de água doce 120 m3/s, sendo que desde 1985 50% deste total é retido
por uma represa no rio Paraguaçu. A vazão média anual original era duas ordens de magnitude menor que a vazão média associada à maré de sizígia na entrada da baía, o que explica as características essencialmente marinhas ob-servadas no interior da BTS. As marés são semi-diurnas
e são amplificadas em 1,5 vezes no interior da baía. As constituintes harmônicas de águas rasas se tornam im-portantes ao longo do canal e rio Paraguaçu, onde geram distorções diferenciadas na onda de maré entre sizígia e quadratura. As correntes de maré na baía são principal-mente bi-direcionais, e mais fortes durante a maré vazante na maior parte da baía. Correntes de maré relativamente fortes, associadas à BTS, se fazem sentir em um raio de aproximadamente 10 km para fora da baía, onde se super-põem a correntes de SW induzidas pelos ventos.
Palavras-chave: Marés, Baía de Todos os Santos, Cor-rentes de marés.
REFERENCES
Aubrey DG and Speer PE.1985. A study of non-linear tidal propagation in shallow inlet/estuarine systems. Part I: Observations. Est Coast. Shelf Sci 21: 185-205.
Barreto MAS and Paredes JF. 1995. Estudos hidrodinâmicos no estuário do Rio Paraguaçu. Ciênc Tecnol, Brasília, CPRM, 5: 46-51.
Ceplab (Centro de Planejamento da Bahia).1979.
Bacias Hidrográficas do Estado da Bahia.Série
Re-cursos Naturais. Salvador. Governo do Estado da Bahia. 190p.
Diretoria de Hidrografia e Navegação. 1963. Car-tas de correntes de maré – Porto de Madre de Deus. 12p.
Diretoria de Hidrografia e Navegação. 1975. Car-tas de correntes de maré – Porto de Salvador. 14p.
Dominguez JML and Leão ZMAN.1993. Caracteriza-ção da sedimentaCaracteriza-ção marinha na área entre a foz do Rio Jacuípe e a Ponta de Itapuã. Relatório Técnico: Consórcio Central de Tratamento de Efluentes Líqui-dos e TIBRÁS. CEPEMAR – Centro de Recursos do Mar. Salvador. 65p. (unpublished)
Dronkers J.1986. Tidal asymmetry and estuarine mor-phology. Neth J Sea Res 20(2/3): 117-131.
Franco AS.1988. Tides: Fundamentals, Analysis and
Prediction. São Paulo. Fundação Centro
Tec-nológico de Hidráulica. 249p.
tidal path
fresh water input
cotidal lines
tidal range
currents
1.5 1.8
bedload net sediment transport
measured
estimated 30 cm/s
38º 45'
0 10 km
12º 45' 38º 30'
1.5 2.0
2.6
0.5 2.4
2.2
2.0
1.8 1.0
1.8
1.0 1.5
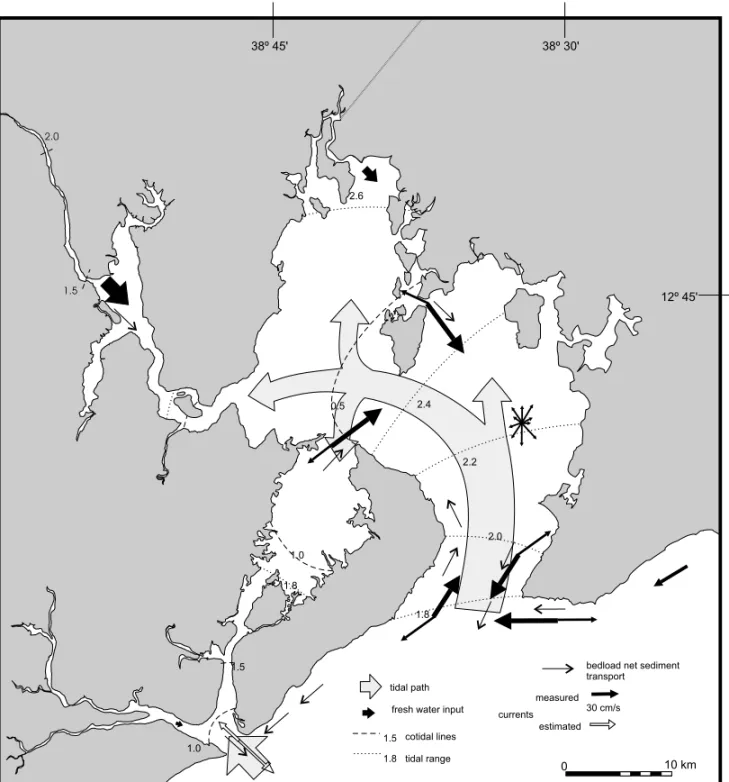
Fig. 9 – Schematic diagram suggesting the general pattern for water circulation and bedload net- sediment transport direction inside the TSB and neighboring coastal region. Bedload sediment transport would be associated to both tides and waves on the shoreface and inner-continental shelf.
distortions in shallow well-mixed estuaries: a synthe-sis. Es. Coast Shelf Sci 27: 521-545.
Hume TM and Bell RG.1993.Methods for Determin-ing Tidal Flows and Material Fluxes in Estuarine
Cross-sections. Wellington. Water Quality Centre
Pub. No. 22. 43p.
Kjerfve B. 1978. Bathymetry as an indicator of net circulation in well-mixed estuaries. Limnol Ocean 23: 816-821.
Leão ZMAN and Brichta A.1996. A plataforma con-tinental. In: Barbosa JSF and Dominguez JML. (Ed.);Texto explicativo para o Mapa Geológico do
Estado da Bahia – Escala 1:1.000.000, SME,
Sal-vador, p. 185-198.
Lessa GC.2000. Morphodynamic controls on vertical and horizontal tides – field results from two macroti-dal shallow estuaries: central Queensland, Australia. J Coast Res 16(4): 976-989.
Lessa GC and Masselink G.1995. Sedimentation and hydrodynamic changes in a back-barrier macrotidal estuary: a morphodynamic approach. Mar Geol 129: 25-46.
Lessa GC, Meyers S and Marone E.1998. Holocene stratigraphy in the Paranaguá Bay estuary, south Brazil. J Sed Res 68(6): 1060-1076.
Lessa GC, Bittencourt ACSP, Brichta A and Dominguez JM.2000. A reevaluation of the Late Quaternary sedimentation in Todos os Santos Bay (BA). An Acad Bras Ci 72(4): 573-590.
Lincoln JM and Fitzgerald DM.1988. Tidal distor-tions and flood dominance at five small tidal inlets in southern Maine. Mar Geol 82: 133-148.
Medeiros C and Kjerfve B.1993. Hydrology of a trop-ical estuarine system: Itamaracá, Brazil. Est Coast Shelf Sci 36: 495-515.
Mesquita AR and Leite JBA.1986. Sobre a varia-bilidade do nível médio do mar na costa sudeste do Brasil. Rer Bras Geof 4: 229-236.
Mestrinho SSP.1998. Estudo do comportamento geo-químico dos metais pesados nos sedimentos da região
estuarina do Rio Paraguaçu – BA. São Paulo. 158p.
(Dissertação de Doutorado, Universidade de São Paulo).
Montenegro A, Uehara S and Campos E.1998. Modelagem numérica da Baía de Todos os Santos, BA: resultados preliminares. In: XI Semana Na-cional de Oceanografia, Rio Grande. Proceedings..., Rio Grande, Fundação Universidade de Rio Grande, p. 392-394.
Palmer MAB, Kjerfve B and Schwing FB. 1980. Tidal analysis and prediction in a South Carolina es-tuary. Contr Mar Sci 23: 17-23.
Pond S and Pickard GL.1983.Introductory dynamical
oceanography. Oxford. Pergamon Press. 329p.
Secretaria de Recursos Hídricos.1997.Projeto Baía Azul. Edital para contratação de trabalhos técnicos
sobre modelamento da circulação de água da Baía de Todos os Santos e adjacências. Governo do Estado da Bahia.
Souza LAP. 1995. A Planície Costeira Cananéia-Iguape, Litoral Sul do Estado de São Paulo: um ex-emplo de utilização de métodos geofísicos no estudo
de áreas costeiras. São Paulo. 207p. (Dissertação
de Mestrado, Universidade de São Paulo).
Speer PE, Aubrey DG and Friedrichs CT.1991. Non linear hydrodynamics of shallow tidal inlet/bay sys-tems. In: Parker BB.(Ed.); Tidal Hydrodynamics. Toronto, John Wiley and Sons. p. 321-339.
Wolanski E, Yoshiro M, King B and Stephen G. 1990. Dynamics, flushing and trapping in Hinchin-brook Channel, a giant mangrove swamp, Australia. Est Coast Shelf Sci 31: 555-576.