Evaluation of
a
semi-quantitative
method for rapid screening of plant phenolic content
Abstract
A rapid method for screening phenolic content in leaves is described and evaluated . The mel hod is based on a treated paper strip that is squeezed around a leaf with pliars . Weaknesses of the method are some sub· jectivlty, lack of precision , and apparent insensitivity to phenolics present as glycosides. Strengths include its speed and independence of laboratory facilities. lmme· diate testing o{ leaves following detachment appears to be essential . The ct ude extraction in the field compares favorably with a more conventional extraction techn:que. The method is recommended for use in prel;minary screening of plant material when a large number of species must te examined within a short time and when laboratory facílities are not avaílable at the fie ld si te .
lNTRODUCTION
Plant phenolics constitute a large and
varied chem ical class that includes pigments,
metabolic compounds, and so-called secondary
compounds. The last group is of special
inter-est to ecologists and contains compounds that
have been implicated as protective agents
against herbivores and pathogens
[cf.
Levin,
1971). allelopathic substances [cf. Rice, 1974).
and decomposition inhibitors
(.cf.
Handley,
1961; Benoit
&Starkey, 1968a, 1968b). The
chemistry and functions of pheno lics have been
discussed at length (e.g., Levin, 1971; Walker,
1975; Swain, 1977).
The method chosen for phenol ic
determi-nation depends on one 's
objectives. For
chemical
taxonomy, chromatographic
tech-niques are often appropriate [Hathway, 1969).
In the tanning industry, gelatin and hide powder
precipitation are the basis of a complex and
empírica! determination (White, 1958).
Ecolo-gists may be more interested in a measure of
total tannin content. For this purpose
colorime-Anthony B. Anderson (1)
Theodore V. St. John (2)
tric determinations of a water extract has
often been employed (AIIen
et a/. ,
1974). Feeny
&Bostock (1968) used a more sophisticated
gravimetric procedure on an acetone-water
extraction.
Burns (1968) reviewed phenolic methods
for use in assessing forage quality. Among his
suggestions was a screening test based on
paper strips impregnated with ferrir. ammonium
citrate. Each strip is squeezed around a leaf
to produce a dark spot proportional in intensity
to the pheno lic concentration in the leaf . This
method could have considerable appeal to
tropica l ecologists. lt is independent of
labo-ratory facilities, easily used in remote sites,
and sufficiently rapid to allow evaluation of a
large number of samples within a short time.
Probably no alternative would permit
exami-nation of the great number of species
charac-teristic of some tropical environments. For
these reasons we undertook a criticai
evalua-tion of the reproducibility and utility of Burns's
method.
METHODS FIELD SITES
Leaf samples were obtained from two
distinctive vegetation types in the vicinity of
Manaus, Amazonas State, Brazil:
(1)Amazon
caatinga, a scrub vegetation on white sand
(entisol) in the Biological Reserve of INPA/
SUFRMA, 61 km north of Manaus on highway
BR-174 (km 45); and (2) primary forest on heavy
clay (oxisol) on the grounds of EMBRAPA, 31
km east of Manaus on highway AM-01 O.
Phyto-sociological data are available in Anderson
et ai.
(1975) for the white sand site and in
Prance
et a/.
(
1976) for the clay si te.
{ 1 l - Department of Botany, University of Florida. Gainesvi lle, Florida 32611.
( 2) - Natural Resource Ecology Laboratory, Co I orado State University. Fort Col lins, Colorado 80523.
LEAF COLLECTION
Leaf samples were obtained from a total
of 210 species. Foliage was taken with a
shotgun or by climbing the trees except at the
white sand site, where they could be picked
off the shrubs or low trees at ground levei.
Ten leaves per species were collected for
testing, usually from 2-3 separate branches.
Leaves were usually obtained from the lower
portion or center of the crowns. To test for
variability within individual plants, a subsample
of six leaves from various portions of the
crown was obtained from one individual of
each of ten white sand species. Whenever
possible, sampling was limited to mature
leaves believed to be of the current yeor's
crop. Ali samples were collected during the
rainy season, from January to April, 1977.
Because of difficulties in collecting from
tall trees on the oxisol site, leaf samples in
both sites were taken from a single individual
of each species. To test for variability among
individual plants of a given species,
subsam-ples were obtained from five individuais of
ten white sand species.
FIELD SCREENING METHOD
The method for screening leaf phenolics
was adapted from Burns (1968). A strip of
filter paper previously impregnated with 0.5%
(wt./vol.) ferric ammonium citrate was folded
around the base of each leaf near the petiole
(but not across the midrib) and squeezed with
pliars. A concentration of 0.5% was used
instead of the 2% recommended by Burns. A
preliminary survey of 32 species showed that
intensity of test spots is virtually independent
of solution concentration over the range tested,
and the lower concentration produced less
discoloration of the test paper. We elimmated
Burns's use of a second strip of untreated filter
paper inside the test strip. The second strip
was found to be impractical because many of
the leaves were sclerophyllous and contained
insufficient fluids to dampen the treated strip.
Testing was usually carried ou tin the fi eld
immediately after obtaining the leaves. The
effect of a 5-hour lag time was determined in
a subsample of six white sand species.
802-Leaf phenolics react with ferric on thc
test strips, producing a stained spol that vancs
in intensity. On the basis of spot intensity.
leaves can be assigned ot categories of leaf
phenolic concentration. Although Burns
recom-mended the use of ten categories, we were
able to clearly distinguish only six.
Spot Test
-=
Collect leavesl
Weigh 2.5 gl
Placa In 200 ml cold aceton"l (7Cl%).water (30%)- ascorbid acid (O.
s
g)-KCN (O. 1 g}solution
l
Transport in ice chest to laboratory
!
Grind solution in waring blender
l
Spot Test < - - FiltC'r
oH
100 ml into benkerl
Add 50 ml distilled water
l
Evaporate acetone in rotary evaporator
l
Ralse voll!me to 100 ml witn distillerl water
!
Add 100 ml 1M HCI
!
Boll untll levei falls to 75 ml
J
P.alse tt' pH of distilled water (4 . 85) w ith 1M NaC03
I
v
Spot Test < - - Raise volume to 100 ml with distllled water
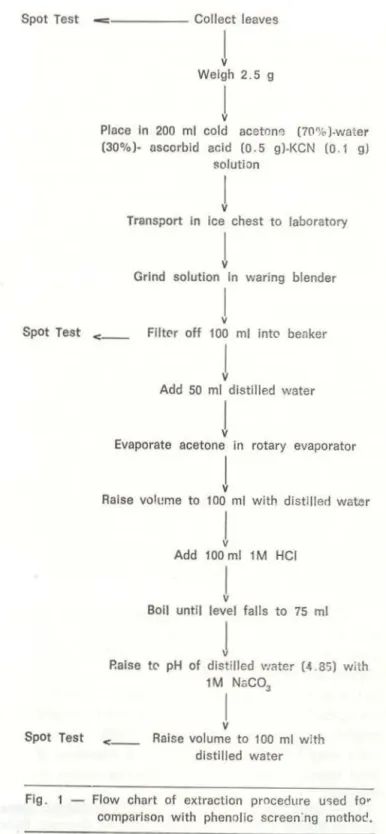
Fig. - Flow chart of extraction procedure u-;ed to• comparlson with phenolic screen:ng methoc!.
COMPARISON WITH STANDARDS
The six categories of spot intensities
produced by our samples were compared with
three types of standards developed by dipping
test strips into known concentrations of tannic
acid, quebracho tann in, and wattle tannin o To
test the permanence of the spot, the original
standards were compared one year later with
test strips (taken from the same batch as the
origina l standards) di pped into newly prepared
tannic acid solutionso
COMPARISON WITH SOLVENT EXTRACTION, ACID HYDROLYSIS, AND FOLIN-DENNIS TEST
The phenolic screening test was carried
out on fresh leaves of eleven wh ite sand
species and compared with the same test
following (a) extraction in an acetone-water
solution and (b) acid hydrolysis (Figo
1)0
Finally,
the phenolic screening method was carried
out on fifteen white sand species; separate
leaf samples of these species were oven dried
and analyzed by the Folin-Dennis methodo
RESULTS
SURVEY OF TWO VEGETATION TYPES
Results of the screening of leaves in the
two vegetation types are presented in the
Appendixo
VARIABILITY WITHIN PLANTS
Leaves of ten species were used to
determine whether samples from different
portions of the same plant differ detectably o
In two of these species, one of the six tests
differed from the others by a single category;
the other eight species had no variation within
the planto
VARIABILITY AMONG PLANTS OF A GIVEN SPECIES
Leaves of five i ndividuais in each of ten
species were examined to determine whether
detectable variability exists among plants of a
Evaluation
o o o
given species o One individual of one species
differed by a single category from the other
four indiv4duals o In al i other species, every
individual tested was in the same categoryo
CHANGES IN SPOT INTENSITY AFTER LEAF COLLECTION
Leaves of six species were tested for
changes in phenolic content in the first five
hours after detachment from the planto Four
of these did not change and two decreased by
one category o One possible mechanism that
could account for the decrease is an
incorpo-ration of leaf phenolics into glycosides, which
may not be detectable by this method (see
below) o Alternatively , some phenolics
may
combine with proteins in the cytoplasmo
Changes in storage were noted by Bate-Smith
and Harborne (1971) o The implications of this
finding are serious, as leaves are often dried
and stored before determination of phenolic
contento
CHANGES IN SPOT INTENSITY DURING STORAGE OF TEST PAPERS
Burns ( 1968) reported that test spots
constitute a permanent record o We apparently
confirmed this with tannic acid standards o
Those stored for a year were not visibly
diffe-rent from freshly prepared standardso However,
a 1980 re-exam i nation o f test stri ps ma de
during the 1977 survey revealed that numerous
species had darkened by one to three
catego-rias of classification o In no case did an initially
dark spot lighten o This change could produce
considerable error if classification of spots is
delayedo
STANDARDS
Three types of standards were
com-pared with our categories of spot intensity:
Ouebracho, wattle , and
tannil
acid o The
quebracho and wattle tannis were less soluble
in water than tannic acid , and we were unable
to dissolve enough of either to match the
intensity of category six o
COMPARlSON WITH SOLVENT EXTRACTION
The spot intensities that resulted from
dipping test papers into the acetone-water
extract were compared in an ordinal sense
with the same series of eleven species tested
in the field . The sequences of species were
identical . This indicates that similar phenolic
fractions are detected when testing fresh
leaves in the field and when testing after
extraction.
COMPARlSON AFTER ACID HYDROLYSIS
In the test for effects of acid hydrolysis,
three of the eleven species showed increases
in relative spot intensity after acid hydrolysis.
The increases probably indicate that the
aglycones liberated by acid are more reactive
In this test than the glycosides of the original
extract .
COMPARISON WITH FOLIN-DENNlS METHOD
Finally, oven-dried samples o f fifteen
species were analyzed by the Folin-Dennis
method . Again , we could not compare the two
methods directly, but we could rank the two
sets of values and compare the sequences.
There was no apparent relationship between
the two sequences. The difference may result
from different sensitivities of the methods. A
second source of error may be changes in
detectable phenolic content following
detach-ment, drying, and storage of leaves. The large
shortterm changes reported above lead us to
suspect that the latter effect is the primary
source of error .
DlSCUSSION
The phenolic screening method described
in this paper has severa I weaknesses. Among
these is the subjectivity involved in
categori-zing spot intensity . Although the spot was
usually a shade o
f gray. many leaves produced
reddish or brown spots . The colar had to be
disregarded and only the intensity considered
in classifying the spots. With practice, the two
authors found good agreement when evaluatmg
804-spots independently . A second weakness of
the phenolic screening methoó is lack of
precision: phenollc levei is nominal rather than
quantitativa . Third , the method appears to be
insensitive t o phenolics present as glycosides.
The lack of a solvent extraction does not
appear to constitute a weakness , as we
ob-tained similar results with an extraction.
The strengths of the phenolic screening
method are its speed and ease of
appli ~ ation .These attributes make it ideal for: (a) analysis
of large sample sizes in a short time or (b)
preliminary screening of samples before using
more quantitativa or specific methods. One of
the greatest advantages of this method may
be its immediate application following leaf
detachment, before potential alteration of
phenolic compounds.
In
conclusion. we offer the following
suggestions for use of the phenolic screening
method:
(1)
A single batch of test strips larger
than the expected sample size should be
prepared . We found variable results when
using batches prepared on different occasions.
(2) Standards should be prepared at the
outset, with a range of tannic acid
concentra-tions . Spot categories should then be
distin-guished and assigned a relative value.
(3) The subjective element in evaluating
spot intenslties may be reduced by having a
slngle person assign categorias. This person
should evaluate a preliminary sample to
be-come accustomed to classifying test strips .
(4) Severa! (ca. ten) replicates of each
sample should be obtained, and assignment to
categories should be based on the most
common SJ?Ot intensity.
(5) Before evaluation, the test strips should
be allowed to dry . Evaluation should be made
on the same day, and test strips should not be
regarded as permanent.
(6) Depending on objectives, collection
procedures should be
standardized so as
to minimize sampling variabliity within leaf,
within plant, between plants, and/or between
seasons.
APPENDIX - Relative phenolic content of 211 central Amazonian native species. Species wi"hout an as· terisk were collected on the oxisol site; species with one asterisk were collected on the with sand site; species with two asterisks were collected on both sites . Phenolic content was evaluated on a scale of 1 to 6, with 1 having the lowest content. In cases where two values appear, the first refers to the white sand site and the second to the oxisol site.
Species Phenolic content
ANNONACEAE
Anaxagorea phaeocarpa Mart. Annona nítida Mart. •
A. sp.
Bocageopsis cf. matogrossensis (R.E. Fr.) R.E. Fr.
B. multiflora (Mart.) R.E. Fr. Duguetia caudata R.E. Fr. Guatteria olivacea R.E. Fr. Unonopsis cf. duckei R.E. Fr. U. stipitata Diels.
APOCVNACEAE
Ambelania duckel Mgf.
Aspidosperma album (Vahl.) Benoist Geissospermum argenteum R.E.
Wood-son in A.C. Smith
Mandevilla krukovii Woodson • Tabernaemontana cf. disticha A. DC.
T. rupicola Benth. • BOMBACACEAE
Bombacopsis nervosa (Uitt.) A. Robyns Scleronema micranthum Ducke
BURSERACEAE
Protium apiculatum Swart.
P. heptaphyllum (Aubl.) March •• P. cf. insigne Engl.
P. paraense Cuatr. P. opacum Swart. P. pedicellatum Swart.
P. sp. sp.
Tetragastris panamensis (Engl.) O. Kuntze
T. sp.
CARVOCARACEAE
Caryocar pallidum A.C. Smith
CHRVSOBALANACEAE
Couepia canomensis (Mart.)) Benth. ex Hook. f.
C. obovata Ducke
C. sp.
Hiltella bicornis Mart. & Zucc.
Evaluatlon ...
4 3 3 3 4 2 3 5 4 2 3 3 2 2 3 2, 3 3 3 5 3 3 5 4 4 5 3 2 5 2Species Phenolic content
H. racemosa Lam. •
H. sp. •
Licania caudata Prance
L. heteromorpha Benth.
L. hypoleuca Benth. L. longistyla Fritsch L. micrantha Miq.
L. octandra (Hoffmgg. ex R.S.) Kuntze L. pallida Spruce ex Sagot
Parinari excelsa Sabine COMBRETACEAE
Buchenavia sp. COMPOSITAE
Mikania roraimensis Robinson • Vernonia grisea Baker •
DICHAPET ALACEAE
Tapura amazonlca Poepp. & Endl. DILLENIACEAE
Doliocarpus spraguei Cheesm. • DUCKEODENDRACEAE
Duckeodendron cestroides Kuhlm. ELAEOCARPACEAE
Sloanea floribunda Spruce ex Benth. S. guianensis (Aubl.) Benth.
S. laurifolia Benth. ERVTHROXVLACEAE
Erythroxylum campinense Amaral Jr. • EUPHORBIACEAE
Conceveiba guianensis Aubl. Croton sp.
Mabea occidentalis Benth. • Pausandra cf. macropetala Ducke • Pera schomburgkiana Muell. Arg. •• Pogonophora schomburgkiana Miers ex
Benth. FLACOURTIACEAE
Casearia cf. aculeata Jacq. C. silvestris Eichl.
Laetia procera Eichl. GESNERIACEAE
Codonanthe sp. • GNETACEAE
Gnetum paniculatum Spruce • GUTTIFERAE
Clusia columnaris Engl. •
C. sp. • Tovomita sp. Sp.
HUMIRIACEAE
Endopleura uchi (Huber) Cautr. Humiria balsamifera St. Hil. • • Saccoglottis ceratocarpa Ducke S. matogrossensls Malme
Species Phenolic content
LAURACEAE
Aniba duckel Kosterm. A. cf. guianensis Aubl. Licaria aurea (Hub.) Kost. L. arltu Oucke
L. sp .
Nectandra rubra (Mez) C. Alber N. sp . •
Ocotea cf. neeslana (Miq.) Kost. Sp .
LECYTHIOACEAE
Corythophora alta R. Knuth C. rimosa W . Rodrigues Couratarl spp.
Eschwellera amara (Aubl.) Ndz. E. fracta R. Knuth
E. odora (Poepp.) Miers E. polyantha A .C. Smlth
E. sp . 1 E. sp . 2
E. sp . 3 E. sp . 4 E. sp . 5 E. sp . 6
Holopyxidlum jaranum {Hub.) Ducke H. latlfolium (A.C. Smith) Knuth H. sp . 1
H. sp . 2
LEGUMINOSAE:CAESALPINIOIOEAE Aldina heterophylla Spr . ex Benth. • Eperua bijuga Ducke
Macrolobium arenarlum Oucke • M. sp.
Peltogyne panlculata Benth. Swartzia cf. alterna Benth. S. corrugata Benth. S. recurva Poeppig • S. panacoco (Aubl.) Cowan S. reticulata Oucke
S. sp .
LEGUMINOSAE:MIMOSOIDEAE lnga cf. bullatorugosa Oucke I. glomeriflora Oucke
1. longiflora Spruce I. cf . rubiginosa OC . I. sp .
Piptadenla sp .
Pithecolobium racemosum Ducke Stryphnodendron racemiferum W. Rodr.
LEGUMINOSAE:PAPILIONOIDAE Andira unifoliata Oucke
Dalbergia cf. atropurpurea Ducke Dipteryx odorata (Aubl.) Willd. Ormosla costulata (Miq.) Kletnh. •
806-3 3 5 3 3 3 4 4 4 3 4 5 3 4 2 3 5 4 5 2 3 4 3 4 6 2 2 2 3 2 2 4 3 2 4 4 3 4 3 3 4 3 3 1 3Species Phenolic content
LEGUMINOSAE Sp .
LORANTHACEAE
Phthirusa micrantha Eichl. • P. rufa (Mart.) Eichl. •
MALPHIGIACEAE
Heteropterys nervosa Adr. Juss. •
MELASTOMATACEAE
Miconla cf. elaeagnoldes Cogn. M. lepidota OC. •
M. sp .
Mourirla lunatantha Morley M. nervosa Pilg . •
M. torquata Morley M. sp .
Sandemanta hoehnii (Cogn.) Wurdack •
MELIACEAE
Guarea duckei C . OC .
G.
sp .Trichllla micrantha Benth.
T. sp . MONIMIACEAE
Siparuna decipiens A . OC .
S.
sp .MORACEAE
Brosimum parinaroides Ducke B. utile (H.B.K.) Pittier
B. sp . Ficus sp .
Hellanthostylus sprucel Balllon
Helicostylis tomentosa (P. & E.) Rusby H. sp .
Maqulra calophylla (P. & E.) Berg. Naucleopsls caloneura (Hub.) Ducke Sorocea sp .
Sp .
Trimatococcus amazonlcus P. & E. MYRISTICACEAE
lryanthera laevis Markgraf Virola calophylla Warb. V. rufula Warb. MYRSINACEAE
Cybianthus spicatus (H.B.K.) Agostinl • MYRTACEAE
Calyptranthes sp . Eugenia cltrifolia Polr. E. egensis OC . E. patrlsll Vahl. • Marliera sp .
Myrcla citrlfolla (Aubl.) Urb. M. servata McVaugh •
6 6 4 6 4 5 5 5 2 4 3 3 5 3 3 3 3 3 4 1 2 2 3 4 2 3 4 4 3 5 2 6 5 5 5 3
Specles Phenolic cont ent
NVCTAGINACEAE
Neea cf. altíssima P. & E. N. sp .
OCHNACEAE
Ouratea discophora Ducke O. spruceana Engl. •
OLACACEAE Heisteria sp.
Minquartia gulanensis Aubl.
PALMAE
Oenocarpus bacaba Mart. O. minor Mart.
PASSIFLORIACEAE
Passiflora faroana Harms •
QUIINIACEAE
auiinia pteridophylla (Radlk.) Pires
RUBIACEAE Alibertia sp.
Borreria capitata (R. & P.) DC. • Chimarrhis barbara (Ducke) Brem. Duroia macrophylla Hub.
D. sp. •
Pagamea duckel Standl. • Palicourea corymblfera Standl. • P. nitidella (M. Arg.) Standl. • Psychotria barbiflora DC. • P. cf. lupulina Benth. •
SAPINDACEAE
Matayba adenanthera Radlk. M. opaca Radlk. •
Talisia cerasina (Benth.) Radlk. •
T. sp .
SAPOTACEAE
Ecclinusa bacurl Aubr. & Pellegr. Eremoluma sagotlana (Baill.) A ubr. E. williamii Aubr. & Pellegr.
Glycoxylon inophy.lum (Mart. ex Miq.) Ducke •
Manilkara amazonica (Hub.) Standl. • Myrtiluma eugenifolia Baill. (Pierre) Pouteria caimito (Ruiz & Pav.) Dadlk. P. ct. guianensls Aubl.
P. sp . Pri eurella sp .
Richardella cladantha (Sandw.) Baehnl R. cf. macrophylla (Lam.) Aubr. Sp .
Evaluation .. .
6 6
4 3
3 5
2 4
2
2
2 5
4
3 5 2 3 3 2 2
3 2 5 2
2 5 3
5 5 4 3 3 3 5 4 3 5
Specles Phenollc content
SIMARUBACEAE
Simaba cuspi data Spruce ex Engler • •
STERCULIACEAE
Theobroma sublncana Mart .
VIOLACEAE
Papayrola cf. gulanensis Aubl. Sp.
VOCHVSIACEAE Erisma bicolor Ducke E. fuscum Ducke
E. sp.
aualea albiflora Warm. a . paraensis Ducke a . retusa Spr. ex. Warm. •
a.
sp.Vochysia vismiefolia Spruce ex Warm.
A CKNOWLEDGMENTS
4
3
3 2
5 5 5 4 5 6
4
4
Mr. James Van May for providing
com-mercial quebracho and wattle tannin
prepara-tions for use as a standard.
Ms. Sandra Knapp and Dr. Philip W. Rundel
for det erm ining tanni n concentration by the
Foli n-Dennis method on fifteen species.
Field work was supported in part by a
grant from t he Brazilian National Research
Council to Dr. Paulo de Tarso Alvim.
Pre-paration of th e manuscript was supported by
U . S . National Science Foundation Grant DEB
78-11 201 .
Resumo
Este trabalho descreve um método rápido de ava-laição de conteúdo de fenois em fo lhas de plantas. Esse método baseia-se no esmagamento de parte do limbo em contacto com um papel tratado . A velocidade e a independência da necessidade de laboratório são os pontos altos do método. Os pontos baixos são a falta de precisão, a subjetividade da avaliação e a apar sen· sibilidade à fenois na forma de gllcosídeos . Parece ser essencial que o teste seja feito imediatamente após co-lher a folha . A extração pelo método grosseiro, no cam-po, é comparável às técnicas convencionais de extração. O método é recomendado para uso no " screening" de material de planta quando um grande número de espé· eles deve ser examinado em pequeno espaço de tem· po e quando não existem facilidades de labooatórios nas proximidades.
REFERENCES
ALLEN, S.E.; GRIMSHAW, H.M.; PARKINSON, JA &
OUARMBY, C.
1974 - Chemical analysis of ecologlcal materiais. John Wiley & Sons, New York.
ANDERSON, A .B.; PRANCE, G.T. & ALBUQUERQUE, B.W.P.
1975 - A vegetação lenhosa da campina da Reser-va Biológica INPA-SUFRAMA. Acta Amazo-nica, 5: 225-246 .
BATE-SMITH, E.C. & HARBORNE, J.B.
1971 - Differences In flavonoíd content between fresh and herbarium leaf tlssue in Dillenla. Phytochemistry, 1 O: 1 055·1 058 .
BENOIT, R.E. & STARKEY, R.L.
1968a- Enzyme inactivatlon as a factor in the lnhlbition of decompositlon of organlc matter by tannlns. Soil Sei., 105: 203·208. 1968b- lnhlbition of cellulose and some other car·
bohydrates by tannin. Soil Sei., 105: 291·296. BURNS, R.E.
1968 - Mehods of tannin analysis for forage crop evaluation. Georgla Agrlc. Exp. Sta. Tech. Buli., N.S. 32 .
FEENY, P.P. & BOSTOCK, H.
1968 - Seasonal changes in the tannin content of oak leaves. Phytochemistry, 7: 871-880 . HANDLEV, W.R.C.
1961 - Further evidence for the lmportance of re-sidual leaf proteln complexas in litter
de-
808-composition and the supply of nitrogen for plant growt. Plant and Soil, 15 (1): 37-73. HATHWAY, D.E.
1969 - Plant phenols and tannlns. In : I. Smith (ed.) - Chromatographic and Electrophoreti c Te-chniques. v.1. Chromatography. Wllliam Hei· nemann, Bath. p. 390-436.
LEVIN, D.A.
1971 - Plant phenolics: An ecological perspectiva. Am. Nat., 105: 157·181.
PRANCE, G.T.; RODRIGUES, W.A. & DA SILVA, M.F. 1976 - Inventário florestal de um hectare de mata
de terra firme Km 30 da Estrada Manaus· ltacoatiara . Acta Amazonica, 6: 9·35. RICE, E.L
1979 - Allelopathy . Academic Press, New York. SWAIN, T.
1977 - Secondary compounds as protectlve agents. Ann. Rev. Plant. Physlol., 28: 479·501. WALKER, J.R.L.
1975 - The biology of plant phenolics . The lnstitu· te of Bíology's (Studies in Biology, 54) Edward Arnold, Ltd., London.
WHITE, T.
i958 - Chemistry of the vegetable tannins. In : F. O'Fiaherty, W.T. Roddy, and R.M. Lollar eds. The Chemlstry and Technology of Leather v.2. Reinhold Publ. Co., New York. p. 98-160.
(Aceito para publicação em 11 / 01 / 81)