PROFILE IN PLANT DIAGNOSIS USING AN OPTICAL SCANNER
Quantificação do nível de verde e padrão espectral foliar no diagnóstico de plantas através de um scanner ótico
Ryoichi Doi1
ABSTRACT
Observation of leaf spectral profile (color) enables suitable management measures to be taken for crop production. An optical scanner was used: 1) to obtain an equation to determine the greenness of plant leaves and 2) to examine the power to discriminate among plants grown under different nutritional conditions. Sweet basil seedlings grown on vermiculite were supplemented with one-fifth-strength Hoagland solutions containing 0, 0.2, 1, 5, 20, and 50 mM NH4+. The 5 mM treatment
resulted in the greatest leaf and shoot weights, indicating a quadratic growth response pattern to the NH4+ gradient. An equation
involving b*, black and green to describe the greenness of leaves was provided by the spectral profiling of a color scale for rice leaves as the standard. The color scale values for the basil leaves subjected to 0.2 and 1 mM NH4+ treatments were 1.00 and 1.12,
respectively. The other treatments resulted in significantly greater values of 2.25 to 2.42, again indicating a quadratic response pattern. Based on the spectral data set consisting of variables of red-green-blue and other color models and color scale values, in discriminant analysis, 81% of the plants were correctly classified into the six NH4+ treatment groups. Combining the spectral data
set with the growth data set consisting of leaf and shoot weights, 92% of the plant samples were correctly classified whereas, using the growth data set, only 53% of plants were correctly classified. Therefore, the optical scanning of leaves and the use of spectral profiles helped plant diagnosis when biomass measurements were not effective.
Index terms: Color models, multidimensionality, multivariate spectral profiling, nonlinear response pattern, Ocimum basilicum.
RESUMO
A observação do perfil espectral da folha (cor) permite medidas de gestão adequadas a serem consideradas na produção. Um scanner óptico foi usado para: 1) obter uma equação para determinar o verde das folhas e 2) examinar o poder de discriminar entre as plantas cultivadas sob diferentes condições nutricionais. Mudas de manjericão cultivadas em vermiculita foram suplementadas com solucão de Hoagland contendo um quinto de força e suplementado com 0, 0,2, 1, 5, 20 e 50 mM NH4+. O tratamento de 5
mM resultou em maior peso de folha e parte aérea, indicando um padrão de resposta quadrática para o gradiente de NH4
+. Uma
equação envolvendo b*, preto e verde para descrever o verde das folhas foi fornecido pelo perfil espectral de uma escala de cores
para folha de arroz como padrão. Os valores de cor de escala para as folhas de manjericão submetidos aos tratamentos NH4+
contendo 0,2 e 1 mM foram 1,00 e 1,12, respectivamente. Os outros tratamentos resultaram em valores significativamente superiores, de 2,25 a 2,42 indicando novamente um padrão de resposta quadrática. Com base no conjunto dos dados espectrais constitu ído por variáveis de cores vermelh o-verde-azul e ou tros modelos de cores e valores da escala de cores, na
análise discriminante, 81% das plantas foram corretamente classificadas em a seis NH4+ grupos da planta. Combinando os dados
espectrais com os dados de crescimento composto pelo peso das folhas e parte aérea, 92% das amostras de plantas foram corretamente classificadas, enquanto que usando somente o conjunto de dados de crescimento, apenas 53% das plantas foram corretamente classificadas. Neste contexto, a digitalização óptica das folhas e do uso de perfis espectrais auxiliou no diagnóstico da planta, quando as medidas da biomassa não foram efitivas.
Termos para indexação: Modelos de cores, a multidimensionalidade, perfil espectral multivariada, padrão de resposta não-linear,
Ocimum basilicum.
(Received in april 25, 2012 and approved in june 4, 2012)
1The University of Tokyo – 1-1-1 – Yayoi – 113-8657 – Bunkyo-ku – Tokyo – Japan – roird2000@yahoo.com INTRODUCTION
For stable crop production, observations of crop responses to the given environmental conditions are important so that suitable management measures can be taken for the given environmental conditions. A variety of methods to observe crop responses to environmental conditions have been established (PLANT, 2001). To
precise analyses of above ground biomass such as determination of leaf nitrogen compounds connect us to the fun damen tal mechanisms in the plan t body, observations of the external appearance of the crop provide information regarding the results of various processes in the plant body with low cost, less time and labor, and greater user-friendliness.
One feasible method for the above ground observation of crops is the spectral profiling of the leaves (GAUSMAN et al. 1984). Leaf color is an indicator of plant condition. As a component of the red-green-blue color model, green is the color of chlorophyll, which generates energy (SHUVALOV, 2007). An abnormality in leaf color indicates a disorder of the plant body caused by above-ground stresses (SICHER, 1999) or poor soil conditions (OLSZEWSKA et al., 2008). It is thus evident that obser vation of leaf color en ables suitable plan t management measures (VAN NIEL; MCVICAR 2004). Recently, Zhang et al. (2010) utilized an optical scanner for the spectral profiling of rice leaves and successfully estimated the chlorophyll contents of the leaves based on the values of the red-green-blue and other color models. They also obtained multiple regression formulae to describe the contents of chlorophylls a and b. Their case study suggested that, using an optical scanner, a color scale for measuring leaf color greenness (FURUYA, 1987) may be applicable to plant diagnosis. The gradient of greenness shown by the color scale has a fairly close correlation with leaf chlorophyll content (BYJU; ANAND, 2009), which sensitively reflects environmental suitability for the crop, especially soil nitrogen availability (VARINDERPAL-SINGH et al., 2010). A simple statistical technique was expected to give a continuous measure of leaf greenness though the color scale has only seven colors represented by green plastic plates (DOI, 2010).
Given this, the first objective of this study was to examine the optical scanning method in the measurement of the greenness of basil leaves subjected to nitrogen-deficiency and nitrogen-excess treatments. A continuous measure of greenness based on the spectral profiling of the color scale was applied to determine the greenness of basil leaves. The second objective was to examine the diagnostic use of the scanner-captured leaf spectral profiles by evaluating the discriminatory power to discriminate among the basil leaves. Sweet basil seedlings were grown on media supplemented with deficient to nitrogen-excess mineral solutions. As a prerequisite for the nutritional diagnosis, the discriminatory power of the profiling method relying on spectral variables was quantified.
MATERIALS AND METHODS
Preparation of plant samples
Seeds of a sweet basil cultivar (Ocimum basilicum), Sweet Green (Unwins Ltd., UK) were sown on vermiculite supplemented with water, and grown at 25 to 34° C and in a 12 h day (1420 lux) – 12 h night cycle for 19 days. The light source was a white light fluorescent lamp, Noabright (Noa Enterprises Co., Ltd., Japan). The vermiculite was pre-washed with deionized water. Two seedlings were then transplanted into a plastic cup with 15 g (105° C oven-dried weight) of vermiculite, and grown under the same temperature and light conditions. Five milliliters of one-fifth-strength Hoagland solution (pH 6.2) supplemented with 0. 0.2. 1, 5, 20, or 50 mM NH4Cl were added five times to the plastic cup at intervals of 8 to 12 days. Within the interval period, water was occasionally added to the cup to maintain water availability for the plants. The plants were harvested 54 days after the transplantation. The shoot fresh weight was measured and the first leaf pair was separately weighed. The leaf pair was used for leaf spectral profiling using the optical scanner, Epson ES-2000, as described below. Four plastic cups were used for each NH4+ concentration, and eight replicate plants
were obtained. The electrical conductivity and pH of the vermiculite medium at harvest time were determined as previously described (DOI; RANAMUKHAARACHCHI, 2009).
Leaf color scale for the continuous measure of leaf greenness
A color scale (Fujihira Industry Co., Ltd., Japan) for rice was used. The scale has seven greenish color levels that were spectral profiled using the Epson ES-2000 optical scanner. Each color level was scanned at 300 dots per inch in the color mode. The images of the color levels were saved as jpg files, and spectral profiles of the color levels were obtained by reading the intensity values of luminosity, red, green, blue, cyan, magenta, yellow, black, and L* and values of a* and b* with Adobe PhotoshopTM 7.0 computer software
yellow) and black are used to create other colors. The International Commission on Illumination L*a*b* color model is designed to appr oximate h uman vision (KAKUMANU et al., 2007). The three coordinates of CIE L*a*b* represent the lightness of the color (L*), its position between red/magenta and green (a*), and its position between yellow and blue (b*). The relationships between changes in scale value between 1 (the lightest) and 7 (the darkest) and those in the spectral variables described above were statistically analyzed to obtain a formula to determine color scale values for the basil leaves.
Leaf spectral profiling
The upper (adaxial) surface of leaf pairs was scanned and spectral profiled as described above. Values of the spectral variables were read for 1113 or more pixels per leaf pair.
Data analysis
The statistical software SPSS10.0.1 (SPSS Inc.) was used to perform all of the following statistical analyses. Analysis of variance was performed to examine the significant effect of NH4+ concentration on each single
variable. As the post hoc test, Fisher’s least significant difference t-test was performed to evaluate the significance of the observed differences between means. Multiple regression analysis was performed to obtain a formula to determine color scale values for sample leaves applying the default criteria (p = 0.05 for inclusion and 0.10 for removal). To determine the discriminatory power of the
profiling methods based on growth (leaf and shoot weights) and the spectral data sets to discriminate among the plants subjected to different NH4+ treatments,
discriminant analysis was performed. Principal component analysis was performed to extract the principal components from a combined data set consisting of all growth and spectral variables to determine the dimensions that are independent.
RESULTS AND DISCUSSION
Plant growth under the NH4+ treatments
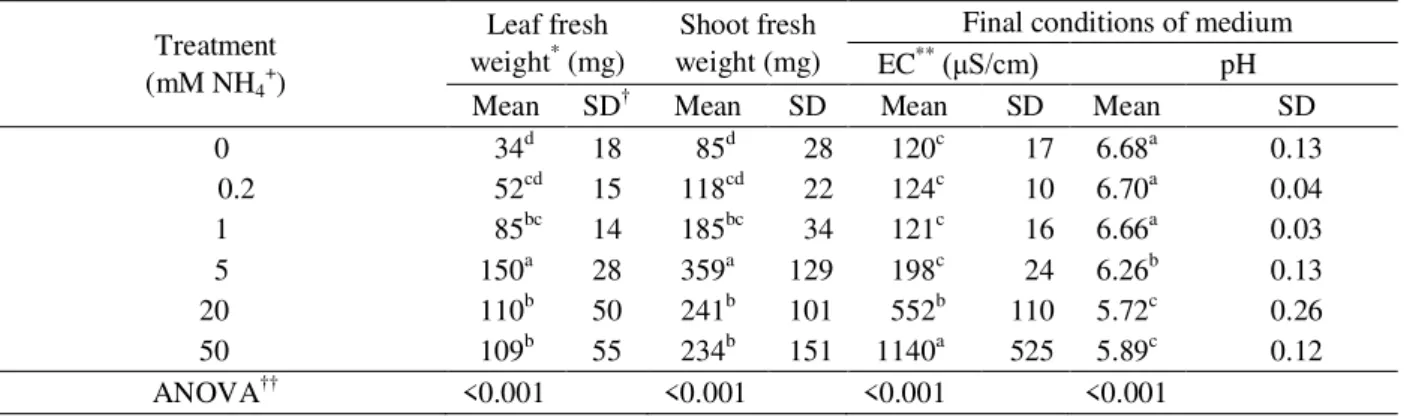
Table 1 presents the effects of NH4+ in
one-fifth-strength Hoagland solution on plant growth and the final values of the electrical conductivity and pH of the vermiculite media. According to the changes in fresh weights of the first leaf pair and shoot, 5 mM NH4+ was the optimal concentration.
The treatments with 20 and 50 mM NH4+ resulted in decreases
in the weights of the first leaf pair and shoot, indicating that the NH4+ concentrations were excessive and thus suboptimal.
The treatments with 1 mM and lower NH4+ concentrations
also resulted in small leaves and shoots, indicating nitrogen deficiency. These results indicate that both excessive and deficient NH4+ treatments negatively affect basil growth.
Hence, against the NH4+ gradient, quadratic patterns of
changes in the plant growth variables were recognized. In the diagnosis, the apparent proximity between the plants suffering from nitrogen deficiency and nitrogen excess was expected to hinder the discrimination between them when the leaf and shoot weights were used.
Table 1 – Effects of NH4+ concentration in one-fifth-strength Hoagland solution on leaf weight, shoot weight, and final
conditions of vermiculite medium.
*Weight of first leaf pair compound. ** Electrical conductivity.
† Standard deviation.
†† Results of analysis of variance expressed asp values, hypothesizing.
NH4+ concentration as the significant source of variation.
Treatment (mM NH4+)
Leaf fresh weight* (mg)
Shoot fresh weight (mg)
Final conditions of medium
EC**(μS/cm) pH
Decreases in leaf biomass due to excessive nitrogen supply have been observed for three-year-old grape plants (KELLE; KOBLET, 1995), citrus seedlings (LEA-COX; SYVERTSEN, 1996), barley seedlings (BRITTO; KRONZUCKER, 2002), and tobacco seedlings (PAL; OJHA, 1966). Table 1 shows that excessive NH4+ supply caused
the increase in the electrical conductivity of the media in the 20 and 50 mM NH4+ treatments, suggesting that the
vermiculite was saturated by NH4+ in these treatments
(MORTLAND et al., 1963). The growth inhibition under the high NH4+ treatments was not due to an increase in pH,
as described in one case study in which ammonium nitrate was applied (PAL; OJHA, 1966). Rather, the mechanism in which the rhizosphere is acidified when more cations are consumed by roots than anions (ROMHELD et al., 1984) and H+ is released to balance the electrical charge in the
plant body (BRITTO; KRONZUCKER, 2002) was likely to have occurred in the current experiment.
Greenness and spectral profiles of the leaves
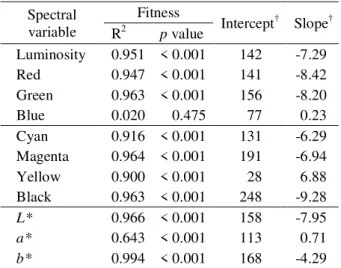
Table 2 shows linear relationships between color scale value and the spectral variables. Most spectral variables had significant linear relationships with color scale value. As color scale value increases, the intensity values of luminosity, red, cyan, magenta, black, and L* dropped, indicating that the larger the scale value the darker the color. The smaller values of b* for the large color scale values indicate more greenish color than for the smaller scale values, which are more yellowish.
Linear multiple regression analysis of the data provided the following equation to describe the greenness of leaves as color scale values on a continuous measure (Figure 1).
Table 2 – Linear relationships between color scale value and spectral variables.
† Color scale value.
= intercept + slope value of the spectral variable.
Spectral variable
Fitness
Intercept† Slope† R2 p value
Luminosity 0.951 < 0.001 142 -7.29 Red 0.947 < 0.001 141 -8.42 Green 0.963 < 0.001 156 -8.20 Blue 0.020 0.475 77 0.23 Cyan 0.916 < 0.001 131 -6.29 Magenta 0.964 < 0.001 191 -6.94 Yellow 0.900 < 0.001 28 6.88 Black 0.963 < 0.001 248 -9.28
L* 0.966 < 0.001 158 -7.95
a* 0.643 < 0.001 113 0.71
b* 0.994 < 0.001 168 -4.29
Figure 1 – Linear relationship between actual and predicted values of color scale for determination of greenness on the continuous measure described by the spectral variables.
Predicted color scale value
= -0.001 + 0.997 actual color scale value (R2 = 0.997, p < 0.001)
Upper confidence limit 95% Lower confidence limit 95%
0 1 2 3 4 5 6 7 8 Actual color scale value
8
7
6
5
4
3
2
1
0
P
re
d
ic
te
d
c
o
lo
r
sc
a
le
v
a
lu
e
=
4
0
.0
0
.1
9
0
x
b
*
+
0
.0
6
4
7
x
b
la
ck
+
0
.0
5
1
2
x
g
re
en
2
g
2
2
Upper confidence limit 95% Lower confidence limit 95%
Predicted color scale value
= -0.001 + 0.997 actual color scale value
(R2 = 0.997, p < 0.001)
Color scale value = 40.0 – 0.190 b* + 0.0647 back + 0.0512 green
The predicted color scale values felt in a narrow range of confidence limits (95%) along the regression line with a great R2 value of 0.997. As in a previous case study
(DOI, 2010), the formula was shown to be a reliable continuous measure for determination of color scale vales for leaves when their values of b* and the intensity values of black and green are known.
By optical scanning of the leaves, the leaf spectral profiles were provided (Table 3). Again, non-linear quadratic relationships between the NH4+ gradient and
changes in the spectral variables were seen. For example, the leaves that experienced the 1 mM NH4+ treatment had
the largest values of the intensity of luminosity, red, and green, indicating that the leaves were light colored. The dark leaf spectral profile for the 0 mM NH4+ treatment was
An apparently similar effect was observed under the 20
and 50 mM NH4+ treatments. The color scale values of
around 2.4 were comparable to that for the 5 mM NH4+
treatment (2.25) whereas the leaf weights were
significantly smaller than that of the 5 mM NH4+ treatment.
This indicates a decrease in chlorophyll synthesis in the
basil leaves under the excessive NH4+ treatments
(SANDOVAL-VILLA et al., 1999), but the decrease was masked by the significant decrease in the leaf biomass
caused by the toxicity of NH4+ per se as in the case of
hydroponically grown tomato at 11 mM NH4+ (SIDDIQI
et al., 2002).
The color scale values fell within a relatively low range (1.00–2.42) when compared with leaves of rice cultivars such as Sasanishiki for which the range of color scale value is between 3 and 5 or greater (TAKEBE; YONEYAMA, 1989). The light color of the basil leaves may be due to the weak light intensity for basil for which the optimal light intensity is much greater (BEAMAN et al., 2009) and/or to the limited wavelengths of the light emitted from the lamp (KOPSELL et al., 2005). The color scale was developed for scoring the greenness of rice leaves (FURUYA, 1987). However, because the color scale values based on the optical scanning showed a deficiency and excess of nitrogen, the color scale value could be an a i d f o r t h e m a n a g e m e n t o f v e g e t a b l e s b y supplementing the continuous measure of leaf greenness described as equation. In the current study, however, because the spectral profiles of the leaves as
a result of the deficient and the excess NH4+ supply
were similar, the data set on these spectral variables was expected to be ineffective for the diagnostic use to discriminate among the basil plants subjected to
deficient and excessive amounts of NH4+ supply.
Discrimination among plants grown on media with
different NH4+ concentrations
The expected difficulty in the discrimination
among the plants grown under the NH4+ treatments due
to the quadratic response patterns to the NH4+ gradient
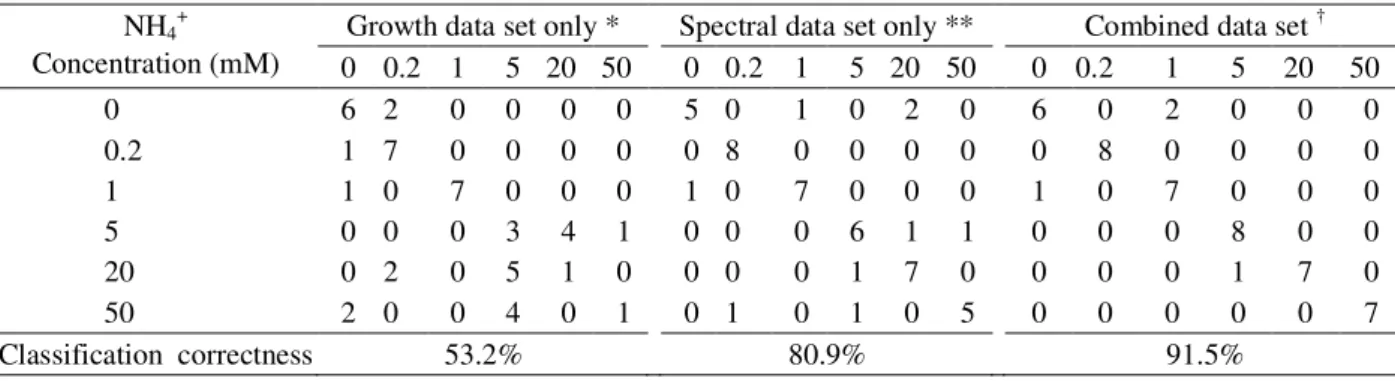
was shown as the poor discriminatory power of the profiling method based on the growth variables (leaf pair and shoot weights) (Table 4). When using the growth data set only, approximately half of the plant samples were misclassified. Better discrimination among the plants was achieved by using the spectral data set consisting of the spectral variables in table 2 and color scale value, with the misclassification rate of 19%, seemingly owing to the larger number of variables (DOI
T
able 3 – Ef
fects of NH
4
+ concentration in one-fifth-strength Hoagland solution on the spectral profile of basil leaf as revealed by an optical.
† SD Standard deviation. †† Results of analysis of variance expressed
as
p
values, hypothesizing NH
4
+ concentration as the significant source of variation.
NH 4 + con cent rat ion (m M ) RGB c o lo r m o d el CM YK Co lo r m o d el L * a*b* c o lo r m o d el Co lo r s ca le val u e L u m in o si ty R ed G ree n B lue C y an M agent a Y el low B lack L * a* b* Me an S D
† M
ean S D M ean S D M ean S D M ean S D M ean S D M ean S D M ean S D M ean S D M ean S D M ean S D M ean S D 0 117 b
c 8
105
b
c 7
132
b 10
67
ab 2
98
b 5
176
b 9
24
a 6
220
b 11
132
b 9
109
a 2
159
b 4
2.
27
a 0.
96
0.
2 123
ab 6
109
ab 6
140
ab 8
64
c 2
99
ab 4
185
a 7
10
c 3
230
a 8
139
a 7
107
b 2
164
a 3
1.
00
b 0.
66
1 126
a 6
113
a 7
143
a 7
68
ab 1
103
a 5
186
a 7
17
b 3
232
a 8
142
a 7
108
b 1
164
a 3
1.
12
b 0.
69
5 115
c 4
101
c 9
130
b 5
66
b
c 2
96
b 3
175
b 4
21
ab 4
219
b 6
130
b 4
110
a 1
159
b 2
2
.25
a 0.
50
20 116
b
c 5
104
b
c 6
131
b 6
69
a 4
97
b 4
176
b 5
26
a 7
220
b 7
131
b 6
109
a 1
158
b 3
2.
42
a 0.
70
50 114
c 9
103
b
c 10
129
b 9
65
b
c 4
97
b 8
173
b 7
22
ab 8
217
b 11
129
b 9
110
a 1
159
b 4
2.
36
a 0.
et al., 2010). However, some leaf pair samples that experienced no nitrogen supply were misclassified as having been subjected to excessive nitrogen supply. This unreliability of the single data set was improved when the data sets were combined, thus all of the growth and spectral variables were used together, resulting in a 91.5% corr ectness in the classification. A few cases of misclassification were seen among the 0 to 1 or 5 to 50 mM NH4+ treatments. Thus, an NH
4
+ concentration
between 1 and 5 mM was suggested to be the nitrogen deficien cy th resh old below wh ich the gr owth is suppressed (TANENTZAP; BAZELY, 2009). The value between 1 and 5 mM was somewhat lower compared with the experiment conducted by ZHANG et al. (2005) in which 8 mM nitrogen as NO3- was provided to spinach in a
hydroponic system. In the current study, the root zone was not saturated with water, and this was thought to be the cause of the apparently low threshold nitrogen concentration.
The above results indicate that the combination of th e da ta set s faci litated th e discr i min ati on ,
compensating for each other’s weakness. This is thought to be due to the multiple groups of variables that had different patterns of change against the NH4+ gradient
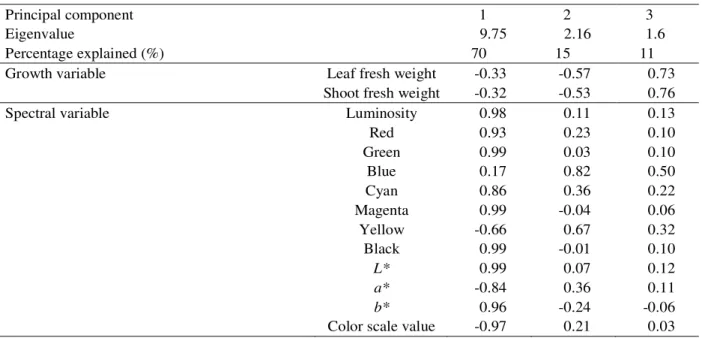
shown as multiple mean separation patterns in tables 2 and 3, e.g., between leaf weight and value of b*. This hypothesis was supported by results of the principal component analysis of the combined data set (Table 5). Three significant principal components (eigenvector > 1, Kaiser 1960) were obtained. Among the three principal components, the first principal component was largely contributed by most of the spectral variables such as green, while the second and third principal components were the growth variables. These results show that the data sets represent different aspects of the basil’s responses to the NH4+ gradient (DE SENA et al., 2000),
and were therefore advantageous to combine for the diagnosis (DOI et al., 2010). Although most of the variables showed quadratic patterns of change against the NH4+ gradient, there also existed different quadratic
patterns between the groups of variables that showed plant responses to the NH4+ gradient.
Table 4 – Predicted group membership of basil leaves as a result of discriminant analyses of the growth, spectral, and combined data sets.
* Weights of the first leaf pair and shoot.
** Intensity values of luminosity, red, green blue, cyan, magenta, yellow, black, and L*, values of a* and b*, and color scale value.
† Growth and spectral data sets combined.
NH4+
Concentration (mM)
CONCLUSIONS
This case study demonstrated the feasibility of the current plant diagnostic method. Widely available optical scanners can provide digital images of leaves. The greenness of the leaves can be easily and accurately calculated using the values of b*, and the intensity values of black and green for the leaves. Furthermore, the spectral data set assisted in the plant nutritional diagnosis that was based on the less reliable growth data set consisting of leaf and shoot weights. Because the leaf spectral profile often shows the physiological condition of the plant, this simple scanning and profiling method is worth considering, developing, and improving for applications in the management of crop production sites.
ACKNOWLEDGEMENTS
Ryoichi DOI is grateful to the Japanese Society for Promotion of Science for the Grant-in-Aid 22880011.
REFERENCES
BARNES, A.M.; WALSER, R.H.; DAVIS, T.D. Anatomy of Zea mays and Glycine max seedlings treated with triazole plant-growth regulators. Biologia Plantarum, Praha, v.31, n.5, p.370-375, 1989.
BEAMAN, A.R.; GLADON, R.J.; SCHRADER, J.A. Sweet basil requires an irradiance of 500 μmol m-2.s-1
for greatest edible biomass production. HortScience, Alexandria, v.44, n.1, p.64-67, 2009.
BRITTO, D.; KRONZUCKER, H. NH4+ toxicity in higher plants: A critical review. Journal of Plant Physiology, Jene, v.159, n.6, p.567-584, 2002.
BYJU, G.; ANAND, M.H. Leaf color chart and chlorophyll-meter-based leaf nitrogen estimation and their threshold values for real-time nitrogen
management in cassava. Communications in Soil Science and Plant Analysis, Philadelphia, v.40, n.17-18, p.2816-2832, 2009.
DE SENA, M. et al. Evaluation of the use of chemometric methods in soil analysis. Quimica Nova, São Paulo, v.23, n.4, p.547-556, 2000.
DOI, R. Physicochemical quantitative determination by multivariate profiling of color and statistic method. Patent application number 2010-097396, Japan. 3 April 2010.
DOI, R.; RANAMUKHAARACHCHI, S.L. Correlations between soil microbial and physicochemical variations in a rice paddy: Implications for assessing soil health. Journal of Biosciences, Bangalore, v.34, n.6, p.969-976, 2009. Table 5 – Eigenvectors for growth and spectral variables provided by principal component analysis of the combined data set†.
† The growth and the spectral data sets combined (see Table 4).
Principal component 1 2 3
Eigenvalue 9.75 2.16 1.6
Percentage explained (%) 70 15 11 Growth variable Leaf fresh weight -0.33 -0.57 0.73
Shoot fresh weight -0.32 -0.53 0.76 Spectral variable Luminosity 0.98 0.11 0.13 Red 0.93 0.23 0.10 Green 0.99 0.03 0.10 Blue 0.17 0.82 0.50 Cyan 0.86 0.36 0.22 Magenta 0.99 -0.04 0.06 Yellow -0.66 0.67 0.32 Black 0.99 -0.01 0.10
L* 0.99 0.07 0.12
a* -0.84 0.36 0.11
DOI, R.; RANAMUKHAARACHCHI, S.L.
Discriminating between canopies of natural forest and Acacia plantation plots in a Google Earth image to evaluate forest land rehabilitation by Acacia species. International Journal of Agriculture and Biology, Faisalabad, v.12, n.6, p.921-925, 2010.
DOI, R. et al. Semiquantitative color profiling of soils over a land degradation gradient in Sakaerat, Thailand. Environmental Monitoring and Assessment, Dordrecht, v.170, n.1-4, p.301-309, 2010.
FRIDGEN, J.L.; VARCO, J.J. Dependency of cotton leaf nitrogen, chlorophyll, and reflectance on nitrogen and potassium availability. Agronomy Journal, Madison, v.96, n.1, p.63-69, 2004.
FURUYA, S. Growth diagnosis of rice plants by means of leaf color. JARQ-Japan Agricultural Research Quarterly, Tsukuba, v.20, n.3, p.147-153, 1987.
GAUSMAN, H.W.; BURKE, J.J.; QUISENBERRY, J.E. Use of leaf optical-properties in plant stress research. ACS Symposium Series, Washington, v.257, p.215-233, 1984. JALEEL, C.A. et al. Drought stress in plants: A review on morphological characteristics and pigments
composition. International Journal of Agriculture and Biology, Faisalabad, v.11, n.1, p.100-105, 2009.
KAISER, H.F. The application of electronic computers to factor analysis. Educational and Psychological
Measurement, Thousand Oaks, v.20, n.1, 141–151. 1960. KAKUMANU, P.; MAKROGIANNIS, S.; BOURBAKIS, N. A survey of skin-color modeling and detection methods. Pattern Recognition, Kidlington, v.40, n.3, 1106–1122, 2007.
KELLER, M.; KOBLET, W. Dry-matter and leaf-area partitioning, bud fertility and second season growth of Vitis vinifera L - responses to nitrogen supply and limiting irradiance. Vitis, Siebeldingen, v.34, n.2, p.77-83, 1995.
KOPSELL, D.A.; KOPSELL, D.E.; CURRAN-CELENTANO, J. Carotenoid and chlorophyll pigments in sweet basil grown in the field and greenhouse. HortScience, Alexandria, v.40, n.5, p.1230-1233, 2005.
LEA-COX, J.D.; SYVERTSEN, J.P. How nitrogen supply affects growth and nitrogen uptake, use efficiency, and loss from citrus seedlings. Journal of the American Society for Horticultural Science, Alexandria, v.121, n.1, p.105-114, 1996.
MORTLAND, M.M. et al. Interaction between ammonia and expanding lattices of montmorillinite and vermiculite. Journal of Physical Chemistry, Washington, v.67, n.2, p.248-258, 1963.
OLSZEWSKA, M. et al. Effect of phosphorus deficiency on gas exchange parameters, leaf greenness (SPAD) and yield of perennial ryegrass (Lolium perenne L.) and orchard grass (Dactylis glomerata L.). Journal of Elementology, Olsztyn, v.13, n.1, p.91-99, 2008. PAL, N.L.; OJHA, R.J. Tobacco seedlings - damage by excessive nitrogen lessened by added phosphorus. Science, Washington, v.151, n.3706, p.106, 1966. PLANT, R.E. Site-specific management: The application of information technology to crop production.
Computers and Electronics in Agriculture, Kidlington, v.30, n.1-3, p.9-29, 2001.
ROMHELD, V.; MULLER, C.; MARSCHNER, H. Localization and capacity of proton pumps in roots of intact sunflower plants. Plant Physiology, Lancaster, v.76, n.3, p.603-606, 1984.
SANDOVAL-VILLA, M.; WOOD, C.W.; GUERTAL, E.A. Ammonium concentration in solution affects chlorophyll meter readings in tomato leaves. Journal of Plant Nutrition, New York, v.22, n.11, p.1717-1729, 1999. SHUVALOV, V.A. Electron and nuclear dynamics in many-electron atoms, molecules and chlorophyll-protein complexes: A review. Biochimica et Biophysica Acta-Bioenergetics, Amsterdam, v.1767, n.6, p.422-433, 2007. SICHER, R.C. Photosystem-II activity is decreased by yellowing of barley primary leaves during growth in elevated carbon dioxide. International Journal of Plant Sciences, Chicago, v.160, n.5, p.849-854, 1999.
TAKEBE, M.; YONEYAMA, T. Measurement of leaf color scores and its implication to nitrogen nutrition of rice plants. JARQ-Japan Agricultural Research Quarterly, Tsukuba, v.23, n.2, p.86-93, 1989.
TANENTZAP, A.J.; BAZELY, D.R. Propagule pressure and resource availability determine plant community invasibility in a temperate forest understorey. Oikos, Malden, v.118, n.2, p.300-308, 2009.
TOULIOS, L.G.; TOULIOS, M.G.; LIPIMENOU, E. Soil color relationships with reflectance spectra. Geocarto International, Hong Kong, v.13, n.2, p.35–42. 1998. VAN NIEL, T.G.; MCVICAR, T.R. Current and potential uses of optical remote sensing in rice-based irrigation systems: A review. Australian Journal of Agricultural Research, Victoria, v.55, n.2, p.155-185, 2004.
VARINDERPAL-SINGH et al. Need based nitrogen management using the chlorophyll meter and leaf colour chart in rice and wheat in south asia: A review. Nutrient Cycling in Agroecosystems, Dordrecht, v.88, n.3, p.361-380, 2010.
ZHANG, Y. et al. Effects of nitrogen levels and nitrate/ ammonium ratios on oxalate concentrations of different forms in edible parts of spinach RID A-3552-2009. Journal of Plant Nutrition, New York, v.28, n.11, p.2011-2025, 2005.