Abstract— Thermal stability of both standard and regenerated Bragg gratings written in normal and photosensitive optical fibers was accessed. An apparent spectral wavelength stabilization of common gratings with no thermal hysteresis was reached after thermal treatments. However, after a time interval of 5 months, gratings exhibited a shift in the resonance Bragg wavelength at room temperature, as well as important changes in the thermal sensitivity above 200 ºC. Regenerated gratings proved to be stable only at temperatures below the critical regeneration temperature, with significant loss of reflectivity above that critical value.
Index Terms—Bragg sensors, High temperature, Decay stability.
I. INTRODUCTION
Fiber Bragg gratings – FBG and recently regenerated-fiber Bragg gratings - RFBG have a great potential for applications as sensors. FBGs have been employed for sensing temperature, mechanical
strain, pressure and refractive index [1], [2], [3]. Any external parameter that affects the effective
refractive index of the fiber core and/or the grating period may result in a change of the reflected
wavelength and might be sensed. Despite their ubiquity, the long term thermal stability of FBG
sensors is an important issue to allow their efficient use. Spectral stability is related to the defects
responsible by the refractive index modulation that constitutes the FBG. These defects can be
thermally activated resulting in changes in the refractive index modulation and consequently affecting
spectral characteristics of the FBG based sensor. Due to this drawback, FBG temperature sensors are
usually employed in applications with typical operation temperatures below 200°C [4]. Along the past
few years, many process as thermal treatments and fiber co-doping were proposed to enhance the
FBG stability and lifetime [5]-[8]. Besides, a new class of grating produced by thermal regeneration
of fiber Bragg gratings, emerged as a solution for the sensors stability problems [9]-[11]. Mechanism
responsible by the FBG regeneration is not completely understood but it seems to be related to defects
diffusion [12] and silica compaction and densification [10], [13]. Regenerated fiber Bragg gratings –
Long-term stability decay of standard and
regenerated Bragg gratings tailored for high
temperature operation
F. K. Coradin1,2, V. de Oliveira1, M. Muller1, H. J. Kalinowski1, J. L. Fabris1
1
Universidade Tecnológica Federal do Paraná, Curitiba, Brasil
2
Faculdade Estácio de Curitiba, Curitiba, Brasil
RFBG, operate at high-temperatures and have been employed for measurements up to 1300 °C [14].
However, regeneration is performed by heating the FBG at high temperatures making the fiber brittle.
A packaged RFBG sensor was recently proposed to provide mechanical stability and the sensor
performance and response time were analyzed [15]. Despite the packaging does not interfere with the
RFBG short term sensitivity and repeatability, the measured recovering time of 22 seconds is a direct
consequence of the packaging.
In this work, efficiency of thermal treatments on the spectral stabilization of both standard and
Bragg and regenerated gratings written in normal and photosensitive optical fibers was accessed.
FBGs were submitted to thermal cycles at temperatures up to 425 °C while RFBGs were heated up to
900 ºC. Gratings long-term performance regarding sensitivity, hysteresis and spectral stability were
analyzed. Performance of a packaged RFBG was also evaluated.
II. METHODS
FBGs were produced in single mode (GF-1 from Nufern) photosensitive and standard (G-652 from
Draktel and Furukawa) single mode optical fibers whether hydrogenated or not for photosensitivity
enhancement. Inscription was carried out by direct phase mask (PM) laser illumination with KrF
(Coherent Xantos XS 500 or Coherent BraggStar Industrial-LN) at 248 nm, as well as with a phase
mask interferometer (PMI) under Nd:YAG laser illumination (New Wave Tempest-20) at 266 nm.
Fibers were hydrogenated at room temperature along 10 days in a 110 kgf/cm2 pressure chamber.
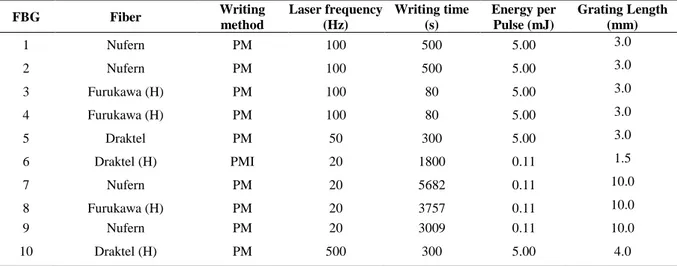
Table I summarizes main writing characteristics of produced FBG.
TABLE I. WRITING PARAMETERS OF FBGS EMPLOYED IN THE EXPERIMENTS (H– HIDROGENATED;PM-PHASE MASK;PMI-PHASE MASK INTERFEROMETER)
FBG Fiber Writing
method Laser frequency (Hz) Writing time (s) Energy per Pulse (mJ) Grating Length (mm)
1 Nufern PM 100 500 5.00 3.0
2 Nufern PM 100 500 5.00 3.0
3 Furukawa (H) PM 100 80 5.00 3.0
4 Furukawa (H) PM 100 80 5.00 3.0
5 Draktel PM 50 300 5.00 3.0
6 Draktel (H) PMI 20 1800 0.11 1.5
7 Nufern PM 20 5682 0.11 10.0
8 Furukawa (H) PM 20 3757 0.11 10.0
9 Nufern PM 20 3009 0.11 10.0
10 Draktel (H) PM 500 300 5.00 4.0
.
Thermal treatments (TT) were carried out in a furnace with a 1200 °C maximum temperature
operation. FBGs 1, 2, 3 e 4 were submitted to 3 warm-up/cooling-down cycles. For warm-up
temperature ranged from (25.0 ± 0.5) ºC to (425.0 ± 0.5) ºC in 45 minutes-long steps of 50 ºC each.
FBG1 and FBG3 were slowly cooled-down (annealing) by keeping them inside the furnace after
30 minutes-long step at (425.0 ± 0.5) ºC for a fast cooling-down (quenching). An optical spectrum
analyzer - OSA (Agilent 8614), with 0.06 nm resolution and ± 2 pm wavelength stability was
employed for acquisition of FBGs spectra.
FBGs 5, 6, 7 and 8 were submitted to 4 TT cycles: firstly, the gratings were heated up to (180.0 ±
0.5) ºC and kept at this temperature for 2 hours. Then, they were kept at (200.0 ± 0.5) ºC for 30
minutes and after at (400.0 ± 0.5) ºC for 2 hours. This last procedure was repeated 3 times. After each
cycle gratings were submitted to quenching.
After the TT, FBG5 and FBG6 thermal responses were evaluated by heating the gratings up to
(350.0 ± 0.5) ºC and measuring gratings spectra within temperature steps of 50 ºC. Five months later,
this procedure was repeated. Values of wavelength and reflectivity were obtained by averaging three
measurements obtained under repeatability conditions. Statistical dispersion associated with the
measurements was estimated for a confidence level of 68.3 % by means of the combined uncertainty
considering the standard deviation of the mean, as well as uncertainties associated with OSA stability
and temperature fluctuations.
A similar TT up to (400.0 ± 0.5) ºC was applied to FBG7 and FBG8. After, they were kept at
(500.0 ± 0.5) ºC along 6 hours and 30 minutes and at (600.0 ± 0.5) ºC for 6 hours and 40 minutes. A
subsequent TT at (700.0 ± 0.5) ºC was applied in four stages with the FBGs kept into the oven for: 9
hours and 30 minutes, 7 hours and 30 minutes, 8 hours and finally 7 hours. After each stage the
gratings were quenched. Subsequently 3 TT were carried out at (800.0 ± 0.5) ºC along 7 hours, 5
hours and 30 hours. A new warm-up/cooling-down cycle was carried out in order to evaluate the
thermal sensitivity of gratings. Additionally, FBG7 and FBG8 experienced two TT at (900.0 ± 0.5)
ºC, each one during time stages of 8 hours.
FBG9 was heated from the room temperature up to (900 ± 0.5) ºC in a first time interval of 10
minutes up to (300.0 ± 0.5) ºC and then in steps of 50 ºC along 35 minutes in each stage.
FBG10 was encapsulated prior the regeneration. For encapsulation, the grating was accommodated
inside a ceramic tube (4 mm internal / 6 mm external diameters, 530 mm long, one extremity closed)
constituted by Al2O3, heat-resistant up to 1950 °C. Protective acrylate was removed from the optical
fiber along 500 mm from the sensing tip with the grating, positioned close to the closed extremity of
the tube. The opposite open extremity was sealed with Pattex – NURAL 30 from Henkel Ibérica S.A.
(heat-resistant up to 1000 °C) in order to keep the fiber immobile.
Regeneration (RFBG10) was reached by rising the temperature from (23.0 ± 0.5) °C up to (850.0 ±
0.5) °C within a warm-up stage of 78 minutes and kept at this regeneration temperature for 550
minutes. After regeneration the grating experienced a quenching down to room temperature along a 6
hours stage. Spectra were measured with an optical interrogator (Micron Optics SM125, ±5 pm
wavelength stability) in the spectral range from 1510 to 1590 nm.
Thermal sensitivity of this probe was determined by submitting the set to warming-up steps 5
at constant temperature for 15 minutes. Spectra were measured 5 times at each constant temperature
under repeatability conditions and the temperature inside the furnace was monitored with a K-type
thermocouple positioned close to the grating. Thermal stability of the probe with RFBG10 was carried
out at (800.0 ± 0.5) °C throughout 490 minutes (55 minutes rise time from 23 °C to 800 °C plus 435
minutes at the final temperature).
III. RESULTS
FBGs 1, 2, 3 and 4 thermal responses during three cycles of TT up to (425.0 ± 0.5) ºC are shown in
Fig. 1.
Fig. 1. (a) FBG 1, (b) FBG2, (c) FBG3 e (d) FBG4 along the TT for 3 warm-up/cool-donwn cycles from (25.0 ± 0,5) ºC to (425.0 ± 0.5) ºC.
After each cycle, spectra were measured at room temperature. Linear equations were fitted to the
experimental data of each cycle in two temperature ranges, from (25.0 ± 0.5) ºC to (225.0 ± 0.5) ºC
(range I), and from (225.0 ± 0.5) ºC to (425.0 ± 0.5) ºC (range II). During the whole TT, FBG1 and
FBG2 showed constant reflectivity and wavelength stability was observed after the third cycle for
both FBGs in spite of grating cooling was fast or slow. As expected, FBG3 and FBG4 thermal
response is strongly influenced by the first heating, showing wavelength and reflectivity changes after
both wavelength and reflectivity. Molecular hydrogen diffusion out of the fiber activated by the
temperature is mainly responsible by the behavior observed at the first cycle. Thermal responses at the
two temperature ranges and the wavelength shift measured at room temperature after each cycle are
shown in Table II.
TABLE II. FBGS SENSITIVITY EVOLUTION ALONG 3 TT AND WAVELENGTH SHIFT AT ROOM TEMPERATURE AFTER EACH CYCLE
FBG TT (Heating) Range I (pm/ºC)
Range II
(pm/ºC) λ (nm)
1
1º 11.78 ± 0.10 14.49 ± 0.15 - 0.24 ± 0.02
2º 11.62 ± 0.10 14.39 ± 0.21 - 0.01 ± 0.01
3º 12.13 ± 0.10 13.98 ± 0.21 - 0.01 ± 0.01
2
1º 11.85 ± 0.09 13.51 ± 0.12 - 0.35 ± 0.02
2º 12.13 ± 0.10 13.98 ± 0.21 - 0.07 ± 0.01
3º 0.00 ± 0.01
3
1º - 1.18 ± 0.02
2º 11.91 ± 0.10 14.94 ± 0.20 0.01 ± 0.02
3º - 0.01 ± 0.01
4
1º - 1.35 ± 0.02
2º 12.61 ± 0.10 14.24 ± 0.21 0.02 ± 0.02
3º 0.00 ± 0.01
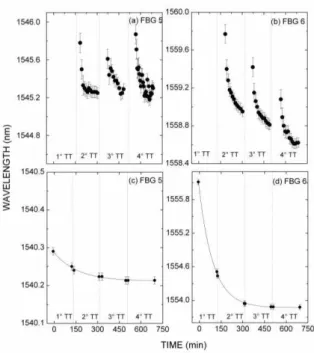
Fig. 2 shows the FBG5 (a) and FBG6 (b) time evolution of resonance at (400.0 ± 0.5) ºC and at
(20.0 ± 0.5) ºC during the TT. Data of Fig. 2(c) and 2(d) were fitted by an empirical exponential
curve. Due the presence of molecular hydrogen, FBG6 and FBG8 (not depicted here) presented larger
wavelength shifts and reflectivity loss than FBG5 and FBG7 (also not depicted here), mainly after the
end of first cycle.
After the third and fourth cycles of TT the Bragg wavelength tends to stabilize at room temperature.
However, at higher temperatures (200 ºC and 400 ºC) this behavior is no longer observed for FBG6
and FBG8. As can be seen from Fig. 2(d), important wavelength shifts are observed during all the TT
for FBG6, which means that the process was not efficient to stabilize the grating.
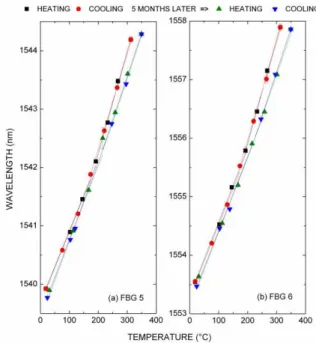
Five months later, thermal responses of FBG5 and FBG6, Fig. 3(a) and 3(b), were measured again
by heating the gratings up to (350.0 ± 0.5) ºC at steps of 50 ºC.
Fig. 3. Thermal response of FBG5 e FBG6 along warm-up and cooling-down cycles, measured just after the TT and 5 months later.
Thermal sensitivities were obtained by fitting a linear equation to the experimental data for ranges I
(from 20 ºC to 200.0 ºC) and range II (from 200.0 ºC to 350.0 ºC). The results are shown in Table III.
TABLE III. THERMAL SENSITIVITY OF FBG5 AND FBG6 JUST AFTER THE TT AND 5 MONTHS LATER.
FBG5 (pm/ºC) FBG6 (pm/ºC)
range I range II range I range II
1st heating 12.2 ± 0.1 17.6 ± 0.5 12.6 ± 0.2 17.9 ± 0.6
1st cooling 12.2 ± 0.1 16.3 ± 0.3 12.5 ± 0.1 16.7 ± 0.4
2nd heating 12.7 ± 0.1 14.9 ± 0.2 12.5 ± 0.1 14.3 ± 0.1
2nd cooling 13.5 ± 0.1 14.9 ± 0.2 12.8 ± 0.1 14.9 ± 0.2
A comparison between both thermal cycles indicates the TT was not effective to promote the
gratings stabilization. For each warm-up to (350.0 ± 0.5) ºC and subsequent cooling-down it was not
observed any important hysteresis in the Bragg wavelength. However, by repeating the same cycle 5
months later, a blue wavelength shift is observed. Although the thermal sensitivity is not modified up
to 200 ºC, gratings experience an important change in its sensitivities from 200.0 to 350.0 ºC. The
presence of hydrogen can be associated with a lower stability of defects responsible for the grating
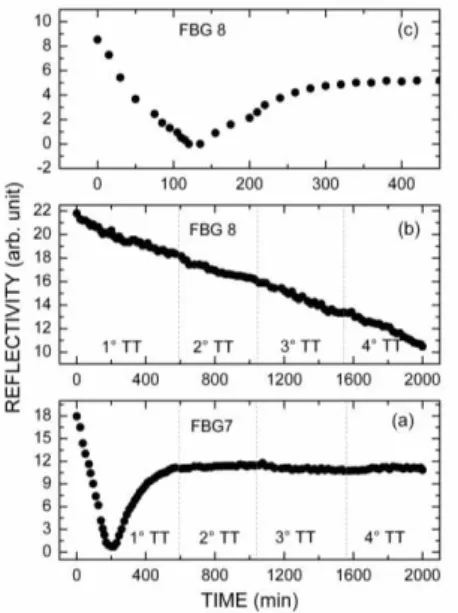
FBG7 and FBG8 were kept for long time intervals at higher temperatures, (500.0 ± 0.5) ºC and
(600.0 ± 0.5) °C, but significant wavelength or reflectivity changes were not observed. However,
when heated up to (700.0 ± 0.5) ºC (1oTT:9 hours and 30 minutes; 2oTT: 7 hours and 30 minutes,
3oTT: 8 hours and 4oTT: 7 hours), both gratings showed important spectral changes. Results are
presented in Fig. 4(a) and 4(b). At the first stage of TT, FBG7 were completely erased after 3 hours at
(700.0 ± 0.5) °C and a regenerated grating (RFBG) appeared at an approximately 0.3 nm longer
wavelength, reaching 60% of the initial reflectivity. In the next stages of TT (at 700.0 °C) after
regeneration, reflectivity and wavelength remained approximately unchanged. FBG8 presented loss of
reflectivity during the whole TT without noticeable wavelength change. With a further increase of
temperature up to (800.0 ± 0.5) ºC, RFBG7 experienced a 25% loss of reflectivity (not shown in Fig.
4), and FBG8 regenerated according to Fig. 4(c).
Fig. 4. TT at (700.0 ± 0.5) °C for (a) FBG7 and (b) FBG8; (c) TT at (800.0 ± 0.5) °C for FBG8. Vertical dotted lines indicate the separation between TT.
This RFBG8 presented a 2 nm wavelength blue shift after a 2 hours TT (800 °C), recovering about
60 % of its reflectivity. Along the next 30 hours at this temperature, RFBG7 showed an additional
12% loss of reflectivity without tendency for stabilization, in spite of its resonance wavelength
remained unchanged.
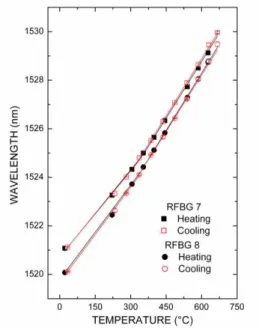
RFBG7 e RFBG8 regenerated at 700.0 e 800.0 °C, respectively, were submitted to a new 700 °C
(bellow the critical temperature for regeneration) warm-up and cooling-down cycle, Fig. 5, without
further noticeable spectral changes.
Table IV summarizes the thermal sensitivities of both gratings. For a new 48 hours-long TT at
(900.0 ± 0.5) ºC, both gratings were erased after 46 hours (RFBG7) and 9 hours (RFBG8), without
Fig.5. Thermal response of RFBG7 and RFBG8 bellow the critical temperature for regeneration. TABLE IV. THERMAL SENSITIVITIES OF RFBG7 E RFBG8.
RFBG7 (pm/ºC) RFBG8 (pm/ºC) range I range II range I range II heating 12.0 ± 0.2 15.5 ± 0.1 13.0 ± 0.1 15.8 ± 0.2 cooling 11.8 ± 0.1 15.7 ± 0.1 13.1 ± 0.1 15.4 ± 0.1
FBG9 was submitted to a short-term TT in 35 minutes-long steps from room temperature up to 900
ºC. Wavelength shift thermal behavior can be described by a single linear function with a (13.8 ± 0.1)
pm/ºC slope. As expected, grating reflectivity decreased as the temperature was raised, erasing
completely at (850.0 ± 0.5) ºC but without revealing regeneration within the employed temperature
range. Such results show the regeneration is strongly dependent on the fiber constituents, as well as
the fiber must be kept at the critical temperature for an adequate long time interval. For the
regenerated grating, blue or red wavelength shifts for the resonance may occur also dependent on the
fiber constituents.
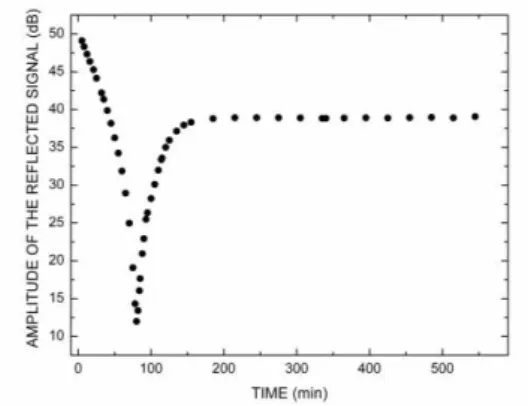
Fig. 6 shows the time-evolution of FBG10 (encapsulated) reflected signal kept at (850.0 ± 0.5) °C.
Amplitudes in dB correspond to the difference between the measured amplitude at resonance
wavelength and the average noise out of resonance. As the temperature was raised from the room
temperature to the set-point, the reflected amplitude showed a constant value about 50.5 dB, starting
to decrease at (850.0 ± 0.5) °C. After 80 minutes the amplitude dropped to a minimum value of 11.9
dB (a decrease of about 38.6 dB). In the next 90 minutes, the grating regenerated reaching maximum
Fig. 6. Time-evolution of FBG10 reflected signal, regenerated at (850.0 ± 0.5) °C.
After regeneration, thermal stability of encapsulated RFBG10 was probed at 800 °C along 490
minutes. It was observed increases in both the resonance wavelength at 2.79 x10⁻⁴ nm/minute rate and
the reflectivity at 2.74 x10⁻⁴ dB/minute rate. Along 435 minutes, shifts in the wavelength of 0.12 nm
and 0.12 dB in the reflectivity were measured; an indicative of the regeneration process was not
complete after the initial TT.
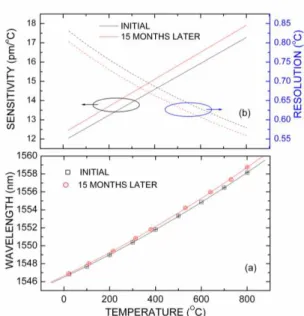
Long-term stability was checked for RFBG10. Fig. 7(a) shows the thermal response the
encapsulated grating just after the regeneration and 15 months later, where each experimental point is
comprised of measurements taken under repeatability conditions. The thermal cycle from room
temperature up to (800.0 ± 0.5) °C and back to 23 °C are superimposed, indicating the stability of the
device and the absence of thermal hysteresis. Statistical dispersion [16] associated with the
measurements was estimated for a confidence level of 68.3 % by means of the combined uncertainty
considering the standard deviation of the mean, as well as uncertainties associated with wavelength
stability of SM125 interrogator and temperature fluctuations [17]. In Fig. 7(a), the resulting error bars
are smaller than the symbols size. A second order polynomial calibration curves were fitted to the
experimental points and its derivatives represent the thermal sensitivities in Fig. 7(b). Resolution is
also depicted in Fig. 7(b) and was calculated by considering the thermal sensitivities curves and the
SM125 wavelength stability.
The non-linear behavior does not present any thermal hysteresis in the thermal cycle for the same
experiment. However, after 15 months, besides a positive 0.14 nm hysteresis (estimated at 0o C) there
are also changes in sensitivity and resolution. Fig. 7(b) shows the sensitivity increases to the whole
dynamic range as the temperature increases, with a consequent better resolution for the measurement.
A 0.56 oC resolution at 800 oC is obtained, but for a good performance the sensor requires a periodic
calibration. If the initial calibration curve is employed after 15 months, a 721.4 oC value is obtained
Fig. 7. RFBG10 after regeneration (black) and 15 months later (red): (a) thermal response, (b) thermal sensitivity and resolution.
IV. CONCLUSION
In this work, thermal treatments of FBGs at 400 °C developed an apparent thermal stabilization,
independently whether the time evolution of warm-up and cooling-down cycles, type of fiber, writing
process or hydrogenation. For all studied gratings, such apparent stabilization was reached after 3
cycles of thermal treatment, the lack of thermal hysteresis misleading to consider the transductor as
completely stabilized.
However, long-term assessment showed the thermal stabilization was not reached after the thermal
treatment, this effect being more pronounced with hydrogenated Draktel fiber: after 5 months gratings
were still instable even operating below the temperature of thermal treatment. Spectral changes
occurred at room temperature, and additionally important changes in the thermal sensitivity were
found above 200 ºC. Such changes were more noticeable for hydrogenated fiber, what suggests the
instability can be associated with defect-hydrogen in silica.
By keeping similar gratings (FBG7 and FBG9) under dissimilar thermal treatments it was
established the grating regeneration is facilitated by employing long-term (~hours) instead of short
(half-hour) processes. Furthermore, the critical temperature for regeneration is strongly dependent on
the fiber constituents.
Regenerated gratings were not stable when heated above the critical temperature for regeneration,
and revealed to be just apparently stable under this temperature: although thermal hysteresis was not
verified in short-term operation, prolonged storage impaired the metrological characteristics of the
sensor, mainly its calibration curve. The need for regular recalibration must be considered to confer
reliability to the sensor: along the 15-month storage time of RFBG10, the encapsulated sensor head
ACKNOWLEDGMENT
The authors acknowledge financial support received from the following Brazilian agencies: CAPES, CNPq, Fundação Araucaria, FINEP and ANP (PRH-ANP/MCT-PRH10-UTFPR).
REFERENCES
[1] K. O. Hill, , G Meltz, “Fiber Bragg grating technology fundamentals and overview,” Journal of Lightwave and Technology, vol. 15, issue 8, pp. 1263-1276, 1997.
[2] A. D. Kersey, M. A. Davis, H. J. Patrick, M. LeBlanc, K. P. Koo, C. G. Askin, M. A. Putnam, E. J. Friebele, “Fiber grating sensors,” Journal of Lightwave Technology, vol. 15, no. 8, pp. 1478-1463, 1997.
[3] E. Lindner, C. Chojetztki, S. Brueckner, M. Becker, M. Rothhardt, J. Vlekken, H. Bartelt, “Arrays of Regenerated Fiber Bragg Gratings in Non-Hydrogen-Loaded Photosensitive Fibers for High-Temperature Sensor Networks,” Sensors vol. 9, no. 10, pp 8377-8381, 2009.
[4] S. R. Baker, H. N. Rourke, V. Baker, D. Goodchild, “Thermal decay of fiber Bragg gratings written in boron and germanium codoped silica fiber,” Journal of Lightwave Technology, vol. 15, pp. 1470-1477, 1997.
[5] H. Patrick, S. L. Gilbert, A. Lidgard, M. D. Gallagher, “Annealing of Bragg gratings in hydrogen-loaded optical fiber,” Journal Applied Physics, vol. 78, pp. 2940-2945, 1995.
[6] G. Brambilla, L. Reekie, C. Contardi, D. Milanese, M. Ferraris, “Bragg gratings in ternary SiO2: SnO2: Na2O optical glass fibers,” Optics Letters, vol.25, no. 16, pp. 1153-1155, 2000.
[7] E. M. Dianov, K. M. Golant, , R. R. Khrapko, A. S. Kurkov, , B. Leconte, M. Douay, P. Bernage, P. Niay, “Grating formation in a germanium free silicon oxinitride fibre,” Electronics Letters, vol. 33, no. 3, pp. 236-238, 1997.
[8] Q. Wang, A. Hidayat, P. Niay, M. Douay, “ Influence of Blanket Postexposure on the Thermal Stability of the Spectral Characteristics of Gratings Written in a Telecommunication Fiber Using Light at 193 nm,” Journal of Lightwave Technology, vol. 18, no. 8, pp. 1078-1083, 2000.
[9] S. Bandyopadhyay, J. Canning, M. Stevenson, K. Cook, “Ultra-high temperature regenerated gratings in boron codoped germanosilicate optical fibre using 193 nm,” Opt. Lett., vol. 33, pp. 1917–1919, 2008.
[10] J. Canning, M. Stevenson, S. Bandyopadhyay, K. Cook, “Extreme silica optical fibre gratings,” Sensors, vol. 8, pp. 6448–6452, 2008.
[11] J. Canning, S. Bandyopadhyay, M. Stevenson, P. Biswas, J. Fenton, M. Åslund, “Regenerated Gratings,” Journal of European optical Society-Rapidy Publications, 4, no. 09052, 2009.
[12] M. Fokine, “Formation of thermally stable chemical composition gratings in optical fibers,” Journal Optical Society of America B, vol. 19, issue 8, pp. 1759-1765, 2002.
[13] E. Lindner, C. Chojetztki, S. Brueckner, M. Becker, M. Rothhardt, H. Bartelt, “Thermal regeneration of fiber Bragg gratings in photosensitive fibers,” Opt. Expr, vol. 17, pp. 12523–12531, 2009.
[14] M. L. Åslund, J. Canning, F. Hongyan, H. Tam,“Rapid disappearance of regenerated Fibre Bragg Gratings at Temperatures approaching 1500 ºC in Boron-codoped Germanosilicate Optical Fibre,” 4th European Workshop on Optical Fibre Sensors-EWOFS’2010, Porto, Portugal, 2010.
[15] D. Barrera, V. Finazzi, J. Villatoro, S. Sales, V. Pruneri, “Packaged Optical Sensors Based on Regenerated Fiber Bragg Gratings for High Temperature Applications,” IEEE Sensors Journal, vol. 12, no. 1, pp. 107-111, 2012.
[16] Evaluation of measurement data – Guide to the expression of uncertainty in measurement, JGCM 100:2008, published by BIPM in the name of BIPM, IEC, IFCC, ILAC, ISO, IUPAC, IUPAP and OIML, 2008.