Palavras chave: Pinus brutia Talhão pós-incendio Classe de copa Diferenciação Iniciação do talhão Histórico: Recebido 09/11/2016
Aceito 16/12/2016 Keywords:
Pinus brutia
Post-fire stands Crown class Differentiation Stand initiation
1 Democritus University of Thrace - Orestiada, Greece Correspondência:
DOI: 10.1590/01047760201723012260
Diamantis Bountis1, Elias Milios1
DOES CROWN CLASS CLASSIFICATION IMPROVE THE INITIATION AND DEVELOPMENT ANALYSIS OF POST-FIRE PINUS BRUTIA STANDS?
ABSTRACT: The present study was conducted in Pinus brutia Ten. stands which were
created after the forest fire of 1989, in the island of Thassos. In 2008, 45 plots of 5 x 5 m
were randomly established in three site types. In each plot, the trees were counted, while
the breast height diameter of trees was measured. All trees were classified as dominant,
codominant, intermediate or suppressed. In each plot, one tree from each crown class
was selected (a total of 160 trees) and were cut down. From each tree a cross-sectional
disc was cut from the ground level and the number of annual growth rings was counted.
A few years of age difference between trees in post fire establishment determined the
crown class of a tree. The age difference and the number of trees were reduced from the less productive site type to the more productive site type. Codominant trees were (or will
become) the crown class with the most numerous trees in the main canopy. Dominant trees were one of the most, if not the most, significant elements of stand structure and
production regarding basal area. This was not the case in low productivity site type as a result of delayed dimension differentiation. Analysis of young P. brutia stands, through the
classification of trees into crown classes, increased the amount of attained information,
since it provided an improved insight in the competition regime.
A CLASSIFICAÇÃO DA CLASSE DE COPA MELHORA A ANÁLISE DA INICIAÇÃO E DESENVOLVIMENTO DE TALHÕES DE PINUS BRUTIA APÓS OCORRENCIA DE FOGO?
RESUMO: O presente estudo foi conduzido em talhões de Pinus brutia Ten. que foram
criados após o incêndio florestal de 1989, na ilha de Thassos. Em 2008, 45 parcelas de 5 x 5 m foram estabelecidas aleatoriamente em três tipos de sítos. Em cada parcela, as árvores foram contadas e o diâmetro a altura do peito das árvores foi medido. Todas as árvores foram classificadas como dominantes, codominantes, intermediárias ou suprimidas. Em cada parcela, uma árvore de cada classe de copa foi selecionada (um total de 160 árvores) e cortada. De cada árvore foi cortado um disco transversal no nível do solo e contado o número de anéis de crescimento. Uma diferença de alguns anos de idade entre as árvores após o estabelecimento pós-fogo determinou a classe de copa da árvore. A diferença de idade e o número de árvores foram reduzidos do sítio menos produtivo para o mais produtivo. As árvores codominantes foram (ou se tornarão) a classe de copa com mais árvores no dossel principal. As árvores dominantes foram um dos elementos mais significativos, se não o mais significativo, da estrutura e produção do talhão em relação à área basal. Este não foi o caso no sítio de baixa produtividade devido ao atrazo da diferenciação do tamanho das árvores. A análise dos povoamentos jovens de P. brutia, através da classificação das árvores em classes
DEVELOPMENT ANALYSIS OF POST-FIRE PINUS BRUTIA STANDS?
INTRODUCTION
Pinus brutia Ten. is a species of eastern Mediterranean basin. It is naturally distributed in Greece, Turkey, Cyprus, Caucasus, Krimea, Iraq, Iran and Middle East (KORAKIS, 2015). Pinus brutia is a fast growing (KITIKIDOU et al. 2011, KITIKIDOU et al. 2012) light demanding species (KORAKIS, 2015). However,
according to Petrou and Milios (2012) P. brutia trees and low shrubs facilitate the establishment and survival of
the species’ seedlings beneath their canopy in the first growing season of seedlings in abandoned fields in central
Cyprus, where the environmental conditions are harsh. All seedlings established in ground without vegetation were dead by the end of the growing season as a result of high abiotic stress. Pinus brutia can form productive
natural and artificial forests (BOYDAK et al. 2006).
There are lots of studies on Post-fire regeneration
of the species (THANOS et al. 1989, THANOS and
MARKOU 1991, SPANOS et al. 2000, SPANOS et
al. 2001). However, even though, there are many
researches regarding the age structure of regeneration
plants after a fire, there is no research in the tree age range and distribution in the duration of stem exclusion
stage, a few years after the end of stand initiation stage. The result of competition process in an even aged stand is the differentiation into crown classes (OLIVER and LARSON 1996). This classification is useful in the implementation of the various silvicultural treatments (SMITH et al. 1997, RENTCH et al. 2009, DEY, 2014) as well as in the understanding of stands structures and
development patterns. Adesoye (2014) reported that the usage of canopy layers (crown classes) improved volume
predictions in pure stands of Pinus caribaea Moleret in South West Nigeria.
In the crown thinning method, the crop trees come,
if possible, from dominant (and secondly from codominant)
crown class while the trees that are cut are mainly codominants even though in some cases dominant or intermediate trees are removed (SMITH et al. 1997). As a result, there is a research interest regarding growth and characteristics
of dominant trees (ADAMOPOULOS et al. 2009,
DIAMANTOPOULOU et al. 2009, DIAMANTOPOULOU
et al. 2010, ADAMOPOULOS et al. 2012, KITIKIDOU et al.
2015, CASTRUITA – ESPARTZA et al. 2016).
In the analysis of structures in young stands the determination of the density of the trees that belong to different crown classes, under different site conditions, may give a better insight in the competition regime of stands. Moreover, analyses of the age of trees that belong to different crown classes enhance our understanding of the differentiation process of the trees, as well as the
influence of establishment time in their future growth
and competition ability. This information provides a basis for improved and prompt silvicultural treatments.
The analysis of stand structure of young P. brutia
stands that were initiated after a disturbance such as a
fire, using analysis of tree crown classes, will increase our
understanding of the ecology of the species.
The objectives of this study are: a) analysis of the classification of trees in crown classes, of young P. brutia stands, initiated after the fire of 1989 on the Greek island of Thassos b) to analyze the establishment and
differentiation of trees in crown classes through age
structure analysis of trees, as well as c) the determination of the contribution of crown class classification of trees in
the understanding of stand development patterns of the species in various site conditions.
MATERIALS AND METHODS
Study area
The study was carried out on the Greek island of Thassos in north Aegean, in an area that was burned down
in the fire of 1989 where 5600 ha of P. brutia forest were destroyed (KAILIDIS and KARANIKOLA 2004). A site, located in the northern part of the island, was used. It covers
an area of 107 ha (40o 46’ 36’’, 24o 38’40’’). The geological substrate is metamorphic limestone and the forest soil is clay - sandy, clay - gravelly, while in some locations it is skeletal (HLIKAS and KONTOS 1997). The orientation is
northern the slopes range from 10 to 40% and the altitudes range from 300 to 600 m. The studied stands followed their
natural development since no treatment took place after establishment of regeneration plants.
In the nearest meteorological station (elevation of
3 m), the mean annual precipitation is 777.3 mm, and the mean annual air temperature is 15.2 oC (data from National Meteorological Service, analysis from Forest Service of Thassos).
Methods
In the studied sites, in places where the tree canopy cover of P. brutia was over 95% soil profiles were made in order to determine site productivity types based in soil depth. Three site types were determined: site
type A (STA) were areas classified as having soil depth of 50 – 60 cm. Site type B (STB) were areas classified as having soil depth of 30 – 35 cm, while areas having soil depth of 20 – 25 cm were classified as site type C (STC).
63
In the wider study area the summer dry period is about
3 months and thus water is a growth limiting factor. Soil depth has been used for site productivity classification in
many studies in Greece (ADAMOPOULOS et al. 2009,
PAPALEXANDRIS and MILIOS 2010, STAMPOULIDIS et
al. 2013). However in areas where water is not the growth
limiting factor it seems that soil depth is not a robust surrogate of site productivity (PETROU et al. 2015).
Site type A (STA) was considered to be a good productivity site, while site type B (STB) and site type C (STC) were considered to be medium and low productivity sites respectively. These classifications were verified by the site index curves that have been built for the burned area by Kitikidou et al. (2011). In these
curves, among other trees, the trees that were cut in the present study were also used. The base age in the curves of that study was 16 years (KITIKIDOU et al. 2011).
The actual mean height of dominant trees at the
age of 16 years was estimated to have been 8.2 m for STA, 6.0 for STB and 4.0 m for STC.
In all site types Arbutus adrachne L., Arbutus unedο
L., Cistus incanus L., Cistus salvifolius L., Erica manipuliflora L., Cercis siliquastrum L., Pistacia terebinthus L. appeared as the principle individual plants in the understory.
In each site type, during the growth period of 2008, 15 rectangular plots of 5 x 5 m were established at random. At the center of each plot, a soil profile was made in order to verify the plot classification in a site type. In case of doubt, more soil profiles were made. In each plot, the trees
were counted. The breast height diameter of trees having
diameter 2 cm and above was measured and the basal area
of these trees were calculated. Moreover, all trees were
classified as dominants, codominants, intermediates and
suppressed according to the crown class they belonged (SMITH et al. 1997).
In each site type, in each plot one dominant, one codominant, one intermediate and one suppressed
(whenever suppressed trees were present) tree were selected using stratified random sampling method
(ILLOWSKY and DEAN, 2008) and were cut. In total, 160
trees were cut from the 45 plots that were established. From each tree a cross-sectional disc was cut at ground
level and the number of annual growth rings was counted using a stereoscope.
In the data collection scheme of tree density and the basal area sum of trees per plot, the following
experimental design was applied: The 5 x 5 m plot was considered as the experimental unit and the design
includes two factors, one factor ‘‘between’’ and one
‘‘within’’ the experimental units. The ‘‘between’’ factor
was the ‘‘site type’’ and the ‘‘within’’ factor was the
‘‘crown class’’. The ‘‘site type’’ had three levels, site
type A (STA), site type B (STB) and site type C (STC).
The ‘‘crown class’’ also had three levels, dominant trees
(D), codominant trees (C) and intermediate trees (I). The experimental design was balanced (with the same number of plots for each site type).The suppressed trees
were not included since they were not found in all site types. Moreover, most of them were almost dead as a result of intense suppression.
Statistical Analysis
Tree density and basal area sum of trees data were analyzed using the ANOVA method in the frame
of General Linear Models (GLMs). Comparisons were
made using the Bonferroni test (ILLOWSKY and DEAN
2008). The GLM that corresponds to this experimental
design includes the main effects of the two factors: ‘‘site type’’, and ‘‘crown class’’ as well as their interaction.
Results
Suppressed trees appeared only in STB and STC
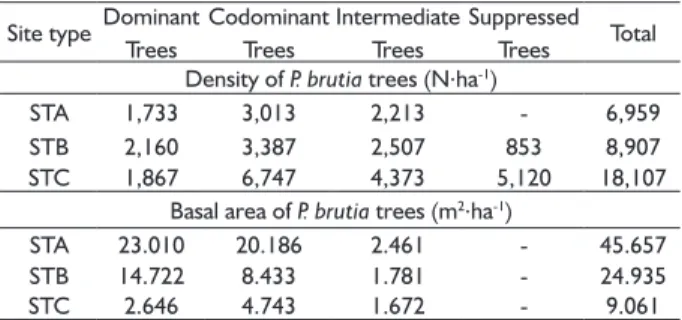
(Table 1). The total number of trees was 6,959.ha-1 in
STA, 8,907.ha-1 in STB and 18,107.ha-1 in STC (Table 1).
Basal area ranged from 9.061 m2.ha-1 in STC to
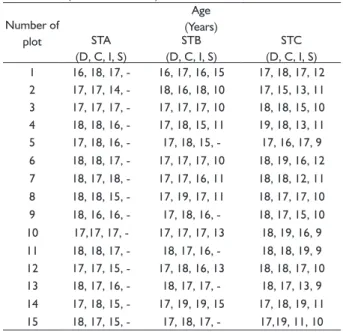
45.657 m2.ha-1 in STA (Table 1). Trees found in STA began to be established two years (growth periods) after the forest fire and their establishment continued for four
years. Inside plots the age difference among dominant, codominant and intermediate trees ranged from zero to three years. In most cases, the intermediate tree had a lower age than the dominant and the codominant tree
in each plot (Table 2). Trees found in STB began to be established one year (growth period) after the forest fire
and their establishment continued for nine years. Inside the plots the age difference among dominant, codominant and intermediate trees ranged from zero to three years, while, if suppressed trees were to be included in the age difference calculation, the range of the age gap will rise
from one to eight years (Table 2).
TABLE 1 Density and basal area of P. brutia trees in the different site types.
Site type Dominant Trees
Codominant Trees
Intermediate Trees
Suppressed Trees Total Density of P. brutia trees (N.ha-1)
STA 1,733 3,013 2,213 - 6,959
STB 2,160 3,387 2,507 853 8,907
STC 1,867 6,747 4,373 5,120 18,107
Basal area of P. brutia trees (m2.ha-1)
STA 23.010 20.186 2.461 - 45.657
STB 14.722 8.433 1.781 - 24.935
STC 2.646 4.743 1.672 - 9.061
DEVELOPMENT ANALYSIS OF POST-FIRE PINUS BRUTIA STANDS?
Trees found in STC began to be established one
year (growth periods) after the forest fire and their
establishment continued for ten years. Inside the plots the age difference among dominant, codominant and intermediate trees ranged from one to eight years, while, if suppressed trees were to be included in the age difference calculation, the range of the age gap rises to
six to ten years (Table 2).
ANOVA analysis indicated that the factor ‘‘site
type’’ (ST) (F(2,42) = 41.801, p = 0.000), the factor ‘‘crown class’’ (CC) (F(2,84) = 65.622, p = 0.000), as well as their interaction (F(4,84) = 15.910, p = 0.000) had a statistically significant influence on tree density.
Based on these results the interaction of the factors “site type” and “crown class” was analyzed. In STC
codominant trees had the higher density (p<0.05), while the dominant trees showed the lowest density (p<0.05) (Table 3). On the other hand, on the other two site types (STA, STB) codominants exhibited higher density than dominants (p<0.05), but intermediate trees did not
show any difference in tree density from the other two
categories of trees (p>0.05) (Table 3).
Moreover, ANOVA analysis indicated that the
factor ‘‘site type’’ (ST) (F(2,42) = 35.323, p = 0.000), the factor ‘‘crown class’’ (CC) (F(2,84) = 89.327, p = 0.000), as well as their interaction (F(4,84) = 22.669, p = 0.000) had a statistically significant influence on
basal area sum of trees per plot. Based on these results the interaction of the factors “site type” and “crown
class” was analyzed. In STB the dominant trees had
the higher basal area sum per plot (p<0.05), while the
intermediates showed the lowest basal area sum per plot
(p<0.05) (Table 4).
In STA intermediates showed the lowest basal area sum per plot, while there was no difference in the sum of basal area between dominant and codominant
trees (p<0.05). In STC, there were no differences
among the three categories of trees in the basal area sum
per plot (p>0.05) (Table 4). TABLE 2 Age of P. brutia trees of the different crown
classes, which were cut, in the three site types (STA, STB, STC).
Number of plot
Age
(Years)
STA
(D, C, I, S)
STB
(D, C, I, S)
STC
(D, C, I, S)
1 16, 18, 17, - 16, 17, 16, 15 17, 18, 17, 12
2 17, 17, 14, - 18, 16, 18, 10 17, 15, 13, 11
3 17, 17, 17, - 17, 17, 17, 10 18, 18, 15, 10
4 18, 18, 16, - 17, 18, 15, 11 19, 18, 13, 11
5 17, 18, 16, - 17, 18, 15, - 17, 16, 17, 9
6 18, 18, 17, - 17, 17, 17, 10 18, 19, 16, 12
7 18, 17, 18, - 17, 17, 16, 11 18, 18, 12, 11
8 18, 18, 15, - 17, 19, 17, 11 18, 17, 17, 10
9 18, 16, 16, - 17, 18, 16, - 18, 17, 15, 10
10 17,17, 17, - 17, 17, 17, 13 18, 19, 16, 9
11 18, 18, 17, - 18, 17, 16, - 18, 18, 19, 9
12 17, 17, 15, - 17, 18, 16, 13 18, 18, 17, 10
13 18, 17, 16, - 18, 17, 17, - 18, 17, 13, 9
14 17, 18, 15, - 17, 19, 19, 15 17, 18, 19, 11
15 18, 17, 15, - 17, 18, 17, - 17,19, 11, 10
D = dominant tree, C = codominant tree, I = intermediate tree S = suppressed tree, STA = site type A, STB = site type B, STC = site type C.
TABLE 3 Mean density of dominant, codominant and intermediate P. brutia trees in each site type (interaction of the factors “site type” and “crown class”).
Site type Crown class
Density of P. brutia trees (n.plot-1)
n Mean Standard
Deviation
STA
Dominant 4.33b 1.799 15
Codominant 7.53a 1.959 15
Intermediate 5.53ab 2.560 15
STB
Dominant 5.40b 1.549 15
Codominant 8.47a 2.997 15
Intermediate 6.27ab 2.017 15
STC
Dominant 4.67c 1.047 15
Codominant 16.87a 5.249 15
Intermediate 10.93b 2.120 15
In each level of the factor site, means followed by different letters are statistically different, at P < 0.05. The comparison was made using the Bonferroni test. STA = site type A, STB = site type B, STC = site type C.
TABLE 4 Mean basal area sum per plot of dominant, codominant and intermediate P. brutia trees in each site type (interaction of the factors “site type” and “crown class”).
Site type Crown class
Basal area sum of P. brutia trees (m2.plot-1)
n Mean Standard
Deviation
STA
Dominant 0.058a 0.024 15
Codominant 0.050a 0.026 15
Intermediate 0.008b 0.005 15
STB
Dominant 0.037a 0.009 15
Codominant 0.021 b 0.016 15 Intermediate 0.004 c 0.001 15
STC
Dominant 0.007 a 0.002 15
Codominant 0.012 a 0.003 15 Intermediate 0.004 a 0.001 15
In each level of the factor site, means followed by different letters are statistically different, at P < 0.05. The comparison was made using the Bonferroni test. SD = standard deviation, STA = site type A, STB = site type B, STC = site type C.
Discussion
Differentiation of dimensions in trees in single cohort stands that leads to crown differentiation is the result of species, tree spacings, differences in
establishment time (age differences), microsites and
genetic makeup (OLIVER and LARSON, 1996).
65
determine the crown class of a tree. According to Oliver
and Larson (1996), where early growth is rapid, younger
trees are at disadvantage in the differentiation process. In STB and STC, all suppressed trees had lower age than the other crown classes found in the same plot (Table
2). On the other hand, most of the dominant trees in all
site types were of higher or equal age compared to trees
of other crown classes found in the same plot (Table 2).
Only in rather few cases dominant trees were one or two years younger than the codominant or intermediate trees. This means that when the age difference is up to two years, the differentiation process is determined mainly by the rest above-mentioned factors.
Establishment of trees began one (STB, STC) to two years (growth periods) (STA) after the fire.
However, it is possible that some of the trees that were
cut were established in autumn just after the fire but their
growth in that period was very little and not detected in
the cross-sectional discs. Spanos et al. (2000) mentioned
that establishment of seedlings in the study area began
one year after the fire as a result of a severe drought observed after the fire and during autumn. However,
they also reported that all the seedlings emerged in
the first growth period after the fire. Contrary to that,
according to the present study the initiation stage of
P. brutia lasted for many years. Probably, the period of establishment of seedlings was longer but some of the regenerated plants died as a result of competition in the
stem exclusion stage leading to a smaller age difference
(OLIVER and LARSON, 1996). This pattern is probably
the result of existing seed trees that survived the fire and continued to supply seeds. Thanos et al. (1989) cited that the existence of a wave of regeneration establishment during the second year after the fire of 1981 on the island
Samos in Greece could have been the result of unburnt
seed trees in adjacent areas.
The age difference of trees inside site type and in a plot was reduced from the less productive site type
(STC) to the most productive site (STA). This tendency
became more obvious if suppressed trees were not taken into account.
The density of P. brutia trees in the low productivity site type is very high. The density of P. brutia trees in the three site types ranged from 6,959 in STA to 18,107 n.ha-1 in STC (Table 1). According to Oliver and Larson (1996) a greater number of trees occupies growth space
in poor sites compared to that of productive sites after a disturbance.
The density of all site types is considered to be
high when compared to other studies. For seedlings established after the same fire on the island of Thassos, Spanos et al. (2000) found a mean density range between
20,000 and 60,000 n.ha-1 in the first growth period after the fire, while five years later the range became 6,000 to 20,000 n.ha-1. For the same island twelve years after the fire of 1985 Spanos et al. (2001) found a mean density that ranged from 877 in infertile sites to 5,665 n.ha-1 in fertile sites. On the Samos island 15 months after the fire of 1983 Thanos et al. (1989) stated that the mean
density of P. brutia seedlings ranged between 1,400 (0.14)
to 7,600 (0.76) n.ha-1 (n.m-2). Concerning the same fire the overall density of 6 years old regeneration plants
became around 1,500 (0.15) n.ha-1 (n.m-2) (THANOS and MARKOU, 1991). Tsitsoni et al. (2004) 20 years after the
fire of 1982 in the artificial P. brutia peri-urban forest of Thessaloniki in Greece reported rather close densities with the present study. In particular, in un-thinned stands
they found a density of 12,000 in fertile site to 10,600
in medium productivity site. However, in this case (as
in researches mentioned above), in contrast with the present study (Table 1) they found a greater number of
trees in the productive site compared to that of medium productivity site.
According to Smith et al. (1997) the codominant
trees are usually the most numerous crown class that constitutes the main canopy. In STC codominant trees had greater density than the intermediate and dominant
trees (p<0.05) and the intermediate class exhibited more trees that the dominant crown class (p<0.05) (Table 3).
In STA and in STB codominant trees had greater density
than dominant trees (p<0.05) and intermediate trees did not exhibit differences in density from codominant and dominant trees (p>0.05). If we accept that the main
canopy is formed by dominant and codominant trees,
then our results agrees with Smith et al. (1997), but if we
consider that the main canopy is composed by dominant, codominant and intermediate trees then the codominant
trees, in two site types (STA and STB), were far from being the majority in the main canopy. However, in the
future, in all site types many intermediate trees will die
as a result of low light conditions or some (fewer) will
become codominant trees. Even in the case where some codominants will become dominants these will be by far fewer than intermediates that will become codominants or die. As a result of those mentioned above codominant trees will be the crown class with the most numerous trees in the main canopy.
DEVELOPMENT ANALYSIS OF POST-FIRE PINUS BRUTIA STANDS?
particular, almost all basal area came from dominant and
codominant trees. For Nothofagus pumilio (Poepp. &
Endl.) Krasser forests of south Patagonia, Attis Beltran et al. (2013) found that the annual diameter increment
of suppressed – intermediate trees was lower than that of codominant trees while dominant trees had higher annual diameter increment than the trees of the other crown classes. Dominant trees are one of the, if not the
most, significant elements of stand structure and stand production. According to Otto et al. (2014) dominant
clonal trees of Eucalyptus grandis x urophylla used
water more efficiently compared to dominated trees in a plantation in Brazil. Moreover, Binkley et al (2014) reported that dominant trees exhibited higher light use efficiency compared to subordinate trees in Eucalyptus
plantations in Brazil.
In reverse to tree density in STB dominant trees
exhibited a higher sum of basal area than codominant trees (p<0.05) while in STA there was no difference
in the sum of basal area between dominant and
codominant trees. In a thinning experiment established
in a Pinus halepensis Miller plantation, Olivar et al. (2014)
mentioned that dominant trees exhibited significantly
higher growth rates than those of suppressed trees. In a Nothofagus Antarctica (Forster f.) forest of south Patagonia, regarding individual trees, mature dominant trees accumulated eight times greater biomass than mature suppressed trees (PERI et al., 2006).
The higher growth rates of dominant against
suppressed trees may be related to more efficient usage of light (GSPALTL et al., 2013) or to a greater period and intensity of cambial activity, which might also lead to the higher growth rates of dominant than intermediate trees (RATHGEBER et al., 2011). On the other hand, in a Grevillea robusta A. Cunn. ex. R. Br. plantation, Thakur et al. (2015) found that codominants exhibited the highest
root: shoot biomass ratio and dominants had the lowest values, while the values of intermediate and suppressed trees followed that of codominants. The same authors reported that this result suggests that codominant intermediate and suppressed trees present persistence strategies in situations of resource limitation.
The absence of statistically significant difference,
in the sum of basal area per plot, among the different crown classes in the low productivity site type (STC)
(Table 4) was the result of low differentiation levels of tree dimensions (OLIVER and LARSON, 1996). This led to a small number (compared to the other crown classes
– see above) of dominant trees and consequently to a
low sum of dominant tree basal area.
The large number of trees that had been
established in low productivity site type (Table 1) in
combination to the low dimension differentiation of trees shows that in low productivity site type, thinnings
had to be started at younger ages from the age of 19 (that was the age of the oldest tree that was cut) in order
to redistribute growing space. Thus, the trees that will be favored by thinnings will become gradually larger and differentiation will proceed resulting in the development of crop trees having large dimensions. Moreover, the
extremely high basal area of the productive site type (STA)
and the fact that without any treatment dominant trees
exhibited a high sum of basal area in both productive and medium productivity site types (STA, STB) implies that
as in low productivity site type, thinnings were necessary at younger tree ages. The result of these thinnings will be the further enlargement of the dimensions, mainly of dominant trees and the attainment of crop trees with
the target size at an earlier stage. Boydak et al. (2006)
analyzing research results from studies in Turkey and
Israel suggest that the first thinning in P. brutia stands
must be done at the age of 10 – 15 years.
The rather high number of dominant as well as the very high number of dominant plus codominant trees in medium productivity and productive sites (STB,
STA) in combination with their high basal area gives an
increased ability of selection in the procedure of tree thinning. These trees will be favored from redistribution of growing space.
In our study, P. brutia formed stands even in areas
having very low depth soils (20 – 25 cm). Probably this
was a result of favorable humidity and temperature conditions created in sites of northern orientation (DAFIS,
1986). However, it seems that trees exploit substrate
depth deeper than soil depth. In many cases roots enter
the geological substrate (personal observation) and thus
the total ground volume from where trees absorb water is larger than that of the soil volume (DAFIS, 1986).
CONCLUSIONS
In P. brutia stands, a few years of age difference
between trees, in post fire establishment, can determine
The tree density in all site types is considered high. Codominant trees were (or will become) the crown class with the most numerous trees in the main canopy. Almost all the basal area was incorporated in dominant and codominant trees. However, dominant trees were
one of the, if not the most, significant elements of stand
structure and stand production regarding basal area, while this was not the case in low productivity site type as a result of delayed dimension differentiation. The results of this study imply that in all site types thinnings were necessary at younger tree ages. On the Thassos island P. brutia forms stands starting from very low depth
soils (20 – 25 cm).
Initiation analysis and analysis of development patterns of young P. brutia stands through the classification of trees into crown classes increased the amount of attained information, since it provided an improved insight in the competition regime and thus can contribute to a better management of these stands.
ACKNOWLEDGMENTS
We thank the Forest Service and the Municipality
of Thasos for their cooperation.
REFERENCES
ADAMOPOULOS, S.; MILIOS, E.; DOGANOS, D.; BISTINAS, I. Ring width, latewood proportion and dry density in stems of Pinus brutia Ten. European Journal of Wood and Wood Products v. 67,p. 471–477, 2009.
ADAMOPOULOS, S.; WIMMER, R.; MILIOS, E. Tracheid length – growth relationships of young Pinus brutia Ten. grown on reforestation sites. Iawa Journal v. 33, n. 1, p. 39–49, 2012.
ADESOYE P.O. Canopy Layers Stratified Volume Equations for Pinus caribaea Stands in South West Nigeria using Linear Mixed Models. South-East European Forestry v.5, n. 2, p. 153-161, 2014.
ATTIS BELTRAN, H.; MARTINEZ PASTUR, G.M.; IVANCIC, H.; LENCINAS, M.V.; CHAUCHARD, L.M. Tree health influences diameter growth along site quality, crown class and age gradients in Nothofagus forests of southern Patagonia. Journal of Forest Science v. 59, n, 8, p. 328-336, 2013.
BINKLEY, D.; STAPE, J.L.; BAUERLE, W.L.; RYAN, M.G.
Explaining growth of individual trees: Light interception and efficiency of light use by Eucalyptus at four sites in
Brazil. Forest Ecology and Management v. 259, n. 9, p. 1684–1694, 2010.
BOYDAK, M.; DIRIK, H.; CALIKOGLU, M. Biology and
Silviculture of Turkish Red Pine (Pinus brutia Ten.).
Ormancıligı Gelistirmeve Orman Yangınlarıile Mucadele Hizmetlerini Destekleme Vakfı Yayını, Lazer Ofset Matbaası, 2006. 253 p.
CASTRUITA-ESPARZA, L.U.; CORREA-DIAZ, A.; GOMEZ-GUERRERO, A.; VILLANUEVA-DIAZ, J.; RAMIREZ-GUZMAN, M.E.; VELAZQUEZ-MARTINEZ, A.; ANGELES-PEREZ, G. Basal area increment series of dominant trees of Pseudotsuga menziesii (Mirb.) Franco show periodicity according to global climate patterns. Revista Chapingo Serie Ciencias Forestales y del Ambiente v. 22, n. 3. p.379-397, 2016.
DAFIS, S. Forest ecology (in Greek). Giahoudi-Giapouli, 1986. 443 p.
DEY, D.C. Regeneration and Recruitment, the Pillars of Sustainability. Forest Science v. 60, n. 5, p. 926–942, 2014.
DIAMANTOPOULOU, M.; MILIOS, E. Modeling total volume of dominant pine trees in reforestations via multivariate analysis and artificial neural network models. Biosystems Engineering v. 105, n. 3, p. 306-315, 2010.
DIAMANTOPOULOU, M.; MILIOS, E.; DOGANOS, D.; BISTINAS, I. Artificial Neural Network modeling for reforestation design through the dominant trees bole – volume estimation. Natural Resource Modeling v. 22, n. 4, p. 511-543, 2009.
GSPALTL, M.; BAUERLE, W.; BINKLEY, D.; STERBA, H. Leaf area and light use efficiency patterns of Norway spruce under different thinning regimes and age classes. Forest Ecology and Management v. 288, p. 49–59, 2013.
HLIKAS, N.; KONTOS K. Management plan for municipal forests of Thassos. Forest Service of Thassos. 1997.
ILLOWSKY, B.; DEAN, S. Collaborative statistics. Rice University, 2008. 699 p.
KAILIDIS, P.; KARANIKOLA, P. Forest fires 1900 – 2000. Giahoudi-Giapouli, 2004. 434 p.
KITIKIDOU, K.; BOUNTIS, D.; MILIOS, E. Site index models for Calabrian pine (Pinus brutia Ten.) in Thasos island, Greece. Ciência Florestal v. 21, n. 1 p. 125-131, 2011.
KITIKIDOU, K.; MILIOS, E.;TSIREKIS, E.; PIPINIS, E.; STAMPOULIDIS, A. Site quality assessment of degraded Quercus frainetto stands in central Greece. iForest v. 8,p. 53-58, 2015.
KITIKIDOU, K.; PETROU P.; MILIOS, E. Dominant height growth and site index curves for Calabrian pine (Pinus brutia Ten.) in central Cyprus. Renewable and Sustainable Energy Reviews v.16, p. 1323– 1329, 2012.
KORAKIS, G. Forest Botany (e-book). Hellenic Academic Libraries Link, Athens. Available in: http://hdl.handle.
DEVELOPMENT ANALYSIS OF POST-FIRE PINUS BRUTIA STANDS? OLIVAR, J.; BOGINO, S.; RATHGEBER, C.; BONNESOEUR,
V.; BRAVO, F. Thinning has a positive effect on growth dynamics and growth-climate relationships in Aleppo pine (Pinus halepensis) trees of different crown classes. Annals of Forest Science v. 71, n. 3, p. 395-404, 2014.
OLIVER, C.D.; LARSON, B.C. Forest stand dynamics. John Wiley & Sons In, 1996. 520 p.
OTTO, M.S.G.; HUBBARD, R.M.; BINGLEY, D.; STAPE, J.L. Dominant clonal Eucalyptus grandis x urophylla trees use water more efficiently. Forest Ecology and Management v. 328 p. 117–121, 2014.
PAPALEXANDRIS, C.; MILIOS, E. Analysis of natural
Fagus sylvatica L. s.l. regeneration in low elevation stands located in the central part of the Evros region in northeastern Greece: Is sprout origin regeneration significant for species maintenance? Plant Biosystems v. 144, n. 4, p .784-792, 2010.
PERI, P.L; GARGAGLIONE, V.; MARTINEZ PASTUR, G. Dynamics of above- and below-ground biomass and nutrient accumulation in an age sequence of Nothofagus antarctica forest of Southern Patagonia. Forest Ecology and Management v. 233, n. 1, p. 85-99, 2006.
PETROU P.; MILIOS, E. Establishment and survival of Pinus brutia Ten. seedlings over the first growing season in abandoned fields in central Cyprus. Plant Biosystems v.
146, p. 522–533, 2012.
PETROU, P.; KITIKIDOU, K.; MILIOS, E.; KOLETTA, J.; MAVROYIAKOUMOS, A. Site index curves for the golden oak species (Quercus alnifolia). Bosque v. 36, n. 3, p. 497-503, 2015.
RATHGEBER, C.B.K.; ROSSI, S.; BONTEMPS, J.D. Cambial activity related to tree size in a mature silver-fir plantation. Annals of Botany v. 108, p. 429–438, 2011.
RENTCH, J.S; MILLER, G.W; GOTTSCHALK, K.W. Crown class dynamics of Oaks, Yellow-Poplar, and Red Maple after commercial thinning in Appalachian hardwoods: 20-year results. Northern Journal of Applied Forestry v. 26, n. 5, p. 156-163, 2009.
SMITH, D.M.; LARSON B.C.; KELTY, M.J.; ASHTON, P.; MARK, S. The practice of silviculture. Applied forest ecology. John Wiley & Sons Inc, 1997. 537 p.
SPANOS, I.; DASKALAKOU, E.; THANOS, C.A. Postfire, natural regeneration of Pinus brutia forests in Thasos island, Greece. Acta Oecologica v. 21, n. 1, p.13-20, 2000.
SPANOS, I.; RADOGLOU, K.M.; RAFTOYANNIS, Y. Site quality effects on post-fire regeneration of Pinus brutia forest on a Greek island. Applied Vegetation Science v. 4, p. 229-236, 2001.
STAMPOULIDIS, A.; MILIOS, E.;KITIKIDOU, K.TSIREKIS, E.; PIPINIS, E.; The regeneration of pure Juniperus excelsa M. Bieb. stands in Prespa national park in Greece. Sumarski List, v. 137, n. 3-4, p. 163-172 2013.
THAKUR, S.; KUMAR, B.M.; KUNHAMU, T.K. Coarse root biomass, carbon, and nutrient stock dynamics of different stem and crown classes of silver oak (Grevillea robusta A. Cunn. ex. R. Br.) plantation in Central Kerala, India. Agroforestry Systems v. 89, p. 869–883, 2015.
THANOS, C.A.; MARCOU, S. Post-fire regeneration in Pinus brutia forest ecosystems of Samos Island (Greece). 6 years after. Acta Oecologica v. 12, p. 633- 642, 1991.
THANOS, C.A.; MARCOU, S.; CHRISTODOULAKIS, D.; YANNITSAROS, A. Early post-fire regeneration in Pinus brutia forest ecosystems of Samos Island (Greece). Acta Oecologica v. 10, p. 79–94, 1989.