12 DISTRIBUTION OF TOTAL HEIGHT, TRANSVERSE AREA AND INDIVIDUALMACHADO, S. do A. et al. VOLUME FOR Araucaria angustifolia (Bert.) O. Kuntze.
Sebastião do Amaral Machado1, Rodrigo Geroni Mendes Nascimento2, Eder Pereira Miguel3, Saulo Jorge Téo3, Alan Lessa Derci Augustynczik2
(received: October 23, 2008; accepted: October 30, 2009)
ABSTRACT: This study aimed to test probability density functions for the distribution of variables total height, transverse area and individual volume, considering three different class intervals. Data were obtained from the measurement of diameter (DBH) and total height and from estimation of the individual volume of 338 pine trees in a fragment of Mixed Ombrophylous Forest with an area of 15.24 ha, which is located in Jardim Botânico campus of UFPR, Curitiba-PR. Ten functions were fitted, including commonly used models for diameter distribution as well as other recently developed models applied to forest science. Selection criteria included Kolmogorov–Smirnov adherence test, standard error of estimate in percentage and adjusted coefficient of determination. Three class intervals were used as obtained by Sturges, Dixon & Kronmal, and Velleman criteria. The Normal function for variable height, and the Weber function for distribution of transverse area and individual volume, provided the best fit, considering the three class intervals adopted. The models fitted better for larger size class intervals as obtained by Sturges rule.
Keywords: Probability functions, adherence test, class intervals, Brazilian pine.
DISTRIBUIÇÃO DA ALTURA TOTAL, DA ÁREA TRANSVERSAL E DO VOLUME INDIVIDUAL DE Araucaria angustifolia (Bert.) O. Kuntze.
RESUMO: Esta pesquisa teve como objetivo testar funções densidade de probabilidade para a distribuição das variáveis altura total, área transversal e volume individual, para três diferentes intervalos de classe. Os dados provieram da medição dos diâmetros (DAP), alturas totais e estimativas dos volumes individuais de 338 pinheiros de um fragmento de Floresta Ombrófila Mista, com 15,24 ha, situado no Campus Jardim Botânico da UFPR, Curitiba-PR. Foram ajustadas dez funções, incluindo modelos comumente utilizados na distribuição diamétrica e outros desenvolvidos recentemente e aplicadas na ciência florestal. Os critérios de seleção foram o teste de aderência de Kolmogorov – Smirnov, erro padrão da estimativa em porcentagem e o coeficiente de determinação ajustado. Foram usados três intervalos de classe determinados pelas regras de Sturges, Dixon & Kronmal e Velleman. A função Normal, para a variável altura, e Weber, para a distribuição da área transversal e volume individual, propiciaram os melhores ajustes, considerando os três intervalos de classe adotados. Os modelos se ajustaram melhor para intervalos de classe de maior tamanho, obtidos pela regra de Sturges.
Palavras-chave: Funções probabilísticas, teste de aderência, intervalos de classe, Pinheiro do Paraná.
1Forest Engineer, Professor of Forest Engineering at UFPR, CNPq 1A Researcher – Forest Engineering Program, Universidade Federal do Paraná – Av. Pref. Lothário Meissner, 632, Jardim Botânico – 80210-170 – Curitiba, PR – [email protected]
2Bachelor’s Degree Candidate in Forest Engineering, CNPq Scholarship Holder – Forest Engineering Program, Universidade Federal do Paraná – Av. Pref. Lothário Meissner, 632, Jardim Botânico – 80210-170 – Curitiba, PR – [email protected], [email protected]
3Forest Engineer, M.Sc. Candidate in Forest Engineering, CAPES Scholarship Holder – Forest Engineering Program, Universidade Federal do Paraná – Av. Pref. Lothário Meissner, 632, Jardim Botânico – 80210-170 – Curitiba, PR – [email protected], [email protected]
1 INTRODUCTION
Within the Mixed Ombrophylous Forest domain, species Araucaria angustifolia has great prominence on account of its singular appearance which stands in contrast to other trees of the same biome and makes it typical and exclusive of the above forest formation (CARVALHO 1994). The abundance and quality of this Brazilian pine tree in past landscapes, combined with its diversified wood use, led to extensive exploration and consequently to rapid
disappearance of large areas of araucaria forest in primary vegetation formations, originating many such fragments— notably as a result of regeneration after the exploration period.
using probability density functions (pdfs) for a variety of forest typologies, particularly plantations.
However, works involving height, transverse area and volume distributions are few and scarce and include the works of Alves Júnior et al. (2007), Gomide (2009), Silva et al. (2003) and Weber (2006). And no research has been conducted on the distribution of these variables for Araucaria angustifolia. This work additionally investigated class intervals providing best adherence test to fit the probability of density functions.
This work is thus mainly intended to test models that will describe the probability distribution of variables total height, transverse area and individual volume for species Araucaria angustifolia, in a fragment of Mixed Ombrophylous Forest, considering three different class intervals.
2 MATERIALS AND METHODS 2.1 Study site
This work was conducted in a fragment of Mixed Ombrophylous Forest known as Capão da Engenharia Florestal and situated in the Jardim Botânico campus of UFPR. The Capão fragment covers an area of 15.24ha— 12.96ha of which consist of Mixed Ombrophylous Forest while 2.28ha consist of sparse brush (capoeira rala) extending along the streamlet which in turn is adjacent to the entire south border of the Capão. Swamps and woody grasses predominate in the capoeira area.
The study site sits between coordinates 25º26’50"– 25º27’33"S and 49º14’16"–49º14’33"W, and the terrain is 890 to 915 meters above sea level. The area has a humid subtropical, mesothermal climate, with mild summers and frequent frosts in the winter, the average temperature being 17°C and the annual precipitation being 1,500 mm, corresponding to a Cfb climate according to Koppen classification.
2.2 Data used
A total of 349 pine trees were counted within the fragment, and measurements were taken of the circumference 1.30 m above the ground (CBH) and total height of all trees. A measuring tape was used for the CBH measurement and a Vertex III hypsometer was used for the height measurement. To estimate the total volume of the araucaria trees, volume equations that had been previously developed for a Brazilian pine inventory by the Paraná Forest Research Foundation-FUPEF (1978) were used, the reason being the close proximity and similar characteristics of that area to the study area.
2.3 Frequency distribution of data
According to Hoaglin et al. (1983), to actually select the number of classes while organizing a data set, the number of observations (N) and some common sense as to how to arrange them should both be taken into account. To determine the number of classes and the ‘ideal’ class interval for the data set, three empirical mathematical rules were used as mentioned by Hoaglin et al. (1983):
1 Sturges formula: nc 1 3.3.Log10N ;
2 Dixon & Kronmal formula: nc Log N 10 .
10 ;
3 Velleman formula: nc 2. N; 4 Class range:
c n
A
h .
Where: nc = Number of classes; N = Number of observations; A = Data range; h = Class range.
As far as the forestry field is concerned, equation 1 above is the most commonly disseminated and one of the best known formulas to establish the number of classes of a data set (MACHADO & FIGUEIREDO FILHO 2006). According to Hoaglin et al. (1983), for samples with a large number of data, N >100, this rule will determine a much reduced number of classes, with larger class intervals and high frequencies, being thus recommended where N < 50.
Hoaglin et al. (1983) argued that Dixon & Kronmal rule is perfectly effective and practical for constructing histograms, being more suitable where N > 100. Velleman rule on the other hand is suggested for average sized samples, 50 < N < 100, generating better histograms for this interval in comparison to the Dixon & Kronmal rule.
2.4 Probability density functions
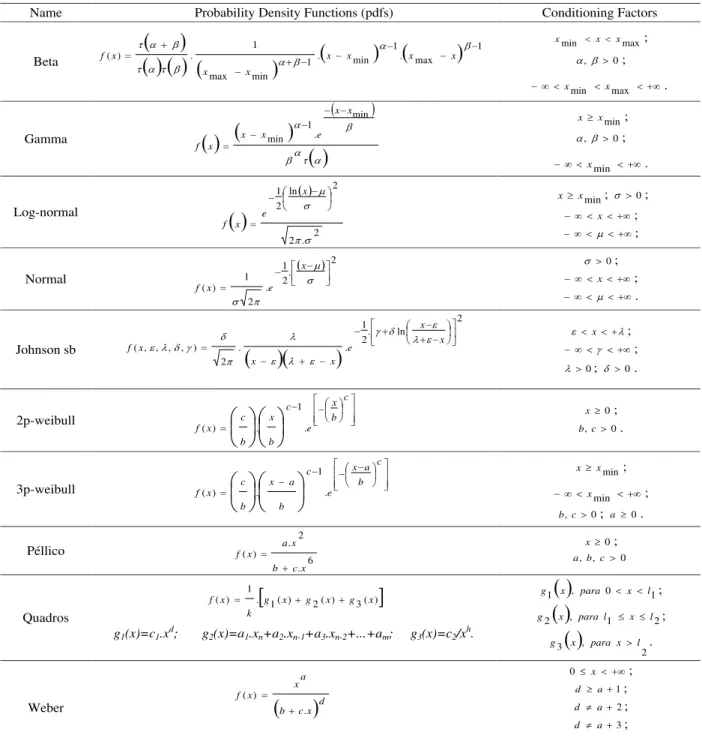
Ten probability density functions were tested to obtain distribution of estimated frequencies for variables total height (h), transverse area (g) and volume (v) (Table 1). Parameters were found for each function, for the different class intervals found by the rules used.
14 MACHADO, S. do A. et al.
Table 1 – Probability density functions and their conditioning factors.
Tabela 1 – Funções densidade de probabilidade testadas e suas condicionantes.
1 max . 1 min . 1 min max 1 . )
( x x x x
x x x
f
Name Probability Density Functions (pdfs) Conditioning Factors
Beta
max
min x x
x ; 0 , ; max min x x . Gamma min x x ; 0 , ; min x .
Log-normal min
x
x ; 0;
x ; ; Normal 0; x ; . Johnson sb x ; ;
0; 0.
2p-weibull x 0;
0 ,c b . 3p-weibull min x x ; min x ; 0 ,c
b ; a 0.
Péllico a,xb,c0; 0
Quadros
g1(x)=c1.xd; g2(x)=a1.xn+a2.xn-1+a3.xn-2+...+am; g3(x)=c2/xh.
1 0 ,
1 x para x l
g ;
2 1 ,
2 x paral x l
g ;
2 ,
3 x para x l
g . Weber x 0 ; 1 a d ; 2 a d ; 3 a d ; 0 , , ,b c d
a . min . 1 min x x e x x x f 2 . 2 2 ln 2 1 x e x f 2 . 2 1 . 2 1 ) ( x e x f 2 ln . 2 1 . . 2 ) , , , , ( x x e x x x f c b x e c b x b c x f . 1 . ) ( c b a x e c b a x b c x f . 1 . ) ( 6 . 2 . ) ( x c b x a x f ) ( 3 ) ( 2 ) ( 1 . 1 )
( g x g x g x
k x f d x c b a x x f . ) (
15 Distribution of total height, transverse area...
Parameters of the 2- and 3P-Weibull, Weber, Péllico and Quadros distributions were estimated by means of an interaction of initial parameter values, with least square fitting using the Levenberg Marquardt algorithm.
With an MS EXCEL 2007 spreadsheet, the parameters and exponents of the two exponential functions
g
1(
x
)
andg
3(
x
)
forming the Quadros pdf were determined by the SOLVER tool using a Simplex algorithm.The Maximum Likelihood method was used to determine the coefficients for the Johnson SB function. To estimate the parameters for Beta, Gamma, Normal and Log-Normal functions, MS EXCEL 2007 spreadsheets were created using the method of moments.
2.5 Best fit selection criteria
In order to compare and select the best model to represent the distribution of the relevant variables, calculations were made to obtain the adjusted coefficient of determination, known as Schlaegel index (R2
aj), the standard error of estimate in percentage (Syx%) and the Kolmogorov–Smirnov adherence test (D = 0.05).
After fitting the tested functions, data were arranged in rank order, score 1 being attributed to the function best fitting each of the statistics, score 2 being attributed to the second best fitting function, and so on. The function aiming at the lowest sum of scores, considering all statistics (Dcalc, Syx% and R2
aj), for all class intervals (Sturges, Dixon & Kronmal and Velleman), was placed 1st in the overall ranking. Ranking was done independently for height, transverse area and volume.
Complementarily, the frequency curves resulting from fitted functions were generated on the frequency histograms for each of the variables being studied for the best rule of class interval determination.
3 RESULTS AND DISCUSSION 3.1 Data dispersion
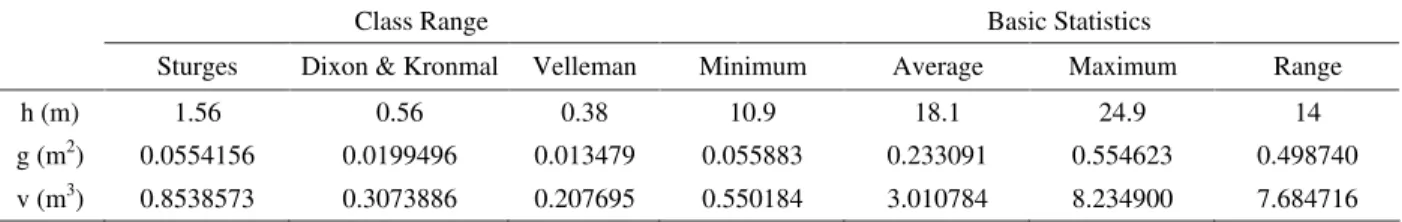
Basic statistics of data dispersion for total height (h), transverse area (g) and individual volume (v), as well as the respective class ranges obtained by the Sturges, Dixon & Kronmal, and Velleman rules, are illustrated in Table 2. Based on these values, it was possible to obtain three different class intervals and frequency distributions for each variable under analysis, and thus enable fitting the probability density functions (pdfs).
The class intervals obtained by each of the rules provided a basis for calculating the respective number of classes by Sturges (9 classes), Dixon & Kronmal (25 classes) and Velleman (37 classes).
According to Sokal & Rohlf (1969), to ensure a smoother distribution with better adherence test fit, it is necessary to condense the relevant data into a reduced number of classes, a fact that has been confirmed in this study. Figure 1 illustrates that the histograms generated by the Dixon & Kronmal and Velleman rules have irregular distribution, producing discrepancies and discontinuities in the observed frequencies.
Those methods of data arrangement originate worse-performing statistics for fit and accuracy, in comparison to histogram fittings generated by the Sturges rule. For this reason, the Sturges rule was selected for the three relevant variables in order to best represent data inventory and model fittings in the form of histograms.
While comparing descriptive models of diameter distribution, Barros et al. (1979) observed that for a larger class interval the tested equations provided greater accuracy in frequency estimations. The findings in this study align with the results of Barros et al. (1979) in that increasing the class interval results in greater function fitting accuracy.
Table 2 – Basic statistics of variables total height (h), transverse area (g), individual volume (v) and class ranges as obtained by Sturges, Dixon & Kronmal and Velleman rules.
Tabela 2 – Estatísticas básicas das variáveis altura total (h), área transversal (g), volume individual (v) e amplitudes de classe obtidas pelas regras de Sturges, Dixon & Kronmal e Velleman.
Class Range Basic Statistics
Sturges Dixon & Kronmal Velleman Minimum Average Maximum Range
h (m) 1.56 0.56 0.38 10.9 18.1 24.9 14
g (m2) 0.0554156 0.0199496 0.013479 0.055883 0.233091 0.554623 0.498740
16 MACHADO, S. do A. et al.
Figure 1 – Histograms of total height (h), transverse area (g) and individual volume (v) as obtained by Dixon & Kronmal and Velleman rules.
Figura 1 – Histogramas para altura total (h), para área transversal (g) e para volume individual (v), obtidos pelas regras de Dixon & Kronmal e Velleman
3.2 Distribution of total height
Statistical values of fit and accuracy and the frequencies estimated by the 10 probability models for distribution of total height, as determined by the three rules, are illustrated in Table 3 in rank order according to the predefined assessment method.
For all models, except for the Péllico function which failed to show good fit for this distribution at the different intervals, the Dcalc value was lower than the Dtab value, for a of 0.05, demonstrating that in all models and at the different class intervals the Kolmogorov–Smirnov test was positive in relation to adherence test.
Table 3 shows that models behaved differently in the estimation of frequency distributions. Considering the three class intervals being used, the best function for the frequency distribution of total height was the Normal
function, followed by 3P-Weibull and Johnson SB at 0.55 of minimum height found.
However, considering the class interval generated by the Sturges rule alone, the best ranking function was the Johnson SB function, followed by Quadros, 3P-Weibull, Normal, Weber, Beta, Log-Normal, 2P-Weibull and Gamma functions. It should be noted that ranking was based on Dcal, Syx% and R2
Table 3 – Statistical values of fit and accuracy for each function tested, for three different data arrangements.
Tabela 3 – Valores das estatísticas de ajuste e precisão, para as funções testadas para os três diferentes arranjos de dados.
Rules and statistics used
Sturges Dixon & Kronmal Velleman
General
ranking pdfs
Dcalc Syx% R2aj Dcalc Syx% R2aj Dcalc Syx% R2aj
1st Normal 0.0137 5.52 0.9925 0.0149 25.73 0.8880 0.0167 38.85 0.4355 2nd 3P-Weibull 0.0134 5.18 0.9934 0.0190 26.47 0.8815 0.0160 39.91 0.4043 3rd SB 0.55 0.0111 4.90 0.9933 0.0169 27.20 0.8749 0.0190 41.05 0.3697 4th Weber 0.0228 5.62 0.9922 0.0262 27.29 0.8741 0.0279 40.84 0.3761 5th Log-Normal 0.0293 8.60 0.9886 0.0383 28.49 0.8627 0.0387 41.06 0.3695 6th Quadros 0.0173 4.50 0.9950 0.0260 29.81 0.8497 0.0265 45.17 0.2368 7th 2P-Weibull 0.0336 7.83 0.9848 0.0431 27.82 0.8692 0.0338 41.20 0.3651 8th Beta 0.0227 8.28 0.9830 0.0297 28.73 0.8604 0.0324 42.49 0.3246 9th Gamma 0.0501 13.85 0.9530 0.0584 33.27 0.8051 0.0565 46.03 0.2073 Legend: Dtab = 0.0734, where = 0.05.
From Table 3 it can be seen that the statistics of fitted functions are much better for the Sturges rule, followed by Dixon & Kronmal and Velleman rules. This fact clearly indicates that the class interval had a marked effect on function fitting. In comparing Figure 1 histograms to those in Figure 2, 3 and 4, it was noted that the smaller the class interval the more irregular the frequencies by class.
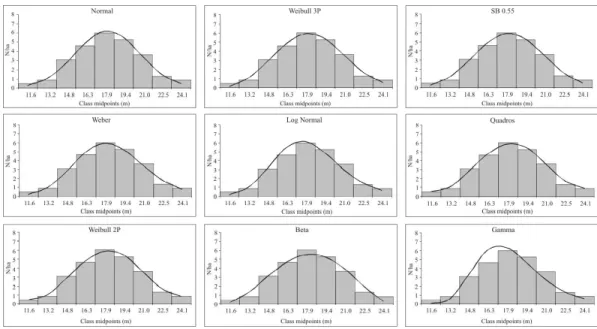
From Figure 2 it is possible to observe how function fit describe the observations for the frequency distribution, according to Sturges rule, for the totality of data. Considering the frequency distribution of total height for larger class interval, as obtained by the Sturges rule, the Johnson SB pdf proved superior to the others both in fit and accuracy values and in the overlap of frequency distribution curves fitted to the observations (Figure 2). The figure illustrates that the frequency distribution curves conformed well to the frequencies histogram by the Sturges rule, except for the Gamma pdf.
3.3 Distribution of transverse area
Table 4 presents statistics of 10 tested probability density functions for the frequency distribution of transverse area with class intervals obtained by Sturges, Dixon & Kronmal and Velleman rules.
As can be noted from Table 4, all probability functions fitted to the observed frequencies, except for the Normal pdf which failed to show adherence by the
Kolmogorov–Smirnov test, with a Dcalc value higher than the Dtab value at all class intervals.
The Weber and Péllico models provided the best fit, showing good performance for asymmetric distributions when considering all three rules. Considering model fit by the Sturges rule alone, it was noted that the best performing function is Quadros function, followed by 3P-Weibull and Weber. Still on transverse area, it was also noted that the smaller the class interval, the worse the pdf statistics.
Bartoszek et al. (2004), while evaluating diameter distribution for Mimosa escabrella trees at different ages, sites and densities, observed that for a positively skewed distribution in plots of site I at age 3.9 years, the Johnson SB function proved more efficient and flexible, being ideal for virtually all site, age and density combinations.
The above finding of Bartoszeck et al. (2004) for diameter distribution among native Mimosa escabrella crops was not observed for distribution of transverse area among araucaria in the fragment studied here. As has been observed on analysis of Figure 1, the Sturges rule was used for graphic representation of the data set. Figure 3 illustrates frequency distributions as estimated by various functions fitted to the observed frequency histograms.
18 MACHADO, S. do A. et al.
Figure 3 – Behavior of distribution curves fitted to the frequency histogram using the Sturges rule for variable transverse area.
Figura 3 – Comportamento das curvas de distribuição ajustadas sobre o histograma de frequência observada empregando-se a regra de Sturges para a variável área transversal.
Figure 2 – Behavior of frequency distribution curves fitted to the frequency histograms using the Sturges rule.
Figure 4 – Fit curves of 10 probability models tested on the frequencies distribution observed for variable individual volume.
Figura 4 – Curvas de ajuste dos 10 modelos probabilísticos testados sobre a distribuição de frequências observadas para a variável volume individual.
Table 4 – Statistical values of fit and accuracy for functions tested at different class intervals.
Tabela 4 – Valores das estatísticas de ajuste e precisão para as funções testadas nos diferentes intervalos de classes adotados.
Rules and statistics used
Sturges Dixon & Kronmal Velleman
General
ranking pdfs
Dcalc Syx% R2aj Dcalc Syx% R2aj Dcalc Syx% R2aj
20 MACHADO, S. do A. et al.
Table 5 – Statistics of the tested functions for the three rules used, with overall ranking.
Tabela 5 – Estatísticas das funções testadas para as três regras utilizadas, bem como o respectivo ranking geral.
Rules and statistics used
Sturges Dixon & Kronmal Velleman
General
ranking pdfs
Dcalc Syx% R2aj Dcalc Syx% R2aj Dcalc Syx% R2aj 1st Weber 0.0064 3.41 0.9975 0.0203 24.71 0.9331 0.0240 44.26 0.6724 2nd 3P-Weibull 0.0314 5.02 0.9946 0.0330 25.97 0.9261 0.0303 44.79 0.6644 3rd 2P-Weibull 0.0313 7.45 0.9882 0.0399 26.33 0.9241 0.0367 44.52 0.6685 4th Gamma 0.0255 7.96 0.9865 0.0303 27.06 0.9198 0.0283 45.14 0.6593 5th Quadros 0.0092 3.07 0.9980 0.0221 27.46 0.9174 0.0320 49.12 0.5964 6th Péllico 0.0353 11.02 0.9742 0.0537 25.19 0.9305 0.0515 44.04 0.6756 7th Log-Normal 0.0238 9.56 0.9806 0.0367 29.04 0.9076 0.0408 46.99 0.6307 8th Beta 0.0306 9.94 0.9790 0.0474 31.03 0.8945 0.0478 49.07 0.5973 9th SB 0.55 0.0386 9.91 0.9792 0.0607 32.97 0.8809 0.0619 51.61 0.5546 10th Normal 0.1039 17.72 0.9333 0.1041 37.01 0.8500 0.1143 54.91 0.4957 Legend: Dtab = 0.0734, where = 0.05.
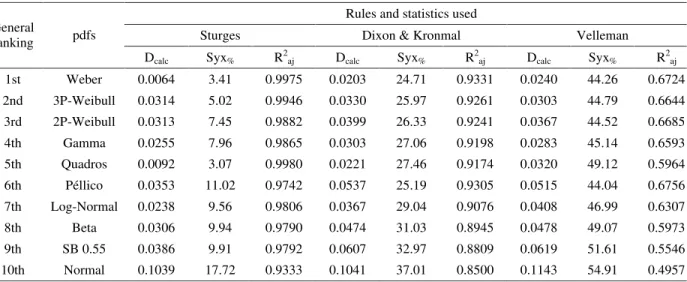
3.4 Distribution of individual volume
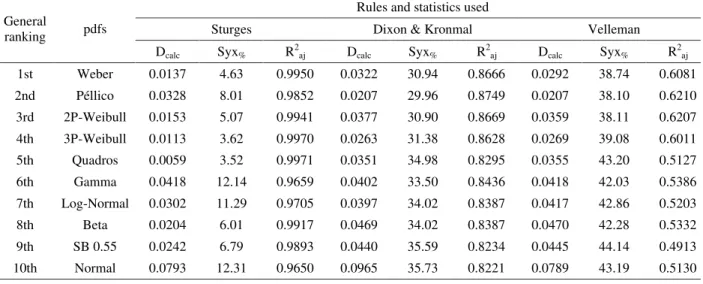
Table 5 presents statistics of adherence test, fit and accuracy, and ranks each of the tested functions, at different frequency distributions, for variable individual volume, according to the three rules used.
According to the Kolmogorov–Smirnov adherence test, it was noted that, except for the Normal distribution, all models fitted to the frequencies histogram generated by the Sturges rule. The Normal pdf failed to show adherence, with a Dcalc value of 0.1039 and a mean error of estimate of N/ha of 17.72% in the distribution generated by the Sturges rule (Table 5).
The Quadros and Weber models provided the best fits by the Kolmogorov–Smirnov test using the Sturges rule, both values being rather low in comparison to the other models (Table 5). The 3- and 2P-Weibull functions had satisfactory results, appearing in 2nd and 3rd positions in Table 5.
From Figure 4 it is possible to observe the behavior of estimated frequency distribution curves for the 10 pdfs fitted on the histogram, generated by the Sturges rule, for variable volume.
The Weibull function presented excellent adherence of diameter frequency data per hectare in tropical forest, according to the work of Barros et al. (1979). The 2P- Weibull function presented excellent fit statistics to estimate diameter distributions for clones of Populus deltoids, according to the work of Arce (2004). These results from
other studies agree with the findings in this study in that the Weibull function also provided good results here.
Figure 4 shows that the Quadros, Weber, and 2- and 3P-Weibull models generated graphs where the frequency distribution curves estimated for each function behaved very similarly to the data arrangement obtained by the Sturges rule, showing great affinity with the histogram.
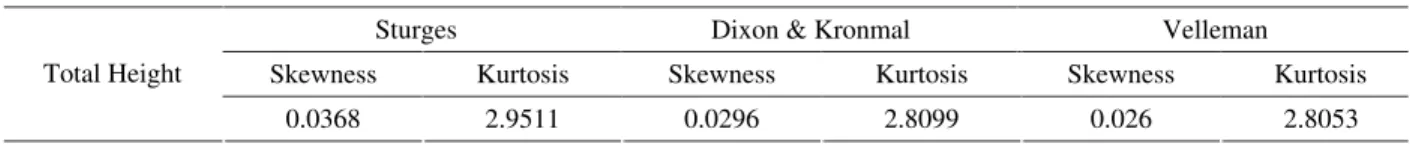
3.5 Skewness and kurtosis of the distributions
From Figure 2 it can be seen that the histograms generated by the three rules are close to a symmetrical distribution with normal kurtosis. Table 6 values indicate that the frequency distribution of variable total height is very close to a normal distribution with zero skewness, with a value very close to 3 for the moment of kurtosis—which defines a normal distribution—, and a value very close to 0 for skewness— which defines how symmetrical the distribution is.
Visualizing the histograms clearly shows that the distributions of transverse area (Figure 3) and individual volume (Figure 4) are positively skewed. The mean values of their moment coefficients of skewness are 0.61698 and 0.83854 respectively.
Table 6 – Skewness and kurtosis for the distribution of total height, according to the different distribution rules.
Tabela 6 – Assimetria e curtose para a distribuição da variável altura total analisadas nas diferentes regras de distribuições utilizadas.
Sturges Dixon & Kronmal Velleman
Skewness Kurtosis Skewness Kurtosis Skewness Kurtosis
Total Height
0.0368 2.9511 0.0296 2.8099 0.026 2.8053
4 CONCLUSIONS
The Sturges rule provided more accurate fits. Overall, increasing the number of classes and consequently decreasing the class interval led to reduced accuracy in the estimation of the number of trees per hectare, despite little affecting the Kolmogorov–Smirnov test values;
Considering the Sturges rule alone, the probability density functions providing the best fit for total height were the Johnson SB at 0.55 of minimum height and the 3P-Weibull functions; while for transverse area the Quadros and 3P-Weibull functions provided the best fit; and for individual volume the Quadros and Weber functions provided the best fit, followed by the 3P-Weibull function; Analysis of the moment coefficients of skewness showed that the distribution of total height was very close to the Normal, while for variables transverse area and volume it was noted that the curves are positively skewed in all three class intervals.
5 BIBLIOGRAPHICAL REFERENCES ALVES JUNIOR, F. T.; BRANDÃO, C. F. L. e S.; ROCHA, K. D. da; SILVA, J. T. da; MARANGON, L. C.; FERREIRA, R. L. C. Estrutura diamétrica e hipsométrica do componente arbóreo de um fragmento de mata atlântica, Recife-PE. Cerne, Lavras, v. 13, n. 1, p. 83-95, jan./mar. 2007.
ARCE, J. E. Modelagem da estrutura de florestas clonais de Populus deltoides March através de distribuições diamétricas probabilísticas.
Ciência Florestal, Santa Maria, v. 14, n. 1, p. 149-164, 2004.
BARROS, P. L. C. de; MACHADO, S. do A.; BURGER, D.; SIQUEIRA, J. D. P. Comparação de modelos descritivos da distribuição diamétrica em uma floresta tropical. Floresta, Curitiba, v. 10, n. 2, p. 19-32, 1979.
BARTOSZEK, A. C. P. S.; MACHADO, S. do A.; FIGUEIREDO FILHO, A.; OLIVEIRA, E. B. A distribuição diamétrica para bracatingais em diferentes idades, sítios e
densidades na região metropolitana de Curitiba. Floresta, Curitiba, v. 34, n. 3, p. 305-323, 2004.
CARVALHO, P. E. R. Espécies florestais brasileiras: recomendações silviculturais, potencialidades de uso da madeira. Colombo: Embrapa-SPI, 1994. 78 p.
FUNDAÇÃO DE PESQUISAS FLORESTAIS DO PARANÁ. Inventário florestal do pinheiro no sul do Brasil. Curitiba, 1978. 327 p.
GOMIDE, L. R. Análise das estruturas diamétricas e hipsométricas de fragmentos florestais localizados na bacia do rio São Francisco, em Minas Gerais. Floresta, Curitiba, v. 39, n. 2, 2009.
HOAGLIN, D. C.; MOSTELLER, F.; TUKEY, J. W. Understanding robust and exploratory data analysis. New York: J. Wiley, 1983. 447 p.
MACHADO, S. do A.; FIGUEIREDO FILHO, A. Dendrometria. 2. ed. Guarapuava: Unicentro, 2006. 316 p.
MARQUES, J. M. Estatística: cursos de engenharia. Curitiba: UFPR, 2003. 191 p. Apostila.
SILVA, E. Q. da; PÉLLICO NETTO, S.; MACHADO, S. do A.; SANQUETTA, C. R. Função densidade de probabilidade aplicável à ciência florestal. Floresta, Curitiba, v. 33, n. 3, p. 285-294, set./dez. 2003.
SOKAL, R. R.; ROHLF, F. J. Biometry: the principles and practice of statistics in biological research. San Francisco: W. H. Freeman, 1969. 776 p.