Methodological Approaches in
Computational Finance
Jo˜ao Zambujal-Oliveira (Editor) University of Madeira, Portugal
Volume nr. 2018/1
Operations Management and Research and Decision Sciences Book Series
Published in Portugal by
Department of Management Science and Economics Campus Universit´ario da Penteada
9020-105 Funchal - Portugal Tel: (+351) 291 705 000 Email: [email protected] Web site: http://www.uma.pt
Copyright c2018 by University of Madeira. All rights reserved. No part of this publication may be reproduced without written permission from the editor. Product or company names used in this set are for identification purposes only. Inclusion of the names of the products or companies does not indicate a claim of ownership by University of Madeira of the trademark or registered trademark.
DigitUMa Cataloging-in-Publication Data
For electronic access to this publication, please access: https://digituma.uma.pt/.
Methodological Approaches in Computational Finance / Jo˜ao Zambujal-Oliveira, editor
Includes bibliographical references and index.
Summary: “This publication presents methodologies and practical tools that indicate aca-demic paths of contribution to the global knowledge through quantitative finance practice by showing different views of approach financial issues”– Provided by editor.
ISBN 978-989-8805-40-9 (ebook) 1. Financial Modelling and Spreadsheet Essentials. 2. Mea-suring risk. 3. Portfolio optimization. 4. Risk analysis. 5. Option valuation 6.Real options valuation with binomial trees 6. Black-Scholes formula and option valuation I. Zambujal-Oliveira, Jo˜ao.
This book is published in the DGE book series Operations Management and Research and Decision Sciences (OMRDS)
Contents
Enterprise Risk Management Analysis 1
Teles, Anabela & Melim, Sara
Perfil de Risco da Gera¸c˜ao Millennium 24
Martins, Andr´e
The Capital Structure and its Impact on Firm Value of JSE Securities
Ex-change Listed Companies 43
Fernandes, Catarina & Dias, Catarina
Risk Analysis of Project Time and Cost Through Monte Carlo Method 55
Pereira, David & Abreu, V´ıctor
An´alise de Gest˜ao de Risco Empresarial - Caso de Estudo de uma Empresa
Petroqu´ımica no Qatar 70
Freitas, Jos´e
Critical Review on the Graduation Thesis by Stefan Thor´en: “A Monte Carlo
for Financial Problems” 89
Gon¸calves, Leonardo
Survey on Financial Risk Management: Evidence on Derivatives Usage by
Norwegian Non-financial Firms 105
ENTREPRISE RISK MANAGEMENT ANALYSIS
Anabela Teles – [email protected] Sara Melim – [email protected] Computacional Finance – João Zambujal-Oliveira
Abstract
This article is based on the master's thesis " Enterprise Risk Management Analysis With Suggestions For Improvements For The Selected Company "by Alja Ferkolj, which addresses the issue of the inherent risks in multinational companies. Its objective is to introduce the concept of ERM (Entreprise Risk Man-agement), as well as raising the risk management to a top management team, enabling companies to gain competitive advantage. The author of the thesis in study was nominated as a risk consultant of a Slovene subsidiary from a multinational company dedicated to the commercialization of non - alcoholic beverages. To this end, it started by doing a bibliographical analysis relevant to the subject in question and later dedi-cated herself to the implementation of the ERM process in the Slovene branch. Evaluated the company's performance and compared it to the initial goals. Based on her study, she proposes suggestions to improve the selected company.
Key words: Risk. Multinationals. Enterprise Risk Management. Top Management.
Introduction
Over time multinational companies due to the globalization process have been extending their borders regarding, more precisely, the areas of production, communication, technology and knowledge. However, along with this internacional-ization process we have the advancement of technol-ogy and the increasing financial sophistication in which multinationals are more susceptible to risks associated with the complexity and size of business relationships.
Organizations recognized the importance of managing risks and their interactions, as well as rec-ognizing the shareholders' desire for stable and pre-dictable earnings. Enterprise Risk Management (ERM) argues that a comprehensive view of risk and its management means that different risks within an organization should not be managed separately. In-stead of focusing only on financial forms of risk this model seeks to address all events that could have a negative impact in an organization's perfor-mance. The various risks should be dealt in a holis-tic way and their correlation should be examined.
The purpose of this master thesis is to en-courage managers to use an integrated approach to risk management and raise it to a top manage-ment team because according to the author, compa-nies should not analyze each risk separately, but the correlation of the various risks. To do so, wants
to encourage the top management team of the se-lected firm to actively participate in the identifica-tion and risk assessment. In addiidentifica-tion, the objective of the thesis in study is to introduce the concept of Entreprise Risk Management for all who are in-terested in this area.
The article is structured as follows:
1. Introduction of the problem and the purpose of the thesis under study.
2. More common definitions around the
area of risk and the main risk categories that multinancional companies face facing and the introduction of the Enterprise Risk Manage-ment concept;
3. Presentation of the multinational
company selected for the study;
4. Implementation of the ERM Process
and its performance in the Slovene subsidiary of the selected company;
5. Presentation of the results of the
im-plementation of the ERM process in the Slo-vene subsidiary;
6. Analysis of the improvements of the
Literature review
Since risk management is constant develop-ment and it is an essential tool for a good manager, there are several definitions of risk, however, there is a common characteristic: risk deals with uncer-tainty.
In finance, a measure of risk is the likelihood of an investment's actual return diverging from its expected value. The most usual statistical measure is the standard deviation, this is the square root of the variance calculated according to the following formula (Clark & Mairos, 1996, p.35):
𝜎 = (𝑅𝑗 − 𝐸(𝑅)) . 𝑝
Rj is possible result j; E (R) denotes the ex-pected return; Pj is the probability of a
possi-ble outcome j
Multinational companies operate in different countries and with different political, financial and economic interests, which, despite being a great op-portunity, also carries some risks.
By opening branches in several countries, multinationals transfer their main resources, such as capital and knowledge. Although they have control over their subsidiaries, this control is not abso-lute. In fact, the subsidiaries have some autonomy at their disposal to manage their activities. Many important decisions like the launch of a new product, the choices about prices or technologies, and the lev-els of employment are usually made by the subsidi-aries (Hilmi, 2007).
The three major risk categories that multina-tional companies face are: Country specific risk, Company specific risk and Overall / systematic risk. The country-specific risk refers to the volatil-ity of returns from international business transac-tions caused by events associated with a specific country, as opposed to events associated with eco-nomic or financial agents. (Marois & Clark, 1996, p. 44). This type of risk is usually split into four main components: economic, financial, monetary and po-litical risk. The economic, financial and monetary components are market based, while the political risk is broader and it refers to the likelihood that de-cisions unfavorable to the company's interests will be taken at the political level. All four compo-nents of risk are interactive, which means that eco-nomic, monetary and financial situations will have
consequences in the political climate, and also be-tween each other (Boczko, 2005).
A global company, in addition to being ex-posed to the four categories of risk mentioned above, is exposed to specific risks of its business. The main categories of uncertainties specific to the com-pany are: operation, liability, research and develop-ment (R&D), credit and behavioral uncertainties.
Regarding systematic risk, this all the risk that a multinational company faces when conducting business in different markets. In the international financial literature, the main factor associated with systematic risk reduction in multinationals is the idea that multinational operations are in several countries, which increases the diversity of their cash flows (Shapiro, 1978). As a multinational company is more diversified relative to a similar domestic company, the company's returns will be less corre-lated with the market and its systematic risk may in-crease.
Both the additional risk, exchange risk and political risk can increase the level of systematic risk of the company, this requires that the additional risk faced by the international firm may actually raise the level of systematic risk, if the increase in the addi-tional risk is greater than the decrease in the correla-tion coefficient between returns from different mar-kets.
According to Casualty's definition Actuar-ial Society, 2003, Entreprise Risk Management is the discipline by which an organization in any indus-try assesses, controls, exploits, finances and moni-tors risks from all sources in order to increase the value of the short and long-term of the organiza-tion. The underlying principle of ERM is that every entity exists to deliver value to stakeholders.
Uncertainty presents risks and opportunities, with the potential to absorb or increase value. The risk management in companys allows manage-ment to deal with uncertainty, risk and associated opportunities increasing the ability to create value. Value is maximized when management sets strategy and objectives to achieve an optimal bal-ance between growth targets, the return and the re-lated risks and to do so implements resources effi-ciently to achieve the entity's objectives (Sponsoring Organizations Committee of the Treadway Com-mission, 2004).
Enterprise Risk Management encompasses:
Reduce surprises and operational losses; Identify and manage multiple risks between
companies;
Seize opportunities;
Improve the development of capital;
The ERM emphasizes a comprehensive view of risks and risk management, meaning that different risks within an organization should not be managed separately, the wide variety of risks should be treated globally and the correlation of various risks should be analyzed (Ferkolj, 2010).
Companies that understand their risks better than their competitors are in a prime position to lev-erage risk to a competitive advantage. Greater knowledge of risk provides the ability to deal with risks that intimidate competitors, project adversities better than competitors and manage risks at the low-est cost. (Davenport & Bradley, 2000).
Identifying and prioritize risk, whether pre-dicted or after a claim, has been a standard manage-ment activity. Treating risk by transfer through in-surance or other products has also been a common practice. What has changed was to treat the wide va-riety of risks in a holistic manner and raise risk man-agement to a top manman-agement responsibility (Ferkolj, 2010).
Because there are several different interpre-tations it is important to define what the risk poses to the whole organization at the beginning of ERM implementation. Consistent use of key concepts will save time and effort. At a minimum, an organiza-tion must agree on definiorganiza-tions for terms such as risk, risk assessment, risk management, ERM, signifi-cance, probability, inherent risk, and residual risk (Ferkolj, 2010).
It is important to integrate strategy and hu-man resources into the ERM process. From the per-spective of human resources, the definition of spe-cific goals linked to the success of ERM should be part of an individual's performance management plan, without this, the implementation exercise may fail. Likewise, business strategy should be defined at the beginning of the exercise, along with the or-ganization's mission and vision. The ERM pro-cess will flow ahead of this strategy, and events will be identified that may impact the achievement of strategies and objectives (Schanfield & Helming, 2008).
For a successful implementation of this pro-cess it is crucial that the Corporate Framework direct
the implementation exercise. Everyone in the or-ganization should be responsible for managing some aspect of risk. Basic risk management skills should be practiced and a structure of risk should be applied to the needs of the organization and risk tolerances should be defined by the Framework. Internal audi-tors can help with implementation by learning all about ERM as well as networking with risk profes-sionals. They also need to challenge external audi-tors to get adequate support. Finally, audiaudi-tors should do more to educate their council about ERM to ensure the correct results (Schanfield & Helming, 2008).
Methodology
The first method used is a relevant literature review and theoretical expositions about Enter-prise Risk Management (ERM), as well as the most common barriers that companies face when the ERM process is implemented.
This is followed by a review of ERM imple-mentation in the case of a company which operates in 28 countries, in which the author of the thesis was chosen to be risk consultant, in a subsidiary in Slo-venia, which in 2009 started an improvement project its ERM process in its subsidiaries. To this end, the author was submitted to a training for ERM imple-mentation and later presented the concept to the top management team, with the main objective of in-volving the top management teams in the identifica-tion and risk assessment in the subsidiaries of to im-plement the risk response plans. The author of the thesis was also responsible for guiding relevant op-erational risks together with the progress of the man-agement actions, agreed to the Risk Director. In this company, the ERM process began with identifica-tion, followed by quantitative and qualitative evalu-ation and ending with a response to risk. The se-lected company used software in which the Monte Carlo simulation was integrated, which allowed for the elaboration of risk analyzes.
Application
The selected company started its activity in 2000, as a result of the Hellenic Bottling Com-pany and Coca-Cola Beverages fusion, estabilished in London. This company produces, sells and
dis-tributes non-alchoholic drinks. The two
main shareholders of the company are Kar-Tess Holding SA, a private holding company, and The Coca-Cola Company. The owner of most beverages trademarks is The Coca-Cola Com-pany, which in addition to providing concentrates is also responsible for marketing. In 2009, the com-pany had more than 44,000 employees and net reve-nue was 6,544 million euros, operating in 28 coun-tries. The company headquarters are in Athens, where the main employees and processes are grouped together. Each role has a country-level and group-level structure, thus bringing in close func-tional operations with the customer, allowing the company to achieve substantial scale benefits such as savings in procurement, knowledge sharing and investment planning.
The executive management group is the Op-erating Committee, which defines strategy and di-rection and also ensures effective coordination and decision-making throughout the organiza-tion. Among its functions are:
Develop group strategy;
Approve annual targets for countries and
business functions;
Challenging and approving strategic
busi-ness plans;
Review countries operational performance
and agree on corrective actions;
Review the operational performance of
busi-ness functions and agree to corrective actions;
Spread the best practices of partner
compa-nies and other industries;
The Corporate Finance department is respon-sible for overall risk management, which includes safeguarding the company's assets to minimize the risk of financial losses and developing risk man-agement capabilities to improve decision-making, being both the Risk and Insurance and the Treasury departments that mainly deal with risk.
The implementation of the ERM process be-gan in 2005 by the Risk department, with the main
objective of minimizing the costs of exposure to con-tingencies and give security to the management of identified risks in order to create a stable environ-ment within which the company could develop its operational and strategic objectives. Among the main objectives are the compilation and mainte-nance of an updated risk portfolio detailing the risks to the achievement of the Group's operational and strategic objectives; and the identification, manage-ment and graduation of consistent and replicable risks identified throughout the Group. These objec-tives should be achieved through:
Monthly risk reviews with top management
teams in the respective country, to check the progress of managing identified risk exposure.
Routing of significant operational risks,
along with progress in management actions agreed to the regional directors quarterly.
Twice a year the communication of the
accu-mulated exposure to regional risk to the Oper-ating Committe and Audit Committee.
In 2005, the subsidiary management teams began with annual risk assessments and the trans-mission of risk assessment results with annual busi-ness plans. However, this assessment was insuffi-cient.
To improve the business risk management process, in 2009 all subsidiaries requested a risk con-sultant responsible for the replicable risk manage-ment process. The author of the thesis was the one appointed for Risk Advisor in the slovene subsidi-ary. After being prepared for the implementation of the ERM process, presented the concept to the top management team and ensured that it was active in identifying and evaluating risks and that the risk re-sponse plans were implemented. The author was also responsible for guiding significant operational risks along with the progress of management actions agreed to Risk Director. The ERM process in the company selected consisted of three steps: identifi-cation, evaluation (qualitative and quantitative) and risk response.
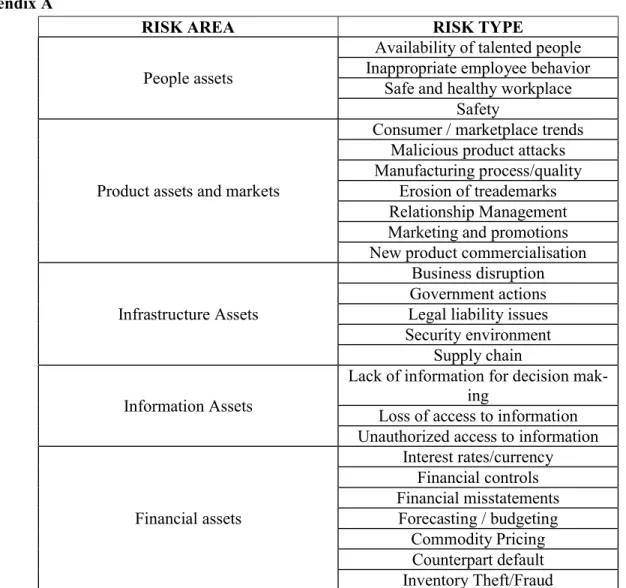
The company itself defined its universe of risks by identifying the ones that had the most im-pact on its business, and all subsidiaries should take these into account at the risk identification stage. The most present risks in subsidiaries are pre-sented in Appendix A.
and identify the risks considered in the universe of risks and the objectives of the subsidiary established by the top management team. Any event that pre-vents the subsidiary from meeting its objectives is considered a risk. Risks are defined primarily through brainstorming, interviewing and analysis of relevant data.
When risks are detected, they are recorded in the Risk Register, which is designed to be a manage-ment documanage-ment to be reviewed and updated regu-larly and that aims to determine all risks that may affect the company. This register also includes the risk model which is filled with quantitative infor-mation. It follows a methodology that is recog-nized as common to all risk management processes, regardless of the sector or the task. After identify-ing and recordidentify-ing the risks, these are evaluated based on the opinions of those who identified them. Qualitative risk assessment involves the de-termination of two major factors: the likelihood that an identified risk will occur and the impact or con-sequences for the business if the risk occurs.
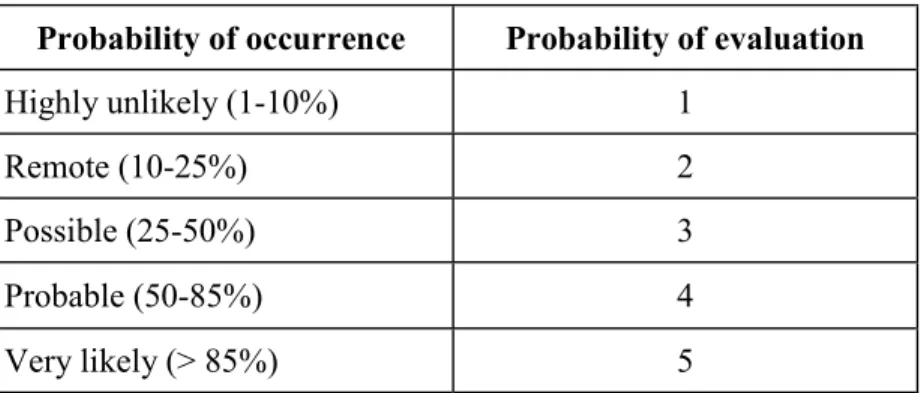
In the selected company, the probability scale (Appendix B), common across the Group, is defined within the current business planning period, so risks are assessed due to the probability of occur-rence within the company's delivery period.
In the subsequent evaluation phase, the two categories with the highest impact should be chosen, among which EBIT; the reputation or perception of the company; health, safety and the environ-ment; management effort and quality; taking into account certain criteria (Appendix C).
The results obtained in the Slovene subsid-iary in March, 2010, are in Appendix D. For each identified risk, the likelihood and impact were eval-uated according to the evaluation criteria described above. After the risks are registered, they are auto-matically classified as follows:
𝑃𝑟𝑜𝑏𝑎𝑏𝑖𝑙𝑖𝑡𝑦 𝑠𝑐𝑜𝑟𝑒 𝑋 (𝐼𝑚𝑝𝑎𝑐𝑡 𝐴 𝑠𝑐𝑜𝑟𝑒 + 𝐼𝑚𝑝𝑎𝑐𝑡 𝐵 𝑠𝑐𝑜𝑟𝑒) = 𝑇𝑜𝑡𝑎𝑙 𝐼𝑚𝑝𝑎𝑐𝑡 The main reason for classifying the risk is for management to focus mostly on those that present a more negative overall impact.
In the Slovene subsidiary of the selected com-pany, the main risks identified were:
1 Systems, Applications & Products - software that enables companies to track interactions with customers and busi-nesses.
Halt of direct sales distribution (one of the
company's major distributors was having li-quidity problems in early 2010, so there was a high risk that the company's products would not be delivered in time).
Slovenia's gross domestic product was lower
than forecast (due to the effects of the global economic crisis resulting in lower consump-tion in 2010).
Increased competition from
the Pivovarna group Laško (PLG), which ac-quired the main competitor.
Plastic deposit (the government took
ad-vantage of a regulation in which the plastic de-posit tax would be included in the consumer price, which would result in an increase in sales prices and could decrease the sales of bever-ages in plastic packaging).
Increase in outstanding debts (due to
eco-nomic situation).
Retention of people due to SAP1 system
im-plementation (In 2010, the company imple-mented the SAP system and throughout 2010 the training sessions were held in Bul-garia. Because many people were temporarily hired and were primarily involved in the SAP project, there was a high risk that they would leave the company before its implementation.)
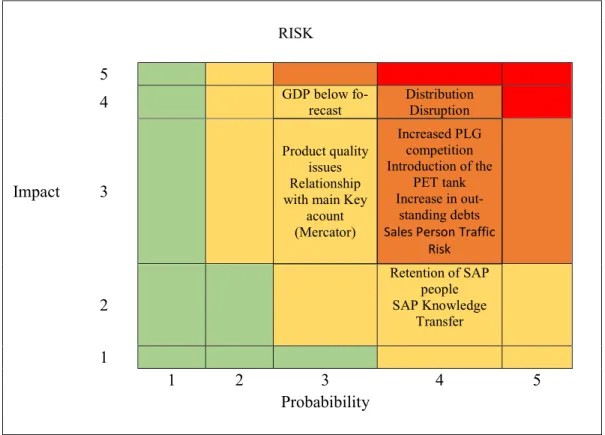
in the critical area of the Top 10 Heat map are re-ported to the Group Risk Director. As can be seen from Appendix E, there was no critical zone at the Slovene subsidiary in March 2010.
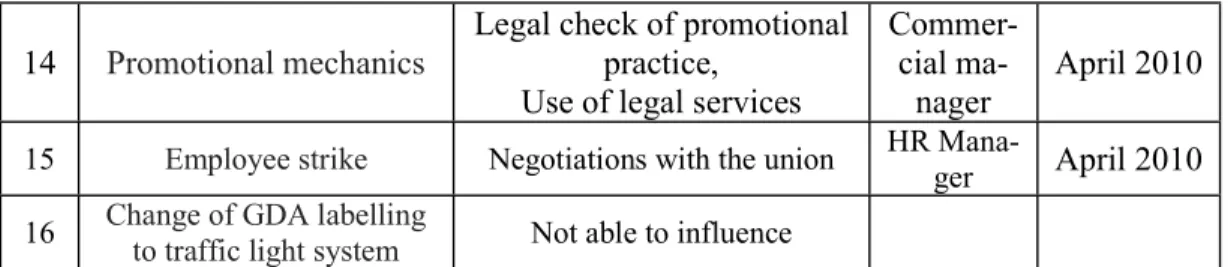
At the last stage, attention should shift to risk re-sponse plans, these can be realized by reducing the likelihood of the risk occurring, or reducing the im-pact of the risk occurring or, finally, reducing the likelihood and impact of risk. Each time a risk is identified, someone should be responsible for cording it in the Risk Register to ensure that sponse plans are completed on time. The risk re-sponse plans resulting from the company under study are presented in Appendix F.
Quantitative risk analysis assigns numeric values to risks, either using empirical data or quan-tifying qualitative assessments. Quantitative risk analysis can be done through a Monte Carlo simula-tion. In this type of simulation, random inputs are represented using possible values through probabil-ity distributions, as this is a much more realistic way of describing uncertainty in the analysis of risk var-iables. There are several probability distributions, namely: Normal, Lognormal, Uniform, Triangular, PERT and Discrete.
During a Monte Carlo simulation, the values are shown at random from distributions of the prob-abilities of the inputs. Each set of samples is called iteration, and the result of that sample is rec-orded. This simulation does this hundreds or thou-sands of times, and the result is a probability distri-bution of possible outcomes. In this way, a Monte Carlo simulation provides a much more comprehen-sive view of what can happen. It does not just tell us just what might happen, but also how likely it is to happen (Palisade, 2010).
A Monte Carlo simulation has several ad-vantages:
Probabilistic outcomes: the results show not only what could happen but how likely it is to happen.
Graphic results: Due to the data generated by
a Monte Carlo simulation, it is easy to create graphs of different results and their probability of occurrence.
Sensitivity Analysis: na Monte Carlo
simu-lation, it's easy to see which inputs have greater effect on the final results.
Scenario analysis: using a Monte Carlo
sim-ulation, analysts can see exactly the inputs that had associated values when certain results occurred.
Correlation of Inputs: In a Monte Carlo
simulation, it is possible to model interdepend-ent relationships between input variables.
The selected company has adopted a bit of quantitative risk analysis. It is simplified to calcu-late the cumulative probability and the cumulative costs of each risk. Also from the probability distri-butions only four distridistri-butions are used in the risk register: normal, PERT, uniform and discrete.
The Slovene subsidiary uses @Risk soft-ware to perform risk analysis using a Monte Carlo situation, which involves two steps: the configura-tion of the risk model and the execuconfigura-tion of the risk simulation.
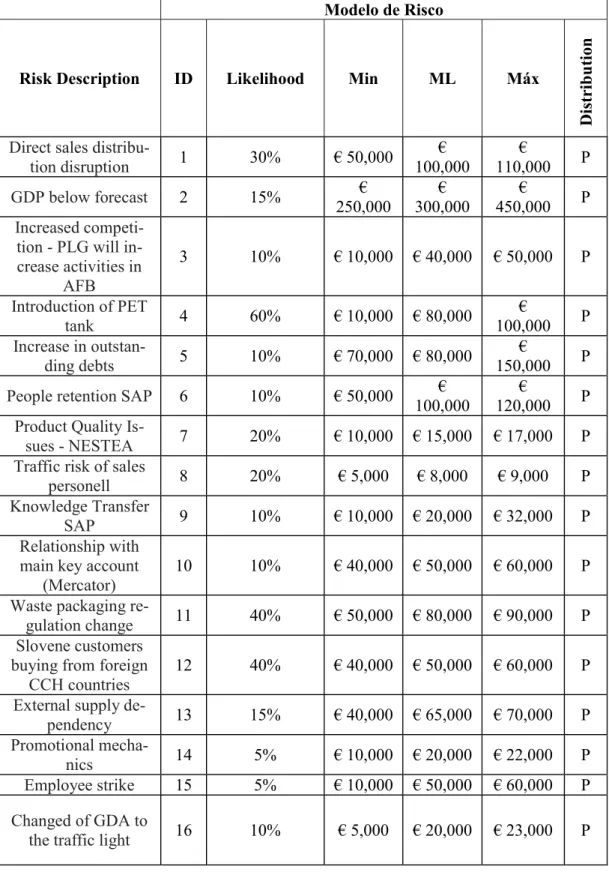
The selected company defines a risk model determined by the probability of risk in percent-age; minimum, maximum costs and, if possible, the most likely to be at risk; and by the probability dis-tribution of the risk. In Appendix G it is possible to observe the risks identified in the Slovene subsidiary company in March 2010, ordered based on their pri-ority which originates the qualitative evaluation.
When defining the risk, the top management team should consider the risk response plans that were identified after the qualitative assess-ment. The risk should be an estimate of the risk that occurs after the response plans are finished and should follow the cost estimate in case the identified risks occur. One of the four probability distributions (PERT, normal, uniform and discrete) must be cho-sen for each risk. As we can see in Appendix G, only the PERT distribution was used. In this type of distribution a minimum, most probable and maxi-mum values are defined. The values around the most likely are more likely to occur.
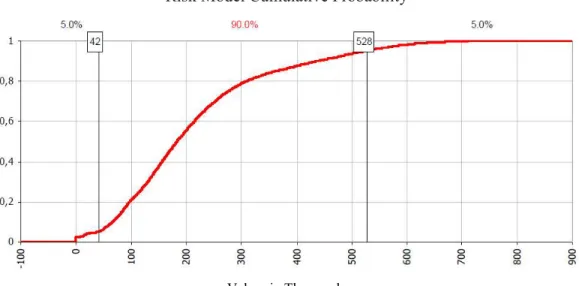
After the risk model is met, the selected com-pany uses @ Risk software, which recalculates the risk model thousands of times. Risk software en-compasses all results on a graph called the cumula-tive probability curve or 'S' curve (Appendix H).
that the risks identified will not have a cumula-tive impact higher than € 528,404. Similarly, P05 tells us that there is only a 5% probability that the risks identified will not have a cumulative impact of more than € 42,003. Based on these percentiles, we can conclude that there is a probability of 90% that the accumulated costs vary between 42,003 € and 528,404 €.
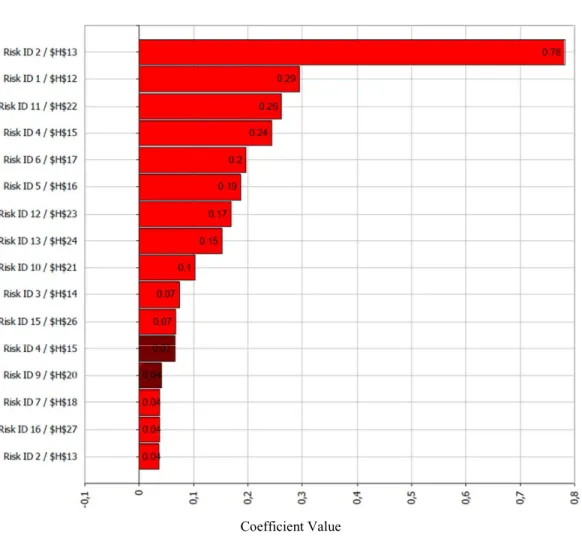
In addition to the Cumulative Probability Curve, an important result of risk simulation is risk sensitivity analysis that tells us which risks have the greatest influence depending on the impact they have on cumulative risk.
It can be seen in Appendix J that the risk 2 (gross domestic product is below the forecast) with the regression coefficient 0.78 had the strongest in-fluence the company, followed by the risk of inter-ruption of the distribution coefficient with regres-sion of 0.29, and the risk of alteration in the regula-tion of packaging, with a regression coefficient of 0.26.
Knowing the main risks, the company can adapt the response plans so that the resources are di-rected mainly to the risks that have the greatest im-pact. Adaptations of the most influential early re-sponse plans generally lead to a reduction in overall exposure to risk. The reassessment of risk simula-tion allows for the assessment of benefits due to the response of the adapted plans, in addition, allows a comparison between the overall risk reduction and the additional costs due to the adaptation of the ini-tial plans of response to the risks.
Selected Company Analysis
In the past, risk reports in the selected com-pany's subsidiaries were fragmented, namely risks originated in different areas of the organization were reported separately to the business commu-nity. The most critical risks the company faced were managed by different departments that had poor communication and cooperation. This ap-proach consisted in leaving senior management in subsidiaries unable to assess the risk environment in a global manner.
To visualize the risks in a holistic way, sev-eral organizational obstacles must be overcome. For a venture initiative to succeed, there must be a leader. The company selected the project for im-provement of the ERM project in subsidiaries was
initiated by the Department of Enterprise Risk in the last quarter of 2009. The main objective was to im-prove the involvement of top management teams in the subsidiaries in the risk assessment.
The author was responsible for the improve-ment of the ERM process in the Slovene subsidiary of the selected company. In the first risk analysis conducted in March 2010, there were no obstacles in involving the top management team in risk assess-ment. In the first ERM workshop in March 2010, the author had introduced major changes in the risk management process, particularly the need for the top management team to consider all sources of risk.
The default risk universe common to all sub-sidiaries of the selected company was very useful for identifying risks at the Slovene subsidiary and al-lowed top management not to focus only on the fi-nancial sources of risk, which was a common prac-tice in the past.
Predefined evaluation criteria helped to as-sess risks more quickly and brought rules, however, the top management team often encountered diffi-culties using pre-defined evaluation criteria. In the qualitative risk assessment, two of the five impact categories were to be chosen, but in the case of cer-tain risks, it was difficult to choose which two cate-gories that had the greatest impact, and as a result, the top management team often linked certain risks to more than two categories. It was also diffi-cult to reach consensus among the different mem-bers on the likelihood of risk.
For each risk, the top management team quickly defined a response plan, one responsible and an expiration date. Managers were already aware of most of the risks identified and the implementation of risk response strategies, as this was already part of their regular activities.
While the top management team was more focused on risk response plans that were elaborated to reduce risks, quantification of these risks contin-ued to be an unexplored area. In addition, the risk model, used for risk quantification in the selected company, was simplified to require only the cumu-lative likelihood and identified risk costs. It is not possible to determine the probability of the different possible outcomes in the model, although the soft-ware @Risk, which the company used, would allow the calculation of risk based on the probability of dif-ferent possible outcomes. In addition, despite the different distributions of probabilities, they always used the PERT distribution.
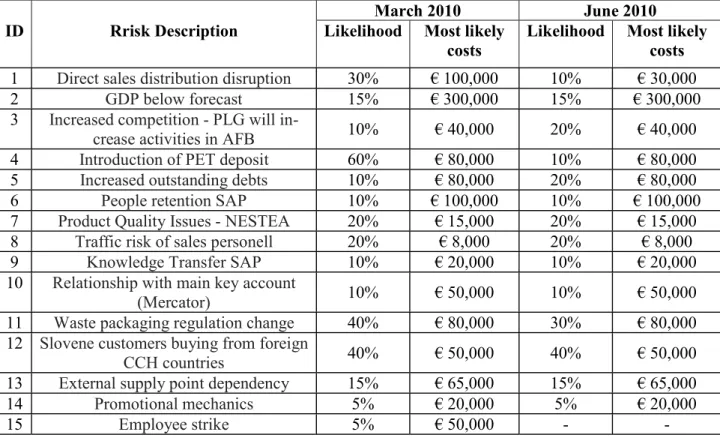
The cooperation of the top management team in the risk assessment decreased when we compared the first and subsequent analyzes. While in the first review, the top management team identified 16 risks, in the subsequent risk analyzes, no additional risks were identified. At the first risk analysis, the team was actively involved in the assessment, but in the subsequent risk reviews it was limited to regulat-ing the initial assessment. In Appendix K, we can analyze the comparisons between the probability and the most likely costs identified according to the risk assessment in March and June.
The top management team can not link the percentiles of the cumulative impact of identified risks, calculated by @ Risk software, with the EBIT performance indicator. One possible reason is that each subsidiary sends the monthly income and ex-penses account for the current year, which is updated monthly according to the market situation and the internal information of different functions within the subsidiary. In this account, the main risks were al-ready considered by the planned adaptation of vol-umes, prices or costs for the following months. For example, the risk that the gross domestic product would be below forecast or that competition would increase was already incorporated in a decrease in expected sales figures. As most of the risks identi-fied are incorporated into the planning of income and expenses and the expected EBIT, it was difficult to establish the relationship between the outputof the risk model and the subsidiary's EBIT.
Because of an effective response plan on the main risk on the interruption of distribution, the cumulative risk exposure measured by P95 de-creased from March to June 2010. However, as of March 2010, no other risk was identified and the
likelihood of the initially identified risks also de-creased. The credibility of the probability distribu-tion is then quesdistribu-tionable, since on the one hand we can deduce that the decrease in the cumulative expo-sure to the risk of the subsidiary is due to the effi-ciency of response plans, but given that the top man-agement team was not sufficiently involved in risk identification, this may have been the true factor for this decline to occur, and thus some important risks may have been neglected.
Conclusion
Because they operate in different markets, multinational companies deal with uncertainty, which can lead to unanticipated change in their re-sults. Effective risk management has therefore be-come an important activity for these companies, as greater awareness of their risks and ability to deal with them better than their competitors could trans-late into a competitive advantage and a less expen-sive activity.
The author of the thesis introduced the con-cept of Enterprise Risk Management (ERM) in the Slovene subsidiary of the chosen multinational company. This process allows the identification and evaluation of the various risks that can affect the per-formance of the organization and requires the in-volvement of the entire top management team. To simplify, the selected company defined the main specific risk areas of its business to serve as a "script" in the risk identification phase. The prede-fined evaluation criteria were developed for qualita-tive risk assessment. These brought rules, however, the top management team had some difficulties in handling them and it was also difficult to find a con-sensus in the risk assessment between different members.
The selected company uses @Risk soft-ware to perform risk analysis using Monte Carlo simulation. This software recalculates the risk model thousands of times and generates all the results on a graph.
Risk response plans were implemented ef-ficiently during the first half of 2010. One of the ma-jor risks (distribution problems) has been exceeded, thereby reducing overall risk exposure. The ERM process has raised the awareness of the top manage-ment team about risks that could affect the perfor-mance of the company's subsidiaries.
development in the selected company. As it was al-ready developing risk response plans, the top man-agement team considered this process to be only an additional and bureaucratic process of activities that they already performed regularly. One of the most important things in this model is to identify the im-pact of risks on the organization's objectives. In the Slovene subsidiary of the selected company, top management found no direct link between the
out-puts of the risk model (cumulative probability
distri-bution) and the main performance indicator of the subsidiary, EBIT, which also contributed to the lack of motivation. As most risks were already embedded in financial planning (particularly in the income and expense account), they felt that the risks were being considered twice. The author recommends that the ERM process should be updated, interlinking to al-low a more coherent relationship.
The software of risk acquired allowed a wide variety of simulations, however, the company did not take advantage of many of the software fea-tures. One of the most important characteristics of the software is to carry out the risk analysis accord-ing to the probabilities defined for the different pos-sible results considering each identified risk. This feature was neglected because the risk model in the selected company only required the accumulated probability of each identified risk. Therefore, the au-thor suggests that it would be advantageous to up-date the risk model.
In conclusion, the author's main suggestions would be for the management team of the Slovene subsidiary to continue with the identification and overall risk assessment. The improvements should focus primarily on the area of evaluation and risk analysis. The risk assessment criteria should be re-viewed and adapted to the needs of the subsidiaries, and to improve the involvement of the top manage-ment teams in the subsidiaries in the risk assessmanage-ment, a better link should be made between the results of the ERM model and the EBIT.
Bibliographic References
1. Boczko, A. (2005). Country risk. Financial
management, February 2005, 25-26.
2. Bussiness Dictionary. Retrived April 10th,
2018 on http://www.businessdiction-ary.com/definition/SAP.html
3. Clark, E. & Marois, B. (1996). Managing risk in international business: Techniques
and applications, (n.p): International
Thom-son Business Press.
4. Committee of Sponsoring Organizations of the Treadway Commission. Enterprise risk
managemenIntegratedframework. Retrieved
August 10th, 2010 on
http://www.coso.org/Publica- tions/ERM/COSO_ERM_ExecutiveSum-mary.pdf
5. Davenport W. Edgar & Bradley L. Michelle. (2000). Enterprise Risk Management: A ConsultativePerspective.
CasualtyActuari-alSociety Retrieved February 10th, 2010 on
http://www.ca-sact.org/pubs/dpp/dpp00/00dpp23.pdf 6. Ferkolj, A. (2010). Entreprise Risk
Manage-ment Analysis With Suggestions For Im-provements For The Selected Company.
Slovenia: University of Ljubljana.
7. Hilmi, N. (2007). Foreign direct investment by Multinational companies and by
Collec-tive investment firms. Retrieved September,
5th, 2010 on http://mibes.teilar.gr/confer-ences/2007/poster/Hilmi-Ketata-Safa.pdf 8. Palisade portal. Rretrieved August 16th,
2010 on http://www.palisade.com/risk 9. Schanfield, A. & Helming, D. (2008). 12 Top
ERM Implementation Challenges. Internal
Appendix A
Table 1 - Risk universe of the selected company Source: Internal sources of the selected company
RISK AREA RISK TYPE
People assets
Availability of talented people Inappropriate employee behavior
Safe and healthy workplace Safety
Product assets and markets
Consumer / marketplace trends Malicious product attacks Manufacturing process/quality
Erosion of treademarks Relationship Management Marketing and promotions New product commercialisation
Infrastructure Assets
Business disruption Government actions Legal liability issues Security environment
Supply chain
Information Assets
Lack of information for decision mak-ing
Loss of access to information Unauthorized access to information
Financial assets
Interest rates/currency Financial controls Financial misstatements
Appendix B
Table 2: Qualitative probability assessment of the identified risks in the selected company Source: Internal sources of the selected company, 2010
Probability of occurrence Probability of evaluation
Highly unlikely (1-10%) 1
Remote (10-25%) 2
Possible (25-50%) 3
Probable (50-85%) 4
Appendix C
Risk impact area Description of impact Impact asses-sment
EBIT
<3% of EBIT 1
Aprox . 3% of EBIT 2
3-7% of EBIT 3
7-10% of EBIT 4
> 10% of EBIT 5
Company Reputa-tion
Inisignificant damage to reputation Unlikely to attract regional mediaattention ;
No brand expected impact 1
Minor damage to reputation
Unlikely to attract regional mediaattention
No brand impact expcted 2
Moderate damage to reputation Regional mediaattention lasting 1-2 weeks
Brand recovery expected in 1-2 weeks 3
Severe damage to reputation Adverse national media coverage
Brand recovery expected in 2-8 weeks 4
Critical damage to reputation Adverse national media coverage
Brand recovery expected in 8-24 weeks 5
Health, safety and environment
Internally reportable incident managed locally
Leading to < 3 days absence 1
Internally reportable incident managed locally
leading to 3-5 days of absence 2
Internally reportable incident managed
Leading 5-10 days absence 3
Incident managed locally leading to major
in-jury/loss of limbo r sight 4
Fatality 5
Management effort
No management involvement is required 1
Management input required to limit impact 2
Dedicated management effort required 3
External management report required for less
than 28 weeks 4
External management report for more than 28
weeks 5
Quality
Isolated single event of quality standards 1
Multiple complaints in breach of equality
standards 2
Multiple incident of breach of local requlatory
quality standards 3
Silent recall of product line 4
Public recall product line
Appendix D
Impact (1-5)
ID Risk Description Consequence
Ll ik el ih ood (1-5) EB IT R ep ut at ion /P er ce p-tion H , S & E M an age m en t E ffo rt Q ual ity Pi or ity
1 Direct sales distribution disruption Goods not delive-red 4 4 0 0 3 0 28
2 GDP below forecast Lower consump-tion 3 5 0 0 3 0 24
3 Increased competition - PLG will increase ac-tivities in AFB
Decrease in
mar-ket share 4 3 0 0 3 0 24
4 Introduction of PET de-posit Lower sales 4 3 0 0 3 0 24
5 Increase outstanding debts Loss 4 4 0 0 2 0 24
6 People retention SAP Business disrup-tion 3 4 0 0 4 0 24
7 Product Quality Issues - NESTEA Unsastified con-sumers 3 0 0 0 3 4 21
8 Traffic risk of sales per-sonell Absenteeism, bad company
reputa-tion 4 0 0 3 2 0 20
9 Knowledge Transfer SAP trained properly 4 1 0 Employees not 0 4 0 20
10 Relationship with main Key account (Mercator) Decrease in sales 3 3 0 0 3 0 18
11 Waste packaging regu-lation change Increase of packa-ging fee 3 4 0 0 2 0 18
12 Slovene customers buy-ing from foreign CCH
countries Lower sales 3 3 0 0 3 0 18
13 External supply depen-dency Lost sales 2 2 0 0 3 0 10
14 Promotional mechanics Penalty or recall 3 1 0 0 2 0 9
15 Employee strike Work disruption 1 0 3 0 3 0 6
16 Changed labeling from GDA to traffic light
system Sales decrease 1 3 3 0 0 0 6
Appendix E
RISK
5
4 GDP below fo-recast Distribution Disruption
Impact 3
Product quality issues Relationship with main Key
acount (Mercator)
Increased PLG competition Introduction of the
PET tank Increase in
out-standing debts Sales Person Traffic
Risk
2
Retention of SAP people SAP Knowledge
Transfer
1
1 2 3 4 5
Probabibility
Appendix F
ID Risk Description Risk Response Plans
R isk O w ne r R es pon se P lan to C com pl et ed by
1 Direct times distribution disruption Identify alternative service providers chain ma-Value
nager April 2010
2 GDP below forecast Marketing mix adjustment Commer-cial
ma-nager Ongoing
3 PLG will increase in al-Increased competition -
cohol free beverages Marketing mix adjustment
Commer-cial
ma-nager Ongoing
4 Introduction of PET de-posit Negotiations with gover-nment Affairs Public
Manager June 2010
5 Increased in outstanding debts Update of accounts receiva-ble policy, weekly monitor-ing
Financial
manager April 2010
6 People retention SAP Following SAP recruitment policy Affairs Public
Manager April 2010
7 Product Quality Issues still drinks - NESTEA Increased visual incoming of goods inspections on critical SKUs
Supply chain
ma-nager April 2010
8 Traffic risk of sales staff Training on safety driving chain ma-Supply
nager June 2010
9 Knowledge Transfer SAP SAP implementation pro-Close monitoring of the cess
Public Affairs
Manager Ongoing
10 Relationship to main key account (Mercator)
Extensive monitoring of Mercator’s performance -Improved the relationship
with other key accounts
Commer-cial
ma-nager April 2010
11 Waste packaging regula-tion Negotiate with the gover-nment Affairs Public
Manager Ongoing
12 in CCH foreign countries Slovene customers shop Trade policy review Commer-cial
ma-nager June 2010
13 External supply depen-dency Prepare appropriate contin-gency plans chain ma-Value
14 Promotional mechanics Legal check of promotional practice, Use of legal services
Commer-cial
ma-nager April 2010
15 Employee strike Negotiations with the union HR Mana-ger April 2010
16 Change of GDA labelling to traffic light system Not able to influence
Appendix G
Modelo de Risco
Risk Description ID Likelihood Min ML Máx
D
ist
ri
bu
tion
Direct sales
distribu-tion disrupdistribu-tion 1 30% € 50,000 100,000 € 110,000 € P
GDP below forecast 2 15% 250,000 € 300,000 € 450,000 € P
Increased competi-tion - PLG will in-crease activities in
AFB
3 10% € 10,000 € 40,000 € 50,000 P
Introduction of PET
tank 4 60% € 10,000 € 80,000 100,000 € P
Increase in
outstan-ding debts 5 10% € 70,000 € 80,000 150,000 € P
People retention SAP 6 10% € 50,000 100,000 € 120,000 € P
Product Quality
Is-sues - NESTEA 7 20% € 10,000 € 15,000 € 17,000 P
Traffic risk of sales
personell 8 20% € 5,000 € 8,000 € 9,000 P
Knowledge Transfer
SAP 9 10% € 10,000 € 20,000 € 32,000 P
Relationship with main key account
(Mercator) 10 10% € 40,000 € 50,000 € 60,000 P
Waste packaging
re-gulation change 11 40% € 50,000 € 80,000 € 90,000 P
Slovene customers buying from foreign
CCH countries 12 40% € 40,000 € 50,000 € 60,000 P
External supply
de-pendency 13 15% € 40,000 € 65,000 € 70,000 P
Promotional
mecha-nics 14 5% € 10,000 € 20,000 € 22,000 P
Employee strike 15 5% € 10,000 € 50,000 € 60,000 P
Changed of GDA to
the traffic light 16 10% € 5,000 € 20,000 € 23,000 P
Appendix H
Figura 2: Probability curve for the Slovene subsidiary of the selected company according to the risk review in march 2010 Source: Risk model output of the selected company
Risk Model Cumulative Probability
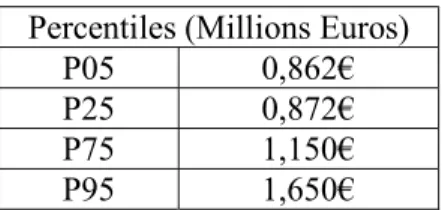
Appendix I
Table 7: The percentiles for cumulative impacto f the identified risks for the Slovene subsidiary of the selected company ac-cording to the risk review in march 2010
Source: Risk model output of the slovene subsidiary of the selected company, 2010
Percentiles (Millions Euros)
P05 0,862€
P25 0,872€
P75 1,150€
Appendix J
Figure 3: Risk model sensitivity analysis for the Slovene subsidiary of the selected company according to the risk review in march 2010
Source: Risk model output of the Slovene selected subsidiary of the selected company
Risk Model Sensitivity Analysis
Appendix K
Table 8: Comparisons between likelihood most likely costs of the identified risks according to the risk assessment in march and june 2010
Source: Risk model of the selected company 2010
March 2010 June 2010
ID Rrisk Description Likelihood Most likely
costs Likelihood Most likely costs
1 Direct sales distribution disruption 30% € 100,000 10% € 30,000
2 GDP below forecast 15% € 300,000 15% € 300,000
3 Increased competition - PLG will
in-crease activities in AFB 10% € 40,000 20% € 40,000
4 Introduction of PET deposit 60% € 80,000 10% € 80,000
5 Increased outstanding debts 10% € 80,000 20% € 80,000
6 People retention SAP 10% € 100,000 10% € 100,000
7 Product Quality Issues - NESTEA 20% € 15,000 20% € 15,000
8 Traffic risk of sales personell 20% € 8,000 20% € 8,000
9 Knowledge Transfer SAP 10% € 20,000 10% € 20,000
10 Relationship with main key account
(Mercator) 10% € 50,000 10% € 50,000
11 Waste packaging regulation change 40% € 80,000 30% € 80,000
12 Slovene customers buying from foreign
CCH countries 40% € 50,000 40% € 50,000
13 External supply point dependency 15% € 65,000 15% € 65,000
14 Promotional mechanics 5% € 20,000 5% € 20,000
Appendix L
List of abreviations:
ERM: Entreprise Risk Management EBIT: Earnings Before Interest and Taxes H,S&E: Health, Safety and Environment PLP: Property Loss Prevention
PERFIL DE RISCO DA GERAÇÃO MILLENNIUM
André Martins (Nº2046915)
Resumo
Num futuro próximo, a presença da geração millennium no mercado financeiro será predominante, sendo fundamental a compreensão do seu perfil de risco. A literatura existente apresenta uma lacuna relativamente a esta questão, sendo inviável a determinação da tolerância ao risco desta geração a partir da mesma.
Recorrendo a uma metodologia adequada, pretende-se assim definir o perfil dos millennials com base numa amostra representativa, composta por indivíduos de nacionalidade europeia e americana. Após a análise dos dados, pretende-se elucidar que os europeus e americanos considerados apresentam características semelhantes no que diz respeito ao risco, no entanto existem diferenças preponderantes ao proceder a uma análise por género. Demarca-se ainda uma relação positiva, mas fraca, entre a posse de conhecimentos financeiros e a tolerância ao risco.
Os elementos apresentados contribuirão para a elaboração de novos planos financeiros, que poderão ser analogamente aplicados à população europeia e americana, mas que deverão diferenciar os elementos masculinos e femininos, promovendo sempre a difusão de noções financeiras entre os investidores menos instruídos.
Introdução
O mercado financeiro tem sofrido várias alterações, demarcadas pela sucessão de várias gerações, que por sua vez possuem diferentes propensões ao risco. Relativamente aos últimos anos, tem se verificado um aumento do domínio da geração millennium, incentivando-se uma maior preocupação relativamente à compreensão do seu perfil de risco.
Esta preocupação não pode ser atenuada pelo recurso à literatura, uma vez que esta não dilucida de forma concreta a propensão ao risco apresentada pelos millennials, da mesma forma que perfaz com os baby boomers. Torna-se assim eminente, para o sucesso do mercado financeiro, perceber a capacidade, a necessidade e a preferência de risco desta geração, pois estes fatores constituem alicerces fundamentais do processo de tomada de decisão relativamente a potenciais investimentos.
A aquisição destas informações é essencial por parte dos futuros gestores financeiros, para que possam estruturar novos planos e estratégias de investimento adequadas e capazes de responder às necessidades de qualquer etapa geracional. Apesar da estabilidade do mercado financeiro não permanecer garantida, incentiva-se ainda assim o investimento.
Deste modo, esta resenha possui como objetivo central reunir dados suficientes, através dos questionários concretizados por Nguyen Vinh Loc (2017), capazes de auxiliar na definição das características básicas que influenciem o perfil de risco desta geração, plenificando desta forma a lacuna existente na literatura corrente relativamente a esta asserção.
diferenças relativamente aos perfis de risco entre os indivíduos europeus e os americanos e entre os indivíduos do género masculino e do feminino. Do mesmo modo, Loc (2017) dirigiu questionários, visando responder a questões coerentes com o objetivo desta resenha, nomeadamente:
“Qual é o perfil de risco de investimento dos millennials?
Quais são as diferenças nos perfis de risco dos millennials dos EUA e da Europa? Quais são as diferenças no perfil de risco entre os diferentes géneros: masculino e feminino?”
Elegeu-se como amostra indivíduos da Europa e dos EUA, pois estes constituem continentes com dimensões consideráveis, que albergam algumas das nações mais desenvolvidas e, portanto, com maiores apreensões a nível financeiro. Além disso, são superfícies com uma grande densidade de pessoas, as quais representam a maioria desta geração.
Para os devidos efeitos, esta resenha principiará por expor uma revisão da literatura existente, aferindo alguns conceitos fundamentais que determinam a conceção de um perfil de risco de um indivíduo. Analisar-se-á ainda as abordagens teóricas relativamente às características básicas que descrevem a geração dos baby boomers e dos millennials, com o objetivo de compreender o seu comportamento perante o risco a partir destas. Sintetizando, revistar-se-á investigações e trabalhos correntes sobre o perfil de risco, a geração dos baby boomers e dos millennials.
Através desta revisão, poderá instituir-se uma coesão entre as várias terminologias sobre a tolerância ao risco dos diferentes indivíduos, uma vez que a existência de várias teorias, torna a formação de um perfil de risco numa tarefa dotada de alguma complexidade. Assim, pretende-se determinar os conceitos mais relevantes, expondo simultaneamente uma rede concetual apropriada que facilite a caracterização do perfil de risco dos indivíduos inquiridos. Sublinhe-se que esta rede é apenas uma estrutura concetual personalizada por Loc (2017) que auxilia apenas na exemplificação da abordagem desta resenha.
Continuamente pretende-se explicitar a metodologia selecionada para alcançar os objetivos desta resenha, sendo ponderada a sua adequabilidade para o apuramento das características relativas ao perfil de risco da geração millennium. Expor-se-á o método utilizado para efetuar a recolha de dados e a razão da sua pertinência, mas também as limitações que advêm do seu uso. Este procedimento metodológico terá como principais variáveis a capacidade, a necessidade e a preferência de risco. Ainda no âmbito deste segmento, será descrita a forma de preparação para a análise das variáveis e das hipóteses a serem testadas.
Revisão Bibliográfica
A definição de um perfil de risco é um processo que determina o nível ótimo de risco, de acordo com as características de cada indivíduo. No entanto, existem vários conceitos associados a este termo, cuja distinção é essencial para esta resenha. Neste âmbito, considere-se o artigo desenvolvido por Nobre e Grable (2015), onde são apresentados os vários conceitos que são habitualmente confundidos. A noção mais comumente utilizada é tolerância ao risco, sendo descrita por Cordell (2001) como sendo a porção de risco que um sujeito é capaz de tolerar aquando de uma decisão financeira. Por outro lado, aversão ao risco é um conceito que se expressa de forma antagónica em relação ao anterior, podendo ser definido através da proporção inversa da vontade do sujeito para se envolver numa situação de risco.
Posto estes termos opostos, considere-se ainda a capacidade de risco, mensurada através da resistência apresentada por um indivíduo relativamente à perda potencial no âmbito de uma situação de risco, e propensão ao risco, que, como defendido por Carr (2014), representa um comportamento consistente perante o risco, negligenciando respostas impulsivas (Finke e Guillemette, 2016). Na prática, este último conceito tem o mesmo significado que necessidade de risco, sendo este, por sua vez, a porção do mesmo que é assumida de forma consciente pelo indivíduo para alcançar os seus objetivos financeiros. Por fim, existe ainda a preferência de risco, que aufere as preferências de um sujeito de entre várias opções de investimento, e o risco percecionado, que se constitui como uma “avaliação cognitiva” do risco presente numa decisão financeira.
Consequentemente, o perfil de risco de um indivíduo é definido através da utilização dos diferentes conceitos supramencionados, contudo a forma como estes são conjugados constitui um fator variável em diferentes obras. De acordo com a proposta de Cordell (2001), a propensão ao risco, a atitude de risco (preferência de risco), a capacidade de risco e o conhecimento de risco constituem os determinantes de um perfil de risco. Por outro lado, segundo Nobre e Grable (2015), apenas são admitidos elementos relativamente estáveis, negligenciando-se o conhecimento de risco, visto que este depende da educação de cada pessoa. Assim, estes autores defendem que a capacidade de risco, a propensão ao risco e a preferência de risco são os elementos fundamentais para a estipulação de um perfil de risco. De outro ponto de vista, Caviezel, Bertoli-barsotti, and Lozza (2011) incluem preferência de risco, horizonte temporal, conhecimento e experiência financeira. Constata-se, desta forma, que existem várias terminologias para caracterização de um mesmo perfil, verificando-se a necessidade de definir um conjunto uniforme de elementos para analisar o perfil de risco dos millennials.
Assim, os questionários desenvolvidos por Loc (2017) auferiram, como elementos decisivos de um perfil de risco, a capacidade de risco, a propensão ao risco e a preferência de risco, demonstrando semelhanças relativamente à proposta de Nobre e Grable (2015). No entanto, o modelo em questão considera o conceito de preferência de risco numa perspetiva mais abrangente, na medida em que integra a tolerância ao risco, sendo que se avalia a preferência dos indivíduos de entre várias opções de financiamento, em que é fornecido tanto o risco associado, como também a remuneração potencial. Através da atitude dos indivíduos nesta escolha, apura-se igualmente a proporção de risco tolerável por cada um, tornando-se justificável a integração deste conceito no âmbito da preferência de risco.
mercado cinzento ou por terceira geração, identifica os indivíduos que nasceram entre 1946 e 1964, tal como é referido nos artigos de Grable (2013) e Wellner (2000), embora este último autor considere ainda que se pode subdividir esta etapa geracional, argumentando que os indivíduos nascidos entre 1946 e 1953 apresentam características substancialmente diferentes daqueles que nasceram entre 1954 e 1964. Do mesmo modo, Schewe, Geoffrey e Noble (2000) distinguem duas subcategorias, nomeadamente, os “leading-edge boomers”, cujo ano de nascença situa-se entre 1946 e 1954, pelo que tiveram a oportunidade de experienciar um ambiente económico mais favorável, e os “trailing-edge boomers”, correspondendo aos baby boomers remanescentes. Wellner (2000) apresenta outra subcategorização baseada nos diferentes ambientes económicos e sociopolíticos presenciados por esta geração, arguindo que os indivíduos apresentam comportamentos e características económicas dispares consoante o contexto. Diferencia, assim, três subgrupos, os “leading boomers” (1946-1950), os que nasceram entre 1951 e 1959 e os “trailing boomers” (1960-1964).
De outra perspetiva, segundo Hallahan, Faff e McKenzie (2004), Riley e Chow (1992), Sung e Hanna (1996) e Grable e Joo (1999), a tolerância ao risco financeiro destes indivíduos também é influenciada positivamente pelo seu nível de educação e negativamente pela sua idade. Tendo ainda em conta a análise por género de Hallahan, Faff e McKenzie (2004), verifica-se que os homens desta geração possuem maior tolerância ao risco do que as mulheres, contudo ambos são influenciados positivamente pelo seu nível de rendimento. Grable (2013) argumenta, também, que as diferenças entre géneros podem ser explicadas pelos conhecimentos e experiências adquiridos por cada um, pelas condições socioeconómicas e pelos sistemas de socialização vigentes, sendo que todos estes fatores promoviam essencialmente a apreensão de risco pelos indivíduos do sexo masculino. Por fim, existem ainda estudos que concluem que os baby boomers são mais adversos ao risco, em relação aos seus sucessores, a geração X (1965-1979).
Posteriormente à geração X, surgem os millennials que, segundo Cutler (2015) e Goldman Sachs (2016), correspondem aos indivíduos nascidos entre 1980 e 2000. Atualmente estes possuem uma idade entre os 17 e os 38 anos, porém não demonstram uma grande apreensão por risco, pelo que os millennials preferem investir o seu dinheiro em situações que envolvem pouco risco, como em investimentos para a reforma ou de baixo retorno. Esta aversão demonstrada por esta geração, que faz com que estes prefiram aplicar o seu dinheiro em planos de investimento em detrimento da entrada no mercado de ações, é explicada por Henricks (2014), como um resultado da crise financeira de 2008-2009. Esta crise reformulou o conceito de risco apreendido por esta geração, posto que estes indivíduos o percecionam como uma perda potencial ao invés de um fator decorrente da imprevisibilidade do mercado.
A tolerância ao risco dos millennials não pode ser compreendida em função das suas capacidades cognitivas, contudo, tal como verificado nos baby boomers, o género influencia este fator, sendo que os homens são mais tolerantes ao risco do que as mulheres (Booth & Katic, 2013), e o conhecimento financeiro amplifica a tolerância ao mesmo (Larson, Eastman e Bock, 2016).
Metodologia
Os objetivos específicos da metodologia podem se sintetizar nos seguintes: determinar a capacidade, a necessidade e a preferência de risco da geração millennium; determinar o nível de conhecimento financeiro da geração millennium; determinar o impacto do nível de conhecimento financeiro no perfil de risco dos millennials; comparar o perfil de risco dos millennials entre géneros (masculino e feminino); comparar o perfil de risco dos millennials europeus com os americanos.
De forma a alcançar os objetivos supramencionados, procedeu-se à elaboração de um questionário online, baseado no apuramento de dados relativamente aos quatro elementos determinantes de um perfil de risco, nomeadamente, capacidade de risco, necessidade de risco, preferência de risco e conhecimento financeiro. Os benefícios do questionário online associam-se, principalmente, à redução de custos e à facilidade de distribuição e de registro de dados, contudo este método apresenta um grande inconveniente, posto que promove a alavancagem da taxa de abstenção.
O questionário subdivide-se em duas partes, sendo que a primeira é composta por quatro questões principais, que se consideram mais relevantes para esta resenha, e a outra por perguntas de natureza demográfica. A primeira questão averigua o nível de conhecimento do inquirido; a segunda, por sua vez, visa determinar a sua capacidade de risco; a terceira analisa a necessidade de risco; e a quarta, por fim, apura a sua preferência de risco. Seguidamente, na segunda parte do questionário, verificam-se dados relativos ao género, à idade e à nacionalidade dos inquiridos. O apêndice 1 representa um exemplar do questionário.
As possíveis respostas às questões principais estão codificadas de 1 a 5, correspondendo a valores muito baixos e muito altos, respetivamente, quantificando-se assim os vários elementos do perfil de risco dos inquiridos. Exemplificando, é atribuído a classificação de 2 relativamente à capacidade de risco, se determinado indivíduo escolher a segunda possível na primeira pergunta. Após a recolha de dados, as respostas são registadas de acordo com a classificação atribuída por cada indivíduo, posto que aos itens sem classificação é imputada uma pontuação de -99, sendo estes excluídos posteriormente da análise. De forma equivalente, as perguntas da segunda parte também serão codificadas numa escala variável, como por exemplo, relativamente à questão do género determina-se “1” para “masculino” e “2” para feminino, como também em relação à questão da nacionalidade se têm “1” para “europeu” e “2” para “americano”. O quadro 1 exibe um exemplo de um quadro gerado a partir dos dados recolhidos.
Respondent Q1 Q2 Q3 Q4 Q5 Q6 Q7
#1 1 3 3 3 1 1 1997
#2 3 4 4 4 2 2 1998
#3 4 5 5 5 1 1 1992
#4 2 2 2 2 2 2 1990
#5 -99 3 1 1 -99 3 1985
#6 1 1 4 2 2 2 2000
#7 2 2 2 2 2 3 1987
Quadro 1 – Exemplo de conjunto de dados codificados (Loc, 2017)
europeia ou americana. Devido a problemas logísticos, este questionário não será dirigido à população toda, recorrendo-se a uma amostra significativa, constituída por estudantes universitários, uma vez que estes representam uma grande porção dos millennials. Para além disso, garante-se o acesso à internet dos inquiridos, visto que estes frequentam universidades que disponibilizam o mesmo.
As universidades europeias e americanas selecionadas são, respetivamente, Aalto University (Finlândia), Mikkeli University of Applied Sciences (Finlândia), HAN University of Applied Sciences (Holanda), Gustavus Adolphus College (Estados Unidos), Soka University of America (Estados Unidos) e Mount Holyoke College (Estados Unidos). Estas instituições oferecem diferentes cursos, mas nem todos se encontram orientados para o mercado empresarial, o que proporcionará uma amostra composta por indivíduos, não só de diferentes géneros, como também com diferentes níveis de conhecimento financeiro.
Após a estruturação do questionário, este foi analisado minuciosamente, primeiramente em termos da sua interpretação linguística e, posteriormente, por professores que avaliaram o seu conteúdo. De modo a garantir a clareza e a uniformidade, tornou-se necessário proceder a algumas alterações na formulação das questões, assegurando a compreensão das mesmas pelos inquiridos e, consequentemente, gerando resultados mais precisos. Deste modo, relativamente à segunda pergunta, inicialmente tinha-se um retorno esperado de 0% para uma aposta errada, pelo que se alterou para um retorno de 10%, de forma a incitar uma maior preponderância na escolha do inquirido. Além disso, a resposta permitia um investimento de 100%, mas constatou-se que a probabilidade de alguém apostar todo o seu rendimento era mínima, mudando-se para uma escala com um máximo de 80%. Procedeu-se a mudanças, também, na pergunta 3, pois, tendo em conta que nem todos os inquiridos possuem o mesmo nível de conhecimentos financeiros, trocou-se os termos “ações” e “obrigações” para “ativos mais arriscados” e “ativos mais seguros”, respetivamente. Por fim, foram feitas alterações na questão 4, da mesma índole das que foram feitas na questão anterior, no entanto também foi necessário mudar o formato do enunciado, na medida em que inicialmente se pretendia que o inquirido selecionasse as três opções mais atrativas, mas visto que isso interferia no sistema de codificação dos dados (escala de 1 a 5), alterou-se para a seleção de uma única opção.
Seguidamente, o questionário foi distribuído a um pequeno grupo de estudantes com o intuito de auferir algum equívoco, porém não foi detetado qualquer erro na recolha dos dados, bem como na sua codificação. Verificou-se também que os alunos demoraram em média cerca de 2 minutos para concluir o questionário. Demarque-se que os dados apurados a partir deste teste não foram utilizados para o estudo em causa, visto o propósito original deste, mas foram enviados, simultaneamente com o questionário e os procedimentos de recolha, registo e análise de dados, ao professor supervisor, a fim de obter a sua aprovação. Assim, no dia 13 de março de 2017, a autorização para a publicação do questionário foi concedida e, no mesmo dia, o link para o mesmo foi distribuído pelos estudantes, através dos media sociais utilizados habitualmente por estes, sendo que a sua participação era voluntária.