Ana Margarida Brites Caetano Dinis
DOCTORATE IN BIOLOGICAL SCIENCESMarch| 2014
Ecology and Conservation of Bottlenose Dolphins
in Madeira Archipelago, Portugal
SUPERVISOR Manfred Josef Kaufmann
CO-SUPERVISOR Ana Cañadas
Ana Margarida Brites Caetano Dinis
DOCTORATE IN BIOLOGICAL SCIENCES
in Madeira Archipelago, Portugal
ii
ACKNOWLEDGMENTS
This thesis would have not been possible without the help and support of many people throughout the years.
First, I would like to thank my supervisor and friend Manfred Kaufmann, for accepting supervising this work, for being available to my questions and for all his wise recommendations. Thank you for your continuous support.
Secondly, sincere thanks to my co-supervisor Ana Cañadas, for accepting this task and providing advice whenever I needed it.
Also, I would like to thank the director of the Madeira Whale Museum, Luís Freitas, for getting financial and logistic support, throughout several scientific projects, that made this work possible.
A special thanks to my colleagues from the 'survey team' Filipe Alves, Cátia Nicolau, Cláudia Ribeiro, João Viveiros and Hugo Vieira for sharing precious moments at sea. We had some great times "off effort" gathered around the helm returning to the harbour. Thanks for putting up with me whenever the mood wasn't the best.
A sincere tribute to Miguel Silva, our skipper, that leaved us too soon.
I am particularly grateful to biologists and colleagues Filipe Nóbrega, Ricardo Antunes, Carla Freitas and Nuno Marques, and also to the volunteers Rita Ferreira, Ana Higueras, Marianne Böhm-Beck, Jonatan Svensson, Virginie Wyss, Daniel Martins, Mafalda Ferro and Filipe Henriques, that collected data and assisted with fieldwork since the beginning of this work.
iii
Many, many thanks to Cláudia Faustino and Filipe Alves for scientific and English review in the final stages of this thesis write up.
I am also grateful to Philip Hammond for always finding time in his busy schedule to answer all my doubts and for advises with mark-recapture methods.
I thank Hal Whitehead for quickly answering my doubts, via e-mail concerning the social structure analysis.
I would like to thank to Mónica Silva for giving me a hand with the last data chapter, and for all the useful suggestions.
A big thanks to Cátia, Filipe and Cláudia for all the years that we worked together, that greatly contributed for this work. I thank you for all the valuable advices and for "covering" for me during my maternity leaves, never forgetting the bottlenose dolphins.
Thanks to all my colleagues in the Madeira Whale Museum, Ana, Tina, Milton, Sílvia, Carla, Rui, Adalberto and Ricardo for all the "coffee breaks" and lunches, talking about something else besides bottlenose dolphins.
Above all, I'm tremendously grateful to my family for the never-ending support and encouragement. To my husband Roberto, for the love and patience whenever my mind was somewhere else. To my lovely daughters for the numerous interruptions when I'd tried to work at home, always pulling me into the world of fairies and princesses (first things first!). To my mother for all the love and support across the years. To my sister Ângela for all the encouragement and for being just a "phone call away" whenever I needed, and for all the laughs for stupid things.
iv
DECLARATIONS
I hereby declare that this thesis was written by me, and that I have actively participated in the data collection. Also, I was responsible for all the analysis with the exception of the GIS work and mapping, that was done by Adalberto Carvalho. Nonetheless, this study was developed while I was a researcher in the Madeira Whale Museum, and data was collected throughout several scientific projects in which various people were involved. The scientific projects were co-funded by the Machico Town Hall and by EU and national programs, as listed below:
2000 to 2004; CETACEOSMADEIRA 'Projecto para a Conservação dos Cetáceos no arquipélago da Madeira' - LIFE 99NAT/P/6432;
2004 to 2005: MACETUS 'Estudo da estrutura populacional, distribuição, movimentos e utilização do habitat do Physeter macrocephalus, Globicephala macrorhynchus, Tursiops truncatus e Stenella frontalis na Macaronésia' -
FEDER/INTERREG IIIB MAC/4.2/M10;
2005 to 2006: GOLFINICHO 'Utilização diferencial do nicho espacial e trófico entre o golfinho-comum (Delphinus delphis) e o golfinho-pintado (Stenella frontalis) nos
Açores e Madeira' - FCT POCI/BIA-BDE/61009;
2006 to 2008: EMECETUS 'Estudo, Monitorização e Educação para a Conservação dos cetáceos na Macaronésia' - FEDER/INTERREG IIIB 05/MAC/4.2/M10;
2009 to 2013: CETACEOSMADEIRA II 'Identifying critical marine areas for
bottlenose dolphin and surveillance of the cetaceans’ conservation status in
v
ABSTRACT
This study aimed to provide an insight on the ecology of the bottlenose dolphin population in Madeira archipelago. To achieve this, population structure; group dynamics, site-fidelity, residency and movement patterns within and out of the study area; survival and abundance estimates and spatial and temporal distribution and habitat preferences related to physiographic parameters using data collected between 2001-2011, were investigated. Photo-identification data analysis revealed strong evidences that bottlenose dolphins seen in the archipelago of Madeira belong to an open population with regular recruitment of new animals to the area. This population exhibited a typical fission-fusion society, in which short-term acquaintances prevail, with only a few long-lasting associations. Photo-identification methods demonstrated that there is a large variability in residency pattern, with resident, transient and migrant individuals. Only a small number of dolphins were found to be resident (4.3%). Social network diagram as well as SLAR analysis supported the existence of a mixed population of residents, migrants and transients. Mark-recapture methods estimated a high survival rate, within the range of other long-lived cetacean species. The resident community is composed of app. 180 individuals. In addition, around 400 dolphins of different residency patterns were found to use the south area of Madeira Island. Spatial distribution indicated that bottlenose dolphins were regularly found in shallow and closer to shore areas, suggesting the existence of biological processes influenced by bathymetry. Moreover, temporal patterns revealed no strong seasonal fluctuation in the presence of bottlenose dolphins in Madeira archipelago waters. Bottlenose dolphins are listed under the Annex II of the EU habitats Directive that requires the designation of Special Areas of Conservation (SACs) for this species; as such, the knowledge gained through this work can be used by governmental authorities to the establishment and management of areas for the conservation of bottlenose dolphin in Madeira archipelago.
vi
RESUMO
Este trabalho teve como objectivo investigar a ecologia da população de golfinhos roazes no Arquipélago da Madeira. Foram utilizados dados de 2001-2012 para investigar a estrutura populacional; estrutura e composição dos grupos, residência, movimentos na área de estudo; taxas de sobrevivência e o tamanho da população e, finalmente a distribuição espacial e temporal. A análise dos dados de foto-identificação indicaram que os animais avistados no arquipélago pertencem a uma população aberta com recrutamento regular de novos indivíduos. Esta população revelou ter uma estrutura dinâmica, na qual prevalecem as associações rápidas e de curta duração. Através da foto-identificação verificou-se a existência de três padrões diferentes de residência: residentes, migrantes e transeuntes. Apenas um pequeno número de golfinhos demonstrou ser residente (4.3%).O diagrama social e as associações temporais revelaram que os golfinhos dos três padrões de residência se misturam. Através de métodos de captura e recaptura foi possível estimar uma taxa de sobrevivência elevada. Cerca de 180 golfinhos são residentes. Também foi possível determinar que cerca de 400 animais de diferentes padrões de residência, utilizaram as águas do sul da Ilha da Madeira, no período de estudo. A distribuição espacial revelou que a maioria dos golfinhos foi avistada em águas menos profundas e mais próximo da costa, sugerindo a existência de processos biológicos influenciados pela batimetria. A distribuição temporal não revelou marcadas flutuações sazonais na presença de golfinhos no arquipélago. Os golfinhos roazes são uma das espécies presentes no Anexo II da Directiva Habitats da União Europeia. Como tal, é requerido aos países membros a criação de Zonas Especiais de Conservação para esta espécie; assim, espera-se que o conhecimento adquirido através deste estudo possa ser utilizado pelas entidades governamentais para a implementação e gestão de áreas de protecção para o golfinho roaz no arquipélago da Madeira.
vii
TABLE OF CONTENTS
ACKNOWLEDGMENTS ... ii
DECLARATIONS ... iv
ABSTRACT ... v
RESUMO ... vi
List of tables ... xi
List of figures ... xii
CHAPTER 1 GENERALINTRODUCTION ... 1
1.1 Conservation of the marine environment ... 1
1.2 Cetacean Biology and Ecology ... 2
1.3 The Bottlenose Dolphin, Tursiops truncatus, (Montagu, 1821) ... 3
1.3.1 Characteristics and Systematics ... 3
1.3.2 Distribution and Ecology ... 4
1.3.3. Life history ... 5
1.3.4 Home range and Migration ... 5
1.3.5 Group Size and Social Behaviour ... 6
1.3.6 Status and Conservation ... 6
1.4 Study area: The Archipelago of Madeira ... 7
1.5 Thesis main objectives and rationale ... 10
1.6 Chapters overview ... 12
References ... 13
CHAPTER2 POPULATION STRUCTURE OF BOTTLENOSE DOLPHINS IN MADEIRA ARCHIPELAGO... 21
2.1 INTRODUCTION ... 21
2.2 Methods ... 23
2.2.1Study area ... 23
2.2.2 Photo-identification surveys ... 25
2.2.3 Photo-identification processing ... 27
2.2.4 Association patterns ... 28
2.2.4.1 Cluster analysis ... 29
viii
2.3.1 Photo-identification surveys ... 33
2.3.2 Associations patterns ... 34
2.3.2.1 Cluster analysis ... 36
2.3.2.2 Temporal analyses: Standardized Lagged Association Rate (SLAR) ... 39
2.4 Discussion ... 41
2.4.1 Photo-identification ... 41
2.4.2 Association patterns ... 41
References ... 44
CHAPTER3 GROUP DYNAMICS, SITE FIDELITY, RESIDENCY AND MOVEMENT PATTERNS ... 51
3.1 INTRODUCTION ... 51
3.2 METHODS ... 52
3.2.1 Study area, field surveys and photo-identification ... 52
3.2.2 Group dynamics ... 53
3.2.3 Site fidelity ... 53
3.2.4 Residency ... 54
3.2.5 Movement patterns ... 56
3.3 RESULTS ... 56
3.3.1 Group dynamics ... 56
3.3.2 Site fidelity ... 59
3.3.3 Residency ... 61
3.3.4 Movement patterns ... 64
3.4 DISCUSSION ... 64
3.4.1 Group Dynamics ... 64
3.4.2 Site Fidelity ... 66
3.4.3 Residency ... 67
3.4.4 Movement patterns ... 68
References ... 69
CHAPTER 4 SURVIVAL AND ABUNDANCE ESTIMATES OF BOTTLENOSE DOLPHINS IN MADEIRA ARCHIPELAGO .. 77
4.1 INTRODUCTION ... 77
4.1.1Model assumptions ... 78
ix
4.2.1 Photo-id surveys ... 81
4.2.2 Photo-id processing ... 83
4.2.3 Construction of capture history ... 83
4.2.4 Data organization and analysis ... 83
4.2.4.1 Survival rates and capture probabilities ... 83
4.2.4.2Abundance ... 85
4.3 RESULTS ... 87
4.3.1 Photo-id surveys ... 87
4.3.2. Capture-recapture data used ... 88
4.3.3. Goodness of Fit tests ... 90
4.3.4 Survival rates and capture probabilities ... 91
4.3.5 Abundance ... 92
4.3.5.1Arnason-Schwarz model (POPAN) ... 92
4.3.5.2 Chapman-modified Peterson estimator ... 94
4.4 DISCUSSION ... 95
4.4.1 Model assumptions ... 95
4.4.2 Survival ... 97
4.4.3 Capture probabilities ... 98
4.4.4 Population size ... 98
References ... 100
CHAPTER5 SPATIAL AND TEMPORAL DISTRIBUTION OF BOTTLENOSE DOLPHINS IN MADEIRA ARCHIPELAGO 106 5.1 INTRODUCTION ... 106
5.2 METHODS ... 107
5.2.1 Study area ... 107
5.2.2 Field methods ... 108
5.2.3 Data analysis ... 108
5.2.3.1 Spatial distribution ... 109
5.2.3.2 Temporal distribution ... 109
5.3 RESULTS ... 110
5.3.1 Effort and sightings ... 110
5.3.2 Spatial distribution ... 111
5.3.3 Temporal distribution... 117
x
5.4.2 Spatial distribution ... 119
5.4.3 Temporal distribution... 121
6.4-Conclusions ... 121
References ... 122
CHAPTER6 GENERAL DISCUSSION ... 127
6.1 - Population Structure ... 128
6.2 - Group dynamics, Site fidelity, Residency and Movement patterns ... 129
6.3 - Population Parameters ... 130
6.4 Spatial and temporal distribution ... 131
6.5 Implications for conservation of bottlenose dolphins in Madeira archipelago ... 132
6.6 Directions of Future work ... 134
xi
List of tables
Table 2.1 – Description of the models that can be fitted to the SLARs, using maximum likelihood and binominal loss, in SOCPROG 2.4...33
Table 2.2 – Tests for non-random associations among bottlenose dolphins seen ≥ 3 times...36
Table 2.3 – Exponential models using maximum likelihood and binominal loss, used to describe the temporal pattern of associations of bottlenose dolphins in Madeira. The best model corresponds to that with lower ΔQAIC value (highlighted in bold)...40
Table 3.1 - Models that can be fitted to Lagged Identification Rates. The terminology of the fitted
models must be interpreted with care: 'emigration' means emigration from the database, there is no way of knowing if the dolphins actually died, left the study area or simply were not captured again...55
Table 3.2 – Models fit to LIRs for bottlenose dolphins observed in Madeira archipelago: residence times and movements in and out the study area, for all individuals captured, between 2004 and 2012 (n=estimated population size in the study area).* marks the best fit model (with the lowest
QAIC value) fitted to the LIR graph...63
Table 3.3 – Probability of individual bottlenose dolphins to move between sectors (1-8) and to areas outside the main study area (OUT), within one day period. (µ)is the probability that an individual remains in a given sector one sampling period later...63
Table 4.1 – Summary of captures history with the number of individuals marked and recaptured in each year, from 2001 to 2012...88
Table 4.2 – Summary data for POPAN as implemented in MARK, including type of pooling, period of data collection, number of occasions, number of uniquely marked individuals captured and number of individuals captured after removal of the 1st capture...89
Table 4.3 - Summary data used in the 2-sample Chapman-modified Peterson estimator,
including type of pooling, period of data collection, number of sampling occasions, number of uniquely marked individuals captured and number of individuals recaptured...90
Table 4.4 – Results from the GOF tests run in U-CARE for the seasonal data set used in POPAN, including the results of the overall test (TEST 2+3). Ĉ was estimated by dividing the ᵡ2 by the
xii
first capture. φ = survival; p= capture probabilities ;(.)=constant; (t)=time...91
Table 4.6 – Model selection for POPAN data pooled by seasons without the first capture.φ=
apparent survival; p= capture and β= probability of entry ;(.)=constant ;(t)=time...92
Table 4.7 - Averaged estimates of seasonal population size (Ntot). 𝑁̂ is the seasonal estimate of well-marked individuals. L CI= lower confident interval; U CI= upper confident interval; 95% CI are corrected for the total population (marked and unmarked). Proportion of well-marked= 0.68...93
Table 4.8 –Number of dolphins captured each season (n1 and n2), number of matches (m2) and
estimates of abundance for each pair of seasons (𝑁̂)...94
Table 4.9 – Number of total abundance after correcting for the proportion of unmarked dolphins (Ntot) and 95% confident intervals L CI= lower confident interval; U CI= upper confident interval; Proportion of well-marked= 0.68...95
Table 5.1 - Km surveyed, number of groups and encounter rate(ER) of bottlenose dolphins sighted per year and type of survey...110
List of figures
Figure 1.1- Map of the northeast Atlantic showing the location of the archipelago of Madeira and its Exclusive Economic Zone (EEZ)...8
Figure 1.2- Map showing the Madeira EEZ and the inshore area where data was
collected...9
Figure 1.3- Map showing the bathymetry of the waters around Madeira, Desertas and
Porto Santo...9
xiii
Figure 2.2 – Map of the main study area with the division of the eight sectors used in this study: S1- Madeira North; S2- Madeira West; S3- Madeira South; S4- Desertas East; S5- Desertas West; S6- Channel; S7- Porto Santo South and S8- Porto Santo North...25
Figure 2.3 – Examples of (a) good, (b) fair and (c) bad quality photos of the same individual, Tt 250...27
Figure 2.4 – Examples of (a) very distinctive, (b) distinctive, (c) slightly distinctive and (d) unmarked individuals...28
Fig. 2.5- Discovery curve of the total number of distinctly marked individual dolphins (solid line) and the total number of individuals captured >1 time (dashed line)...34
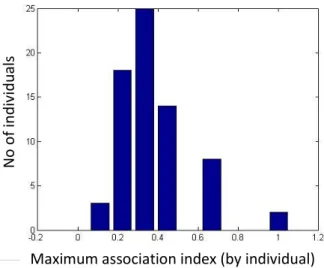
Figure 2.6 – Distribution of the maximum association index for distinctive individuals, captured
≥3 times in the study area...35
Figure 2.7 – Distribution of the sum of association index for each individual, captured more than three times in the study area...35
Figure 2.8 – Dendrogram of bottlenose dolphins in Madeira archipelago using hierarchical cluster analysis. The average linkage and the Simple Ratio Index for association for individuals seen ≥3 times from 2001-2012 is shown. The dashed line represents cluster division resulting from Modularity-G method...38
Figure 2.9 – SLAR for bottlenose dolphins captured between 2004 -2012 using a moving average of 3000 associations. Estimated SE bars were produced by jackknifing on each sampling period. The best-fit model suggests casual acquaintances and was obtained using maximum likelihood methods. The null association rate represents the expected value of the SLAR if there was no preferred association and is included for reference...40
xiv
quartiles respectively; the band inside the box is the median. Vertical bars correspond to maximum and minimum group size and points (O) represents outliers...57
Figure 3.3 – Frequency of groups containing calves across months...58
Figure 3.4 – Species seen in association with bottlenose dolphins. Short-finned pilot whale (Globicephala macrorhynchus), n=23; Bryde’s whale (Balaenoptera edeni), n =6; Balaenoptera sp.,
n=4; Atlantic spotted dolphin (Stenella frontalis), n=1; false killer whale (Pseudorca crassidens)
and sperm whale (Physeter macrocephalus), n=1...59
Figure 3.5– Number of identified bottlenose dolphins in the Madeira archipelago versus the
number of years they were sighted in, between 2001-2002 and 2004-2012...60
Figure 3.6 –Mean Monthly Sighting Rate (MMSR) vs the number of years the dolphins were
sighted in. Confident intervals are represented by vertical bars...60
Figure 3.7 – Social network diagram illustrating the associations of 441 dolphins identified in the study area. Individual dolphins are represented by nodes; associations are shown by the lines between nodes. Residency patterns are indicated by the different shapes and colours of the: residents are represented as blue boxes, migrants as pink circles and transient as grey triangles...61
Figure 3.8 – Zoom of the main cluster taken from Figure 3.6 were the centrality of resident individuals is highlighted. Bottom left: detailed view of resident dolphins...62
Figure 3.9–Lagged identification rate (LIR) for all individuals captured between 2004 and 2012. Data points are represented by circles and the best fit model (Emigration+reimmigration) is displayed by a solid line...63
Figure 4.1 – Map of the Madeira archipelago in the Northeast Atlantic (small picture) and the
study area (in grey on the larger picture) showing the more intensively surveyed area which
includes the area of operation of the whale-watching boats (diagonal stripes)(adapted from Alves
xv
Figure 4.2 - Discovery curve of the total number of marked individual dolphins (solid line) and the total number of individuals recaptured >1 time (dashed line)...88
Figure 4.3 – Annual capture probabilities estimated from CJS model. Vertical bars represent the 95% confidence intervals...92
Figure 4.4 – Seasonal abundance estimates (marked and unmarked) in the South sector of Madeira Island, obtained with POPAN (excluding transients). Vertical bars represent 95%
confidence intervals...93
Fig. 5.1- Map representing the different sectors for non-systematic surveys...108
Figure 5.2 - Effort tracks and sightings from systematic surveys (left) and non-systematic surveys (right)...111
Figure 5.3 - Effort distribution in systematic surveys, excluding grid cells with ≤5km of effort...112
Figure 5.4 - Effort distribution in non-systematic surveys, excluding grid cells with ≤5km of effort...112
Figure 5.5 - Encounter rate by grid cells for systematic surveys (top) and non-systematic surveys (bottom) over the pre-established sectors...113
Figure 5.6 - Distribution of encounter rate (bars) and search effort (•) in relation to depth, distance to coast and slope, per type of survey: left- systematic surveys; right - non- systematic...115
Figure 5.7 - Best fit predictions between the response variable (encounter rate) and three static variables: depth (top); distance to coast (middle) and slope (bottom). Systematic surveys are plotted on the left and non-systematic surveys are plotted on the right...116
xvi
1
CHAPTER 1
GENERAL
INTRODUCTION
1.1 Conservation of the marine environment
Conservation and protection of marine life is becoming more important as we better understand the importance of the oceans and our impacts on them. Both direct and indirect anthropogenic impacts can influence species in the marine environment. However, direct impacts such as boat disturbance, over fishing, by-catch and ship strikes often cause immediate declines among various marine species (Mann et al. 2000). Moreover, in the last 50 years land and sea surface
temperatures have increased globally as a result of climate change (IPCC 2001). Global and regional impacts from increased temperatures include changes in weather patterns, ocean currents, salinity, pH, sea-ice cover and rises in sea levels. As a result, many governments are now establishing plans and taking actions to reduce and monitor the effects of global warming (Skilling 2007). Marine habitat conservation is lagged behind land conservation (Hoyt 2011), and establishing measures to prevent human activities from impacting too negatively marine ecosystems, is vital for conservation of biodiversity (Cañadas 2006).
2
that contributes significantly to the maintenance or restoration at a favourable conservation status of a natural habitat type in Annex I or of a species in Annex II'.
A special area of conservation (SAC) is defined as 'a site of community importance where necessary measures are applied to maintain, or restore, to favourable
conservation status, the habitats or populations of the species for which the site is designated' (European Union Habitats Directive,
1992).
In order to be accepted as part of the European Natura 2000 Network of protected areas, a proposed SAC should demonstrate being of particular importance for the conservation of the species (Cañadas 2006).
1.2 Cetacean Biology and Ecology
Cetaceans include 87 species of whales, dolphins and porpoises (Hoyt 2011) and they are key components of marine ecosystems (Croll et al. 1998). The role of
cetaceans in ecosystem functioning and dynamics is still poorly understood, as they spend most of their lives hidden below the water's surface (Connor et al.
2000). Despite their diversity of form, behaviour and habitat, these aquatic mammals share some common characteristics, such as being air-breathing and live-bearing homeotherms, like their terrestrial ancestors (Ballance 2009). They are long-lived, reproduce slow, yet they have invaded a large proportion of the ocean's habitats (Connor et al. 2000). They inhabit coastal waters up to the top
Chapter 1 - General Introduction
3
is often a difficult task, particularly in the dynamic marine environment (Connor et al. 2000).
Understanding the ecological mechanisms that make some species more prone to population decline, range contraction, and extinction than others has been always one of the main goals of marine mammal researchers. Information on the abundance, status, distribution, behaviour and movement patterns of wild populations contributes to establishing appropriate conservation and management initiatives (Lettink & Armstrong 2003).
1.3 The Bottlenose Dolphin,
Tursiops truncatus
, (Montagu, 1821)
The common bottlenose dolphin, Tursiops truncatus, (Cetacea: Delphinidae)
(hereafter referred as bottlenose dolphin) is, without any doubt, the best known of all cetaceans (Wells & Scott 2009). For most people the word 'dolphin' invokes an image of a bottlenose dolphin (Connor et al. 2000), as they are one of the most
displayed cetacean in public performances in aquaria (Corketon 2009). Also, their proximity to human activity exposes them to numerous threats. Although not endangered at genus level, specific populations of bottlenose dolphins might be considered threatened (Connor et al. 2000). Ultimately, they are apex predators,
and determining the status of a bottlenose dolphin population may prove to be a useful indicator of the health and stability of the surrounding environment.
1.3.1 Characteristics and Systematics
Bottlenose dolphins are cosmopolitan in distribution, and demonstrate a great deal of geographic variation in morphology. They are recognizable by their medium-size, robust body, a moderate falcate dorsal fin, and dark coloration (Well & Scott 2009). The genus Tursiops exhibits striking regional variations in body size
(Connor et al. 2000), and it appears to vary inversely with water temperature in
4
Phylogenetic variation along with geographic location, body size, tooth count and coloration indicate the presence of two species T. truncatus and T. aduncus within
the genus (Ross 1977, Curry 1997, LeDuc et al. 1999). The systematics of the genus Tursiops is presently unclear as recent genetic, morphologic, and physiologic
studies suggest that revision of the genus may be necessary to acknowledge significant differences between forms from different oceans, as well as differences between forms in inshore versus offshore habitats within ocean basins (Le Duc et al. 1999; Rice 1998; Mead & Potter 1995; Hersh & Duffield 1990). Differences
between inshore and offshore ecotypes have been interpreted with respect to habitat differences: higher haemoglobin concentration, hematocrits, and red blood cell counts of offshore animals suggest an adaptation for greater oxygen-carrying capacity to facilitate deeper and longer dives (Duffield et al. 1983); smaller body
sizes and larger size of flippers of coastal animals may be an adaptation to shallow habitats where manoeuvrability is important (Hersh & Duffield 1990); and differences in skull dimensions between the two forms seem to be related to distinct feeding habits and foraging strategies (Hersh & Duffield 1990).
Although information on the distribution of the two ecotypes is scarce in most geographic areas, in the western North Atlantic there is some evidence of habitat partitioning. The coastal population occupy very shallow waters, coastal to shore, while offshore bottlenose dolphins usually occur along the shelf break (Kenney 1990; Torres et al. 2003).
1.3.2 Distribution and Ecology
Chapter 1 - General Introduction
5
and even into shore (Connor et al. 2000). Resuming, bottlenose dolphins are
described as opportunistic feeders that take advantage of locally available prey (Barros & Odell 1990).
1.3.3. Life history
Bottlenose dolphins, like all cetaceans are long-lived mammals. Females can live more than 50 years and reach sexual maturity between five and thirteen years, whereas males may live more than 40 years and become sexually mature from eight to thirteen years (reviewed in Connor et al. 2000). Bottlenose dolphins show
diffuse seasonal reproduction, with usually one or two peaks in the timing of births around spring/early summer and fall (Mann et al. 2000). Females give birth to a
single calf after a twelve-month gestation period (Schroeder 1990, Schroeder & Keller 1990). Calves are reported to stay with their mothers for several years (Wells et al. 1987, Smolker et al. 1992). Maternal investment is high, with some
calves observed nursing up to three years of age (Mann et al. 2000), although
longer dependencies are not uncommon (Connor et al. 2000).
1.3.4 Home range and Migration
Bottlenose dolphins show a full spectrum of movements, from seasonal migrations, year-round home ranges, periodic residency, and a combination of occasional long-range movements and repeated local residency (Shane et al. 1986; Wells & Scott
1999). At many sites worldwide, long-term residency has been reported. In one of the longest-term study of its kind, the year-round residents of dolphin communities along the west coast of Florida have maintained stable, slightly overlapping home ranges during more than 40 years of observations, spanning at least five generations (Wells 2003; Wells & Scott 1999; Scott et al. 1990). Adjacent
communities can be distinguished by genetic and behavioral differences, and are often demarcated by physiographic features (Duffield & Wells 2002; Parsons et al.
6 1.3.5 Group Size and Social Behaviour
Small groups of 2-15 individuals are typical for bottlenose dolphins, although groups of more than 1 000 have been reported on occasion (Shane et al. 1986;
Scott & Chivers 1990). As seen in other dolphin species, bottlenose dolphins tend to form larger groups when inhabiting more open, pelagic waters (reviewed by Shane et al. 1986). Factors contributing to this trend seem to be the risk of
predation in open habitats and a change in foraging strategies, transiting from solitary preying on reefs or shallow waters to schooling fish in the open water (Norris & Dohl 1980).
One characteristic that all populations of bottlenose dolphins appear to have in common is a fission-fusion society, with sex, age, reproductive condition, familial relationships, and affiliation histories defining their dynamic groups at any given time (Connor et al. 2000; Wells 2003). Unlike animals that live in groups of
constant composition, social relationships in fission-fusion society may depend strongly on the social context at a given moment (Connor et al. 2000). Groups can
be composed by females and calves, mixed sex groups of juveniles, or even strongly-bonded pairs or trios of adult males (Rogers et al. 2004; Owen et al. 2002;
Connor et al. 2000; Wells et al. 1987). The patterns of association in this species
seem to exhibits great variability. In Sarasota and Shark Bay strong male-male associations were found but, possibly not in the Moray Firth, Scotland (Wells et al. 1987; Smolker et al. 1992; Wilson et al. 1993). Some males form strong bonds
with others, but some travel alone (Wells et al. 1987). In Shark Bay and in Sarasota
some females are highly social while others are more solitary. It is possible to relate these differences between populations, and in some cases within populations, to differences in risk of predation or availability of prey (Connor et al. 2000).
1.3.6 Status and Conservation
In the IUCN red list, the bottlenose dolphin was classified as Data Deficient until
Chapter 1 - General Introduction
7
threats to local populations (e.g. pollution, fishing interaction, direct hunt, marine
traffic, tourism), as a species it does not appear to merit concern for major global population decline (Wells & Scott 2009). Likewise, the conservation status for this species in Madeira archipelago is Least Concern (Cabral et al. 2005).
The species is listed in Annex II of Habitats Directive (Natura 2000 network) and Appendix II of CITES. EU governments, throughout the Habitats Directive, are required to consider the areas where this species occurs for the establishment of Special Areas of Conservation (SACs) (Cañadas 2006; Wilson et al. 1997). At a
regional scale, the species is legally protected in the Exclusive Economic Zone (EEZ) of the archipelago of Madeira since 1986 by the Dec.-Leg. Regional 6/86/M (Cabral et al. 2005).
1.4 Study area: The Archipelago of Madeira
The archipelago of Madeira (Portugal) is located in the warm-temperate waters of the northeast Atlantic Ocean (32° N, 017°W), nearly 1000 km from the European continent and 500 km of the West African coast. It is considered one of the most isolated archipelagos of the North Atlantic Ocean (Alves et al. 2013; Querouil et al.
2007), with a central geographical position between the archipelago of the Azores (at 900 km distance) and the Canaries (at 400 km). This volcanic archipelago is composed by the main island of Madeira and the smaller island of Porto Santo (~40 km Northeast), and by two uninhabited sub-archipelagos, the Desertas (~20 km Southeast) and the Selvagens (300 km South). Madeira is the largest island of the group with an area of 741 km2 (57x22 km), a coastline of 157 km and a
mountain ridge reaching 1862 meters altitude. The Madeira EEZ has approximately 446 000 km2and features mainly abyssal oceanic waters (Alves et
8
Figure 1.1- Map of the northeast Atlantic showing the location of the archipelago of
Madeira and its Exclusive Economic Zone (EEZ).
The waters of Madeira archipelago are influenced by the Portuguese Current, the Azores Current, and the Canary Current, all part of the eastern anticyclonic North Atlantic subtropical gyre (Sala et al. 2013). The junction of the eastward division
of the Azores Current with the Canary Current up north, and around the archipelago of Madeira (New et al. 2001) is responsible for most of its seasonal and
inter-annual complex oceanographic patterns, resulting in high salinity, high temperature and low-nutrient regime waters (Johnson & Stevens 2000).
Chapter 1 - General Introduction
9
Despite the wide area that comprises the Madeira EEZ, data collected in this study reports only to the inshore area that surrounds the three islands of Madeira, Porto Santo and Desertas, covering a total of 4 818 km2 up to 20 km offshore (Figure1.2).
This area is characterized by a thin continental shelf, with steep submarine canyons and deep waters (Geldmacher et al. 2000) (Figure 1.3).
Figure 1.2- Map showing the Madeira EEZ and the inshore area where data was collected.
10
Madeira depends almost exclusively on tourism as it main source of income and over a million tourists visits the island every year (DRE 2013). Until a decade ago tourists visited Madeira for the year-round warm temperatures and exploring the mountain walks through the Laurel forests (UNESCO World Natural Heritage). In the last years the demand for marine touristic activities rapidly increased, and the whale-watching industry has grown in the same proportion. Marine tourism operators began doing sightseeing trips where they also advertised watching. Nowadays, there are companies exclusively dedicated to whale-watching, including 'swimming with dolphins' activities (Vera 2012). After a 10 years period of voluntary viewing guidelines developed by the Madeira Whale Museum (Freitas et al. 2004), in 2013 the whale-watching activity became legally
regulated by the Dec.-Leg. Regional 15/2013/M. In this legislation, the 'swimming with dolphins' activity becomes restricted to two dolphins species only: Atlantic spotted dolphin (Stenella Frontalis) and the short-beak common dolphin
(Delphinus delphis), thus banning the tourists of any underwater activity with other
cetacean species, including the bottlenose dolphin.
At present, there are 29 species of cetaceans reported for Madeira archipelago from which 25 are confirmed records (Freitas et al. 2012).
1.5 Thesis main objectives and rationale
Bottlenose dolphins are one of the most abundant species in Madeira archipelago (Freitas et al. 2006; Freitas et al. 2004). Despite this, scientific knowledge for this
species in Madeira is insufficient. Ecological studies towards this species started only during the last decade, with work developed by the Madeira Whale Museum, and results are presented in this study.
Chapter 1 - General Introduction
11
Social structure is known to affect ecology, genetics, population biology, and thus issues of conservation and management (Sutherland 1998). For that reason, in order to gain a better understanding of the biology of the studied animals, as well as of the effects of human activities on them, we need to study the social system of a population (Whitehead & Van Parijs 2010). Following, patterns of residency and site fidelity are often indicative of the ecology of a population; evidence of repeated sightings in the same area can be used to establish core areas or ranges of individuals and point out the importance of a habitat. Furthermore, the study of life history parameters is of fundamental importance to understanding the dynamics of animal populations. Demographic processes, such as fluctuations in survival and reproduction, are the ultimate cause of population change (Gaillard et al. 1998). Finally, effective conservation of wild populations requires an
understanding of the relationship between populations and their habitats, and for that the first step is to determine which habitats are used with higher frequency (Cañadas et al. 2005).
This work represents a important contribution to the knowledge and conservation of bottlenose dolphins inhabiting Madeira archipelago waters. Prior to this, no systematic study has examined the abundance, social structure, patterns of site-fidelity or habitat use of bottlenose dolphins in Madeira archipelago. Bottlenose dolphins are apex predators, and determining the status of this population may prove to be a useful indicator of the health and stability of the habitat they live in. In addition, bottlenose dolphins that use the waters of the archipelago are subject to multiple human impacts from which the whale-watching activity stands as the major potential threat. Finally, bottlenose dolphins in Madeira are not genetically and/or geographically isolated from the population of neighbouring archipelago of Azores, and thus they are part of a single population, from a conservation standpoint (Querouil et al. 2007). As local threats may impact the entire
12
The results presented here will provide baseline data and insight on the current significance of the population of bottlenose dolphins utilising the archipelago of Madeira. This information will support conservation managers in the management and protection of this population.
1.6 Chapters overview
Chapter 2 aims to examine 11 years of individual photo-identification data of the
bottlenose dolphin population that occurs in Madeira archipelago in order to investigate its social structure. This was achieved by analysing the type of association indices between pairs of identified individuals, the patterns of affiliation between individual dolphins and the probabilities of associations between individuals, over time.
In Chapter 3, following the research of the previous chapter, data from individual photo-identification is used to determine group dynamics, to assess the level of residency and site fidelity, and to investigate movements patterns within and out the study area.
Chapter 4 aims to estimate apparent survival and seasonal abundance of the bottlenose dolphin population in Madeira archipelago, taking into account heterogeneity of capture probabilities by applying distinctive approaches on capture-recapture records of naturally marked individuals. The estimated aimed to resident dolphins and to the super population that used the area during the study period.
Chapter 1 - General Introduction
13
References
Alves F, Querouil S, Dinis A, Nicolau C, Ribeiro C, Freitas L, Kaufmann M, Fortuna C (2013). Population structure of short-finned pilot whales in the oceanic archipelago of Madeira based on photo-identification and genetic analyses: implications for conservation. Aquatic Conservation: Marine and freshwater ecosystems, 5: 758-776.
Ballance LT (2009). Cetacean Ecology. In: W.F. Perrin, B. Würsig, J.G.M. Thewissen (Eds.), Encyclopedia of marine mammals, second ed. Academic Press, Amsterdam.
Barros NB, Odell DK (1990). Food habits of bottlenose dolphins in the Southeastern United States. In: S. Leatherwood and R. R. Reeves (Eds.).The Bottlenose Dolphin. Academic Press, Inc. London.
Cabral MJ (coord), Almeida J, Almeida PR, Dellinger T, Almeida NF, Oliveira ME, Palmeirim JM, Queiroz AL, Rogado L, Santos-Reis M, editors (2005). Livro Vermelho dos Vertebrados de Portugal. Instituto de Conservação da Natureza, Lisboa.
Caldeira RMA, Groom S, Miller P, Pilgrim D, Nezlin NP (2002). Sea-surface signatures of the island mass effect phenomena around Madeira Island, Northeast Atlantic. Remote Sensing of the Environment 80: 336-360.
Cañadas A (2006). Towards the conservation of dolphins in the Alborán Sea. PhD thesis, University Autónoma de Madrid.
Cañadas A, Sagarminaga R, de Stephanis R, Urquiola E, Hammond PS (2005). Habitat preference modelling as a conservation tool: Proposals for marine protected areas for cetaceans in southern Spanish waters. Aquatic Conservation:
14
Connor RC, Mann J, Tyack PL, Whitehead H. (2000). The Social lives of Whales and Dolphins. In: J. Mann, R. C. Connor, P. L. Tyack, and H. Whitehead (Eds.), Cetacean societies: field studies of dolphins and whales. The University of Chicago Press, Chicago and London.
Corketon P (2009). Captivity. In: W.F. Perrin, B. Würsig, J.G.M. Thewissen (Eds.), Encyclopedia of marine mammals, second ed. Academic Press, Amsterdam.
Croll DA, Tershy BR, Hewitt RP, Demer DA, Fiedler PC, Smith SE, Armstrong W, Popp JM, Kiekhefer T, Lopez VR, Urban J, Gendron D (1998). An integrated approach to the foraging ecology of marine birds and mammals. Deep-Sea Research II, 45: 1353-1371.
Curry BE (1997). Phylogenetic relationships among bottlenose dolphins (genus
Tursiops) in a worldwide context. PhD thesis, Texas A&M University.
Direcção Regional de Estatística-DRE (2013). Statistical Yearbook of Região Autónoma da Madeira. Funchal, Potugal.
Duffield DA, RS Wells (2002). The molecular profile of a resident community of bottlenose dolphins, Tursiops truncatus. In: C.J. Pfeiffer (Ed.) Molecular and Cell
Biology of Marine Mammals. Krieger Publishing Company, Melbourne, FL.
Duffield DA, Ridgway SH, Cornell LH (1983). Hematology distinguishes coastal and offshore forms of dolphins (Tursiops). Canadian Journal of Zoology, 61: 930-933.
European Union Habitats Directive (1992). http://ec.europa.eu/environment/nature/ legislation/habitatsdirective/index_en.htm
Chapter 1 - General Introduction
15
Freitas L, Dinis A, Alves F (2006). Occurrence and distribution of cetaceans off Madeira archipelago (Portugal). Proceeding of the 20th Conference of the European Cetacean Society, 2-7 April, Gdynia, Poland.
Freitas L, Dinis A, Alves F, Nóbrega F (2004). Cetáceos no Arquipélago da Madeira. Museu da Baleia, Machico, Madeira, Portugal.
Gaillard JM, Festa-Bianchet M, Yoccoz NG (1998). Population dynamics of large herbivores: variable recruitment with constant adult survival. Trends in Ecology and Evolution, 13: 58–63.
Geldmacher J, Van Den Bogaard P, Hoernle K, Schmincke HU (2000). The 40Ar/39Ar age dating of the Madeira Archipelago and hotspot track (eastern North Atlantic). Geochemistry, Geophysics, Geosystems 1: 1999GC000018.
Gunter G (1951). Consumption of shrimp by the Bottlenosed Dolphin. Journal of Mammalogy 32:465–466.
Hersh SL, Duffield DA (1990). Distinction between northwest Atlantic offshore and coastal bottlenose dolphins based on hemoglobin profile and morphometry. In: S. Leatherwood and R. R. Reeves(Eds.). The Bottlenose Dolphin. Academic Press, Inc. London.
Hoyt E (2011). Marine Protected Areas for Whales, Dolphins and Porpoises: a World Handbook for Cetacean Habitat Conservation and Planning, second ed. Earthscan, New York.
Ingram SN, Rogan E (2002). Identifying critical areas and habitat preferences of bottlenose dolphins (Tursiops truncatus). Marine Ecology Progress Series, 244:
16
IPCC (2001). Climate Chang: Impacts, Adaptation and Vulnerability, Cambridge University Press
Johnson J, Stevens I (2000). A fine resolution model of the eastern North Atlantic between the Azores, the Canary Islands and the Gibraltar Strait. Deep-Sea Research I, 47: 875-899.
Kenney RD (1990). Bottlenose dolphins off the northeastern United States. In: S. Leatherwood and R. R. Reeves(Eds.) The Bottlenose Dolphin. Academic Press, Inc. London. pp: 369-386.
Learmonth JA, MacLeod CD, Santos MB, Pierce GJ, Crick HQP, Robinson RA (2006) Potential effects of climate change on marine mammals. Oceanography and Marine Biology: An Annual Review, 44: 431-464.
LeDuc RG, Perrin WF, Dizon AE (1999). Phylogenetic relationships among the delphinid cetaceans based on full cytochrome b sequences. Marine Mammal Science, 15: 619-648.
Lettink M, Armstrong DP (2003). An introduction to using mark-recapture analysis for monitoring threatened species. Department of Conservation Technical Series 28A: 5-32.
Mann, J, Connor R, Barre L, Heithaus M (2000). Female reproductive success in botlenose dolphins (Tursiops sp.): life history, habitat, provisioning, and group-size effects. Behavioral Ecology, 11(2): 210-219.
Mead JG, Potter CW (1995). Recognizing two populations of the bottlenose dolphin (Tursiops truncatus) off the Atlantic coast of North America: morphologic and
Chapter 1 - General Introduction
17
Mead JG, Potter CW (1990). Natural history of bottlenose dolphins along the central Atlantic coast of the United States. In: In S. Leatherwood, R.R. Reeves (Eds), The bottlenose dolphin. Academic Press, San Diego.
Natoli A, Peddemors VM, Hoelzel AR (2004) Population structure and speciation in the genus Tursiops based on microsatellite and mitochondrial DNA analyses. Journal of Evolutionary Biology, 17, 363–375.
New AL, Jia Y, Coulibaly M, Dengg J (2001). On the role of the Azores Current in the ventilation of the North Atlantic Ocean. Progress in Oceanography 48: 163-194.
Norris KS, Dohl TP (1980). The behavior of the hawaiian spinner porpoise, Stenella longirostris. Fishery Bulletin 77: 821-849.
Owen ECG, Hofmann S, Wells RS (2002). Ranging and social association patterns of paired and unpaired adult male bottlenose dolphins, Tursiops truncatus, in
Sarasota, Florida, provide no evidence for alternative male strategies. Canadian Journal of Zoology. 80:2072-2089.
Parsons KM, Durban JW, Claridge DE, Herzing DL, Balcomb KC, Noble LR (2006). Population genetic structure of coastal bottlenose dolphins (Tursiops truncatus) in
the northern Bahamas. Marine Mammal Science 22: 276-298.
Quérouil S, Silva MA, Freitas L, Prieto R, Magalhães S, Dinis A, Alves F, Matos JA, Mendonça D, Hammond P, Santos RS (2007). High gene flow in oceanic bottlenose dolphins (Tursiops truncatus) of the North Atlantic. Conservation Genetics, 8:
1405-1419.
18
Rogers CA, Brunnick BJ, Herzing DL, Baldwin JD (2004). The social structure of bottlenose dolphins, Tursiops truncatus, in the Bahamas. Marine Mammal Science
20:688-708.
Ross GJB (1977) The taxonomy of bottlenosed dolphins Tursiops species in South
African waters, with notes on their biology. Ann. Cape Prov. Mus. Nat. Hist. 11,
135-194.
Sala I, Caldeira RMA, Estrada-Allis SN, Froufe E, Couvelard X (2013). Lagrangian transport pathways in the northeast Atlantic and their environmental impact.
Limnology and Oceanography: Fluids and Environments 3: 40-60.
Schroeder PJ (1990). Breeding bottlenose dolphins in captivity. In S. Leatherwood, R.R. Reeves (Eds), The bottlenose dolphin. Academic Press, San Diego.
Schroeder PJ, Keller KV (1990) Artificial insemination of bottlenose dolphins. In S. Leatherwood, R.R. Reeves (Eds), The bottlenose dolphin. Academic Press, San Diego.
Scott MD, Chivers SJ (1990). Distribution and herd structure of bottlenose dolphins in the eastern tropical Pacific Ocean. In S. Leatherwood, R.R. Reeves (Eds) The Bottlenose Dolphin. Academic Press, San Diego, CA.
Scott MD, Wells RS, Irvine AB (1990). A long-term study of bottlenose dolphins on the west coast of Florida. In S. Leatherwood, R.R. Reeves (Eds), The bottlenose dolphin. Academic Press, San Diego.
Shane SH, Wells RS, Wursig B (1986) Ecology behavior, and social organization of the bottlenose dolphin: a review. Marine Mammal Science, 2: 34-63.
Chapter 1 - General Introduction
19
Smolker RA, Richards AE, Connor RC, Pepper JW (1992). Sex differences in patterns of associations among Indian Ocean bottlenose dolphins. Behaviour, 123,
38-69.
Sutherland WJ (1998). The importance of behavioural studies in conservation biology. Animal behaviour, 56: 801-809.
Tomczak M, Godfrey JS (1994). Regional Oceanography: an introduction. Pergamon, London.
Torres LG, Rosel PE, D’Agrosa C, Read AJ (2003). Improving management of overlapping bottlenose dolphin ecotypes through spatial analysis and genetics.
Marine Mammal Science, 19: 502-514.
Vera AH (2012). Quantification of the exposure of cetacean individuals to
whale-watching vessels through the photo‐identification technique in the South coast of Madeira Island (Portugal). Research Study for the Environmental Sciences Degree, Faculty of Biology, University of Murcia, Spain.
Wells RS (2003). Dolphin social complexity: lessons from long-term study and life history. In: F.B.M. de Waal and P.L. Tyack (Eds.) Animal social complexity: intelligence, culture, and individualized societies. Harvard University Press, Cambridge, MA.
Wells RS, Scott MD (2009). Common Bottlenose dolphin (Tursiops trucatus). In:
Perrin, W.F., Würsig, B., Thewissen, J.G.M. (Eds.), Encyclopedia of marine mammals, second ed. Academic Press, Amsterdam, pp. 361-364.
Wells RS, Scott MD (1999). Bottlenose dolphin Tursiops truncatus (Montagu, 1821). In: S.H. Ridgway and R. Harrison (Eds.), Handbook of Marine Mammals, Vol. 6, the
20
Wells RS, Scott MD, Irvine AB (1987). The social structure of free-ranging bottlenose dolphins. In: H Genoways (Ed.) Current Mammalogy, Plenum Press: New York.
Whitehead H; Van Parijs S (2010). Studying marine mammal social systems. In: I. Boyd, W.D. Bowen, S.J. Iverson (Eds.) Marine Mammal Ecology and Conservation: A Handbook of Techniques. Oxford University Press, New York.
Wilson B, Thompson PM, Hammond, PS (1997) Habitat use by bottlenose dolphins: seasonal distribution and stratified movement patterns in the Moray Firth, Scotland. Journal of Applied Ecology, 34: 1365-1374.
Wilson B, Thompson P, Hammond PS (1993). An examination of the social structure of a resident group of bottlenose dolphins (Tursiops truncatus) in the
21
CHAPTER
2
P
OPULATION STRUCTURE OF BOTTLENOSE
DOLPHINS IN
M
ADEIRA
A
RCHIPELAGO
2.1 INTRODUCTION
22
Querouil et al. (2007) suggest that there is a single population of bottlenose
dolphins in the pelagic waters of the North-East Atlantic, and that this population is not significantly differentiated from the pelagic population of the North-West Atlantic. Madeira archipelago is one of the most isolated oceanic habitats in Northeast Atlantic; as such, one could expect to find a greater differentiation in the population structure. However, dolphins are capable of travelling large distances in short periods (Wells et al. 1999), making it possible that the lack of geographic
structuring is explained by large home ranges and/or high dispersal in the study area (Quérouil et al. 2007). In terms of genetic structure the bottlenose dolphins in
Madeira seem to be part of a bigger Atlantic pelagic population with high levels of gene flow (Quérouil et al. 2007).
Strong site fidelity, with the presence of both resident groups and resource specialization, as a consequence of different social and behavioural strategies, could be some two of the leading factors for the genetic structure (Hoelzel et al.
1998). Consequently, the social structure is sensitive to the genetic population structure (Whitehead & Van Parijs 2010).
Associations are often defined using spatial-temporal groups, that is, animals are associated if they are members of the same group (Whitehead 2008). The observations of associations or groups are then used to calculate relationship measures such as interaction rates and association indices. These can then be synthesized into models of social structure using ordinations, cluster analyses, network analyses, lagged association rates, and other uni- and multivariate techniques (Whitehead & Van Parijs 2010).
Previous studies on bottlenose dolphins describe them as living in a so-called fission-fusion community, individuals associate in small groups that change in composition, often on a daily or even hourly basis (Wells et al. 1987, Würsig &
Würsig 1977). Unlike animals that live in groups of constant composition, social, relationships on fission-fusion society may depend strongly on 'who is there and who is not' (Connor et al. 2000). Most information about bottlenose dolphin social
organization comes from three long-term studies carried out in Sarasota Bay Florida (Wells 1991), Shark Bay (Western Australia) (Smolker et al. 1992) and
Chapter 2 - Population structure
23
gender-related bonds that could be due to differences in predation risk, availability or use of resources and mating (Connor et al. 2000). The same authors point that
our understanding of bottlenose dolphin social relationships and its ranging patterns provides the establishment of population units that can support management. In Florida, patterns of social association facilitate the partitioning of continuously distributed resident dolphins into geographically management units (Wells 1986). The frequency of associations between individuals that inhabit overlapping or adjacent ranges can help define population units. Given this information is geo-referenced, the definition of management units makes it possible to relate specific threats to a particular population community, allowing the assessment of potential impacts and mitigation efforts (Connor et al. 2000).
Some of the pressures bottlenose dolphins faces in Madeira are fisheries, costal development and whale-watching; this latter may be the major direct threat in the south of Madeira Island.
The aim of this study was to examine individual photo-identification data of the bottlenose dolphin population that occur in Madeira archipelago in order to investigate the species social structure. This was achieved by analysing the type of association indices between pairs of identified individuals; the patterns of affiliation between individual dolphins and the probabilities of association between individuals over time. Information on social structure is important for management and conservation plans for this species in the study area, as the potential differences in its social units may require distinctive management strategies.
2.2 Methods
2.2.1Study area
The Madeira archipelago is located in the Northeast Atlantic (32ºN; 17ºW) at app.
24
Santo are inhabited, whereas Desertas and Selvagens are not. Additionally the two latter are natural reserves (Caldeira & Sangrá 2012). These oceanic volcanic islands have a reduced continental shelf which results in deep waters and submarine canyons just a few miles offshore (Geldmacher et al. 2000). Depths can
reach 3000m.
Figure 2.1- Map highlighting Madeira archipelago and its islands, located in the Northeast Atlantic. A gradient of bathymetry is show on a scale of blue.
Chapter 2 - Population structure
25
Figure 2.2 – Map of the main study area with the division of the eight sectors used in this study: S1- Madeira North; S2- Madeira West; S3- Madeira South; S4- Desertas East; S5- Desertas West; S6- Channel; S7- Porto Santo South and S8- Porto Santo North.
2.2.2 Photo-identification surveys
Photographs were taken on year-round systematic and non-systematic research boat surveys, as well as from whale-watching boats.
One hundred and seventeen systematic surveys were carried out following predetermined line-transects covering the eight sectors. Surveys were carried out between 2001-2002 and 2004, and from 2007 to 2012. In 2003 no data was collected. Two vessels were used: the 12 m vessel Calcamar (in 2001 and 2002; at
11 km/h), and the 18 m research yacht Ziphius (from 2004 to 2012; cruise speed
26
(Thomas et al. 2010) to ensure, as much as possible that equal geographic
coverage was obtained. Data and track courses were recorded on a laptop connected to a GPS, using the data logging software Logger 2000 (developed by the International Fund for Animal Welfare). Weather, effort, and sighting information (GPS position, initial time, best group size estimation and group composition) were recorded. Effort was conducted during daylight hours and only with Beaufort Sea state ≤3. In the systematic surveys, time sometimes constrained the data collection of individual photographs of the entire group; as such the photographic coverage and identification of all the individuals present in the group was not always possible.
One hundred and eighty four non-systematic surveys were carried out between 2004 and 2012. Surveys were conducted during daylight hours and sea state ≤3
Beaufort Sea using a 6.5 m rigid inflatable boat Roaz (cruise speed 15-25 km/h)
and the 18 m research yacht Ziphius (cruise speed 12 km/h). Two to four
observers searched the area up to the horizon, assisted with 7 x 50 binoculars, at an eye-height of app. 2 m. No predefined transect were followed. A daily assessment was made to define which area survey; this was done based on weather conditions, tips of observers on land; tips from the whale-watching boats and areas expected to have a higher presence of dolphins. The mean duration of surveys was 6h16 and the searching effort was not equally distributed throughout the different areas.
When a group of dolphins was encountered, data on the sighting was collected. Following that, the boat slowly approached the group and an attempt was made to obtain several photographs to identify each individual. In this study, the term
‘group’ was used as the sampling unit and defined as all dolphins sighted within a 100 m radius of each other (Wells et al. 1987). Dolphins were classified into three
categories - adults, subadults and calves according to their size, colour, and behaviour. The adult class corresponded to large and robust animals. Calves were identified by their small body size and/or permanent association with an adult (Mann et al. 2000). Individuals whose body size was smaller than that of adults
and that were independent from an adult animal were considered subadults (Wells
Chapter 2 - Population structure
27
equipped with Nikkor zoom lenses ranging between 70-400 mm in both systematic and random surveys.
Digital photographs from different opportunistic platforms were analysed. These images were obtained from 2003 to 2012 in the south coast of Madeira island (sector 3; Figure 2.2). The opportunistic platforms operate year-round, with 1-3 daily trips, with no specific target species. The photographs were taken whenever bottlenose dolphins were sighted by trained observers onboard, as well by experienced skippers.
2.2.3 Photo-identification processing
A photo-identification (photo-id) catalogue was compiled. A dataset of capture histories was created using individual information taken from the photographs. (Würsig & Jefferson 1990). An individual identification within an encounter was defined as a capture.
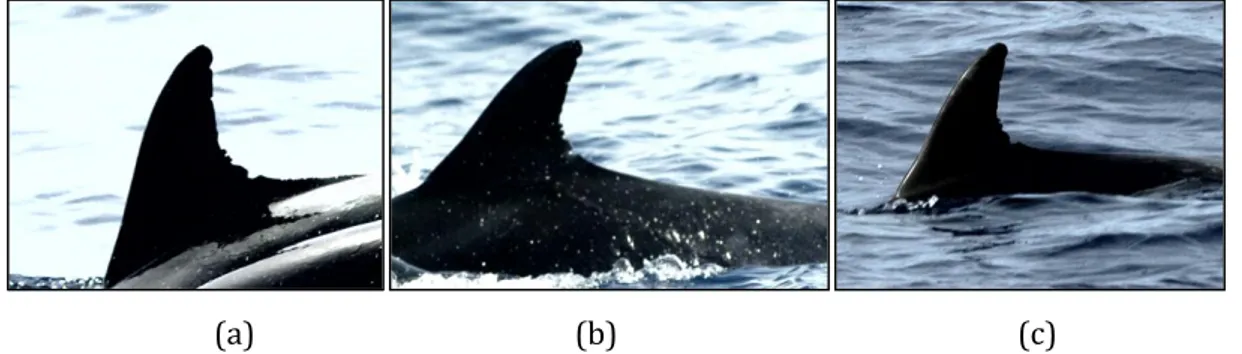
Photographs were graded as 'good', 'fair' or 'bad' (Figure 2.3), according to their level of focus, contrast, exposure, the angle and size of the dorsal fin in the frame. Additionally, the distinctiveness of each frame was graded as 'very distinct', 'distinct', slightly distinct' or 'unmarked' (Figure 2.4). Only 'good' quality, 'very distinct' and 'distinct' photographs were used in this study in order to increase the certainty of matches. Calves were excluded from the analysis.
(a) (b) (c)
28
(a) (b) (c) (d)
Figure 2.4 – Examples of (a) very distinctive, (b) distinctive, (c) slightly distinctive and (d) unmarked individuals.
All photo processing was done using Darwin 2.0 © (Eckerd College Dolphin Research Group), including cropping the dorsal fin area and adjusting light and contrast. Then a contour was done to the trail edge, which is identifiable from both sides (Auger-Méthé & Whitehead 2007), and the program compared that fin to all others stored in the database searching for a match. Only the contour was used to compare the fins, secondary features like fin shape or scars were only used to confirm a match by naked eye. Whenever a match was found, confirmation by the researcher was made, and the same identification number from the individual stored in the database was assigned. If the program did not find a match, the researcher would make another attempt of comparison by eye, with all the individuals of the catalogue, using the number of nicks of the dorsal fin. If a match still was not found, a new identification number was attributed to that individual and it added to the catalogue.
2.2.4 Association patterns
Chapter 2 - Population structure
29
2.2.4.1 Cluster analysis
Cluster analysis can be a useful way to classify and visually display relationships among individuals by means of association indices (Whitehead 2008). A hierarchical cluster analysis was obtained from the association data and it was used to illustrate the relationships between dolphins. The cophenetic correlation coefficient (CCC), was used to determine which type of cluster analysis was more suitable to the data. The CCC is the correlation between the actual indices of association and the levels of clustering shown in the diagram. It indicates the effectiveness of the analysis in order to separate potential dendrograms from those that are truly representative of complex social structure.
The average-linkage method using simple ratio (SR) (Equation 2.1) association indices was elected as the most appropriate for this data when compared to single-, complete-single-, and Ward’s- linkage (not shown). It provided the best CCC value, as
≥0.8 is considered to be a good fit (Bridge 1993).
SR = X Equation 2.1
X Ya Yb
where:
X = the number of times both individual a and b were seen together in the same
group,
Ya = the number of times individual a was seen, Yb = the number of times individual b was seen.
The index most commonly used in the analysis of social structure in cetacean populations is the Half Weight Index (HWI) (Wells et al. 1987; Smolker et al. 1992;
Slooten et al. 1993; Bedjer et al. 1998; Maze-Foley & Würsig 2002). This is mainly