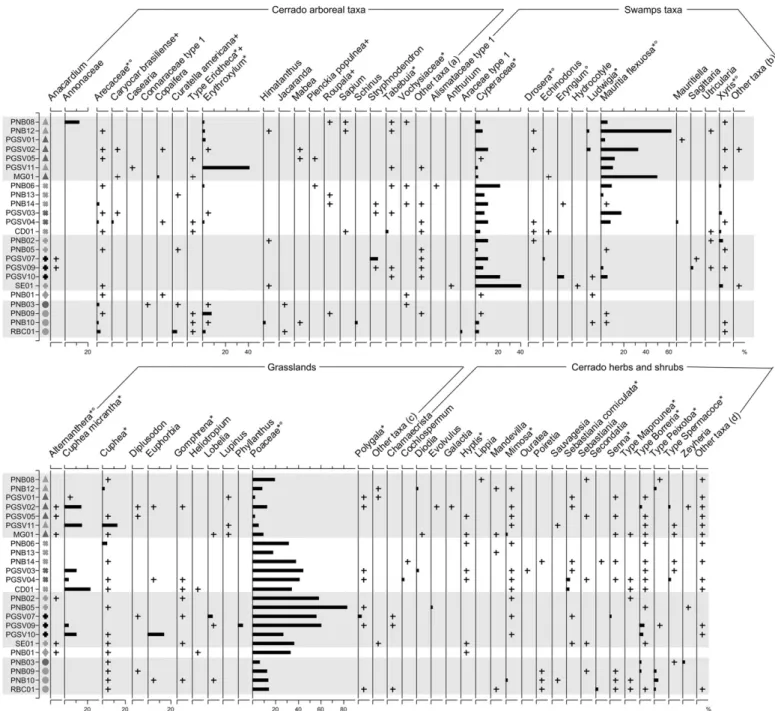
Modern pollen spectra of the Cerrado vegetation in two national parks of
Central Brazil, and implications for interpreting fossil pollen records
Raquel Franco Cassino
a,⁎
, Caroline Thaís Martinho
b, Silane A.F. da Silva Caminha
c aInstituto de Geociências, Universidade de Brasília, Campus Universitário Darcy Ribeiro, CEP 70910-900 Brasília, DF, BrazilbInstituto do Petróleo e dos Recursos Naturais, Pontifícia Universidade Católica do Rio Grande do Sul, Av. Ipiranga, 6681, prédio 96J, CEP 90619-900 Porto Alegre, RS, Brazil cPrograma de Pós Graduação em Geociências, Instituto de Ciências Exatas e da Terra, Universidade Federal de Mato Grosso, CEP 78060-900 Cuiabá, MT, Brazil
a b s t r a c t
a r t i c l e
i n f o
Article history: Received 17 April 2014
Received in revised form 8 September 2015 Accepted 20 September 2015
Available online 26 September 2015
Keywords: Cerrado
Modern pollen spectra Palm swamp Central Brazil
Twenty four surface samples were collected for palynological analysis from different environments in theCerrado biome, which extends over a vast area in Central Brazil. These samples were used to investigate the relationship between vegetation and pollen spectra in theCerradoand, thereby, contribute to a more precise interpretation of fossil pollen records from this region, particularly those collected on palm swamps. Pollen grains from the phytophysiognomy that surrounds the palm swamp generally occur in low percentages in surface samples, whereas local plants are very abundant in the pollen spectra. Although local taxa tend to predominate, two as-pects of the landscape may be reconstructed from the pollen spectra using numerical methods: the local environ-ment of the deposition site and the surrounding regional vegetation. Using PCA and dissimilarity coefficient analysis, a group of seventeen taxa and a group of fourteen arboreal taxa are proposed as those that provide im-proved results when investigating the local environment and regional vegetation, respectively. Because herba-ceous taxa are very abundant in the palm swamps, an analysis of the content of arboreal taxa in the pollen spectra is more appropriate for reconstructing the openness of the regional vegetation.
© 2015 Elsevier B.V. All rights reserved.
1. Introduction
TheCerradois the second largest biome in Brazil, and it covers over 2,000,000 km2of the central part of the country (Fig. 1A). TheCerrado
vegetation is broadly classified as moist savanna, and it encloses a great diversity offlora (Furley, 1999; Sano et al., 2008). Indeed, this
Brazilian savanna is a mosaic of several phytophysiognomies character-ized by peculiar vegetation structures andfloras; based primarily on the degree of arboreal cover, eleven principal phytophysiognomies have been recognized ranging from forests to grasslands (Ribeiro and Walter, 2008). The most typical are: theCerradostricto sensu, the Cerradão, the gallery forests, theCampo Sujoand theCampo Limpo. TheCerradostricto sensu is a typical savanna physiognomy with small and gnarled trees, large shrubs and a prominent herbaceous stratum. TheCerradãohas a dense cover of sclerophyllous trees that form a con-tinuous canopy over the herbaceous-shrub stratum. TheCamposare grasslands characterized by few trees and shrubs (Campo Sujo) or by the absence of trees (Campo Limpo). The gallery forests thrive alongside the small rivers of the Brazilian plateau and contain taller trees with an important arboreal cover.
These different phytophysiognomies coexist in the same geographic space, and their distribution is due to a complex interaction of several factors, such as climate, soil characteristics, water-table depth,fire
inci-dence and local history (Henriques, 2005).
Although theCerradoand its vegetation were largely affected by the climate changes of the late Quaternary (c.f.Salgado-Labouriau, 1997; Ledru, 2002; Meyer et al., 2014), there are few records and little knowl-edge of the history of these changes. The majority of the available infor-mation comes from palynological studies that have been performed in lakes and in the palm swamps of theCerradocore area (Ledru, 1993; Behling, 1995, 2002, 2003; Ferraz-Vicentini and Salgado-Labouriau, 1996; Parizzi et al., 1998; Barberi et al., 2000; Horák, 2009; Lorente et al., 2010; Raczka et al., 2012; Cassino and Meyer, 2013).
The palm swamps, known locally asVeredas, are a distinctive feature of theCerradolandscape: they develop in marshy areas containing stream headwaters, and they are characterized by a typicalflora
domi-nated by theburitipalm (Mauritiaflexuosa). The palm swamps, with the accumulation of peat in their central marshy zone, constitute a par-ticularly favorable environment for the preservation of pollen grains and other palynomorphs. They are common features on allCerrado's plateaus and plains and thus contain valuable records of theCerrado Quaternary history that remain underexplored. There are, however, several difficulties in interpreting the fossil pollen records collected in the palm swamps. Firstly, as in other biomes, the production and disper-sion of pollen are variable between species, so the percentage of pollen
Review of Palaeobotany and Palynology 223 (2015) 71–86
⁎ Corresponding author at: Departamento de Geologia, Universidade Federal de Ouro Preto, Campus Morro do Cruzeiro, CEP 35400-000 Ouro Preto, MG, Brazil. Tel.: +55 3135591881.
E-mail address:[email protected](R. Franco Cassino).
http://dx.doi.org/10.1016/j.revpalbo.2015.09.002 0034-6667/© 2015 Elsevier B.V. All rights reserved.
Contents lists available atScienceDirect
Review of Palaeobotany and Palynology
deposited is not directly related to the abundance of the species in the vegetation. Species that are wind pollinated tend to produce and dis-perse more pollen and so are generally over-represented in pollen spec-tra. In theCerradovegetation, herbaceous species of Poaceae and Cyperaceae family are commonly anemophilous, while other herba-ceous and arboreal species are usually entomophilous or zoophilous, the most common exception beingPodocarpus, the only gymnosperm genera occurring in theCerradobiome.
Other difficulties in the interpretation of palm swamp pollen records arise from the complexity of theCerradovegetation and from the partic-ular nature and vegetation of these sedimentary sites. The main diffi
cul-ty is to interpret from the pollen record which phytophysiognomy was present in the paleovegetation. As mentioned earlier, the different phytophysiognomies have different degrees of arboreal cover, but in the pollen spectra, the percentage and concentration of arboreal and herbaceous taxa are also influenced by the local vegetation of the palm swamp. In summary, with respect to past climate reconstruction, the correct interpretation of the palm swamp pollen records relies on the ability to accurately evaluate how local and regional vegetations
are represented in the pollen spectra, considering the differential pro-duction and dispersion of pollen of the different taxa.
One mechanism to evaluate this is through the analysis of modern pollen spectra extracted from surface samples. The study of surface samples for comparison with fossil pollen spectra has been used, in other regions, by several authors (i.e.Stutz and Pietro, 2003; Weng et al., 2004; Gosling et al., 2009; Burn et al., 2010; Ortuño et al., 2011) to generate modern analogs for the fossil record and to understand the relationship between vegetation characteristics and pollen spectra. Regarding theCerradovegetation, thefirst attempt to study the pollen
rain was conducted bySalgado-Labouriau (1973)who analyzed the pol-len rain collected on three polpol-len traps placed amidst a typicalCerrado in Goiás State for three years. A large predominance of Poaceae, that represented over 70% of the total pollen spectra, was observed in the samples; the second most representative family was Fabaceae, that accounted only for 3.2%. This work was focused on the variability of pol-len precipitation throughout the year and indicated May as the month with more abundant pollen precipitation whereas September was the one with the more diverse pollen spectra.Ferraz-Vicentini (1993),
which presented the palynological study of a core collected in a palm swamp in Cromínia (southern Goiás State), studied ten surface samples, four of them collected on the margin of a lake situated upstream of the palm swamp and four collected in a gallery forest downstream of the palm swamp. The area around the palm swamp was occupied by a farm and the originalCerradovegetation had been replaced by planta-tions. The other two samples analyzed byFerraz-Vicentini (1993)
were from a palm swamp of a park situated near the federal capital, Brasília (Águas EmendadasBiological Reserve);Barberi et al. (2000) fur-ther presented anofur-ther two surface samples collected in this same palm swamp. In the pollen spectra extracted from these samples, Poaceae was the most abundant taxon in all environments, with, however, higher percentage in the palm swamp and lake samples (around 60%) than in the gallery forest samples (40%). Forest trees were abundant and diversified in the gallery forest samples but rare in the other ones,
whereas typicalCerradotrees were rare or absent in all environments; Cyperaceae, Melastomataceae andMauritiaflexuosawere important components of the pollen spectra of all samples. Ferraz-Vicentini (1999)presented data from other four surface samples collected in the margins and in the water/sediment interface of a lake inChapada dos ViadeirosPark, northern Goiás State. Poaceae and Cyperaceae to-gether represented 70 to 80% of the pollen spectra in all samples; other important taxa were Melastomataceae, Myrtaceae,Byrsonima and Eriocaulaceae. Finally,Ledru (2002)presented data from modern pollen spectra of theCerradovegetation obtained from surface samples collected in different types ofCerradoin Distrito Federal, Mato Grosso and São Paulo States. TheCerradopollen spectra were compared with those from Araucaria and semi-deciduous forest, allowing the designa-tion ofCerradoindicators pollen types:ByrsonimaandDidymopanax (equalSchefflera), over-represented in the pollen spectra, andCaryocar andQualea, that, although exclusive of theCerradosamples, were under-represented considering its abundance in the vegetation. Poaceae pollen was abundant in the samples, with significant variations between phytophysiognomies: around 20% in theCerradãosamples and over 50% in the more openCerrado(Campo Cerrado).
Pollen spectra from surface samples collected among theCerrado vegetation or from pollen traps, such as those presented byLedru (2002)orSalgado-Labouriau (1973), are very useful to learn about the general characteristics of the pollen rain, but they are not directly com-parable with fossil pollen spectra. Fossil pollen records are necessarily collected in specific depositional sites that harbor specific kinds of
veg-etation that have great influence in the composition of the pollen spec-tra. For cores collected on palm swamps, local taxa such as Cyperaceae and Mauritia flexuosa, among others, are present and abundant, influencing the percentage of all the other taxa, as showed by Ferraz-Vicentini (1993)andBarberi et al. (2000), resulting in pollen spectra different from those found in samples that were collected directly on theCerradosoils. Therefore, when the study of pollen spectra aims to support the interpretation of fossil samples, it is more appropriate to use surface samples collected in depositional environments that present the same conditions in which the fossil samples were deposited. Despite the mentioned works ofFerraz-Vicentini (1993, 1999)andBarberi et al. (2000), which present only a few surface samples collected on undis-turbed areas, to date, no systematic studies of surface samples that could be used as suitable parameters for the interpretation of fossil re-cords collected on palm swamps have been conducted. Therefore, the purpose of the research described in this report is to present a palyno-logical analysis of surface samples from depositional environments of theCerradobiome that may contribute to generate reliable parameters for interpreting fossil pollen records from the palm swamps. To accom-plish this, twenty four surface samples were collected from different bo-tanical contexts within theCerradobiome. Statistical analyses of the pollen content of these samples were used to compare pollen spectra from different local environments and different phytophysiognomies in order to highlight the influence of local and regional vegetations in the spectra. This comparison enabled better understanding of how
local and regional vegetations are reflected in these spectra and also permitted the determination of pollen taxa that are important for distinguishing between differentCerradophytophysiognomies and local environments. This research also provides a set of data that can be directly used for the comparison with fossil samples and the determi-nation of modern analogs and establishes the parameters that must be used in this comparison in order to associate correctly each fossil sample to a local environment and to a regional vegetation.
2. Materials and methods
2.1. Sampling, chemical processing and analyses
Despite the large territorial range of theCerradobiome, pastures and crops have replaced much of its original vegetation. Therefore, the sam-ple collection was conducted preferably in National Parks (Conservation Areas) within theCerradowhere the natural landscape and vegetation remain preserved.
From twenty four samples, twenty were collected in two National Parks with slightly different climatic and environmental conditions: theParque Nacional de Brasília(PNB) and theParque Nacional Grande Sertão Veredas(PGSV;Fig. 1). Thefirst one, located near the federal
cap-ital Brasília, extends over a plateau with an altitude of approximately 1000 m. The mean annual temperature is 21.7 °C, and the mean annual precipitation is 1600 mm. TheParque Nacional Grande Sertão Veredasis located on the border between the Minas Gerais and Bahia States in a plateau at a lower altitude of approximately 700 m. The climate there is slightly hotter and drier, with an annual mean temperature of 23 °C and an annual mean precipitation of 1400 mm. With respect to the four other samples, one was from a federal reserve located near the Parque Nacional de Brasília, theReserva Biológica da Contagem(RBC), and the three others were collected in sites outside conservation areas. The most northern came from aCerradoenclave in theCaatinga region on theChapada Diamantinaplateau (CD) and was collected in a valley, with an altitude of 880 m, surrounded by plateaus that reach over 1000 m. Another was collected in a plateau at 700 m altitude be-tween the Paracatu and São Francisco rivers in the Minas Gerais State (MG); and thefinal sample was collected in the same state, but further
south, on the Serra do Espinhaço, which is a mountain range with an al-titude of approximately 1400 m (SE;Fig. 1). In all these regions, the length of the dry season is of four tofive months, characterizing a
semi-humid climate. The sampling was not conducted with the inten-tion of representing all the different climatic regions of theCerrado biome since the main goal of the study was to analyze how the different phytophysiognomies that coexist within the parks are represented in the pollen spectra.
A central question in this study was to evaluate how the sedimenta-ry site vegetation (local vegetation) and the surrounding phyto-physiognomy (regional vegetation) are represented in the pollen spectra; hence, the sampling sites were classified based on two param-eters: local environment and regional vegetation (Table 1,Fig. 2). Three types of local environments were sampled: palm swamps, swamps and gallery forests. The purpose of this study being also to provide a set of modern pollen spectra that can be directly compared with fossil sam-ples, the surface sampling was performed in order to better reflect the conditions in which the fossil samples are deposited. To do so, the local environments of the selected sampling sites all represented possi-ble stages of a palm swamp's evolution.
The palm swamp samples were separated between those collected in the herbaceous border of the palm swamp and those collected in its center, where the Mauritia flexuosa palms concentrate. The palm
swamps were also classified as dense arboreal palm swamps, typical palm swamps or sparse palm swamps (Table 1). These environments represent different stages of the evolution of a palm swamp: the sparse palm swamp represents an initial stage during which herbaceous vege-tation predominates with few spacedM.flexuosapalms; the typical
palm swamp shows an inner zone with numerous alignedM.flexuosa palms and shrubby vegetation; the arboreal palm swamp is thefinal
stage of development and resembles a gallery forest with many arboreal taxa coexisting with theM.flexuosapalm. All sampled local environ-ments, including swamps and gallery forests, represent possible local environments of the fossil samples of palm swamps' cores.
Each of these local environments presents particular edaphic condi-tions. The central zones of swamps and palm swamps are characterized by peat soil, permanently waterlogged, while their edge zones have wet soils, subject to seasonal drying. Gallery forests may grow on various types of soils that are usually well-drained.
The sampling sites were also classified based on their regional vege-tation, i.e. the predominant phytophysiognomy present in the area adja-cent to the palm swamp, swamp or gallery forest. The following phytophysiognomies were sampled: the previously described Campo Sujo,Campo LimpoandCerradostricto sensu and additionally, Campo Rupestre, a shrubby and herbaceous vegetation adapted to rocky soils, and forests, term used to refer to any of the forested phytophysiognomies of theCerrado(Table 1). For the numerical analy-ses, these phytophysiognomies were grouped into three types of re-gional vegetation:“forests”,“arborealCerrado”and“grasslands and
shrubby grasslands”(Table 1).
In each sampling site, three small volumes of soil were collected a few centimeters away from each other, which were then mixed togeth-er to avoid ovtogeth-errepresentation of plants situated just above the collec-tion point. Following the method described in Salgado-Labouriau (2007), the samples were extracted using small 2-cm high cylindrical plastic collectors such that the soil samples were up to 2 cm deep. Using this procedure, samples should reflect the pollen deposition of a few tens of years, avoiding the influence of the variation of pollen pro-duction throughout the different seasons.
The samples were processed for palynological analysis using methods similar to those used traditionally for fossil samples, as
described inBennett and Willis (2001), using HCl-30%, HF-40%, KOH-10% and acetolysis treatments. Prior to treatment, 1 mg of Kochia scopariapollen was added to each sample to estimate pollen concentration (c.f.Salgado-Labouriau and Rull, 1986). The pollen counting was continued until a saturation point was reached; more detail on the use of saturation curves and on the pollen sums is provided inCassino (2014). The pollen sums, that include all angiosperm and gymnosperm taxa, varied between 338 and 1448 pollen grains.
2.2. Numerical methods
Percentage and concentration pollen diagrams were generated using C2 software (Juggins, 2007). Pollen types were separated into seven groups based on the ecological preferences of the taxa:Cerrado arboreal taxa; forest arboreal taxa;Cerradoherbs and shrubs; grasslands taxa; swamp taxa; taxa of various environments; and exotic taxa (Fig. 3). The association of each taxon to one of these groups was based on the data fromMendonça et al. (2008)that presents a checklist ofCerradospecies and indicates the phytophysiognomies and habitats in which they are found. The association of taxa to ecological groups was a complex task for two reasons:firstly, some taxa were identified only at the family or genera level and so can include plants from various habitats. Secondly, most taxa that could be identified at the species level
are not exclusive of one habitat and cannot be associated exclusively to one type of environment or phytophysiognomy. Poaceae was associated to the group“grassland taxa”because they are one of the predominant
components of grasslands but they are also abundant in palm swamps, swamps and in otherCerradophytophysiognomies. The group“swamp
taxa”includes all taxa associated to humid environments, some of them
being more specifically associated to the palm swamps. This is the case ofMauritiaflexuosathat, moreover, although being the most character-istic taxon of the palm swamps, can also be commonly found in gallery forests.
To test whether the modern pollen spectra could accurately reflect the local environment and/or the regional vegetation of the samples, two multivariate statistical analyses were used: Principal Component Analysis and dissimilarity coefficients.
Species-centered Principal Component Analyses (PCAs) of pollen percentages were generated using C2 software and displayed as biplot diagrams that, according toTer Braak (1983), reflect sample diversity and the contribution of each species to the overall diversity. In the PCA, pollen spectra are compared with each other and the more similar spectra are grouped together in the biplot. PCA was used in three successive phases: initially, it was used to test if the more similar pollen spectra, i.e. those plotted closer in the biplot, were from samples of the same local environment or regional vegetation. In a second phase, various tests were conducted in order to define which taxa should be used to obtain a PCA biplot in which the samples are grouped according to their local environment. In the third phase, other tests were performed to define which taxa should be used to obtain a PCA biplot in which the samples are grouped according to their regional vegetation.
Dissimilarity coefficients, as introduced byOverpeck et al. (1985), are useful when quantifying the dissimilarity between modern pollen spectra and to determine modern analogs for fossil samples.
Overpeck et al. (1985)proposed, after testing eight dissimilarity coeffi -cient formulas, that the square-chord distance was the one that en-abled the best differentiation between vegetation types of North America. That same coefficient formula was used here to test whether
a good differentiation between local environments and regional vege-tation of theCerradocould be achieved. The square-chord distance for-mula is dij=∑k(pik1/2–pjk1/2)2, where dijis the dissimilarity coefficient
between samples i and j, and pikis the percentage of pollen taxon k in
sample i.
Table 1
Local environments and regional vegetation where the twenty four samples were collected. Regional vegetation: G—grasslands and shrubby grasslands; C—arborealCerrado; and F—forests.
Sample code
Local environment Phytophysiognomies Regional vegetation PNB01 Swamp edge zone Campo Limpoand swamp G PNB02 Swamp Campo Limpoand forests G PNB03 Gallery forest Cerradostricto sensu C
PNB05 Swamp Campo Sujo G
PNB06 Arboreal palm swamp edge zone
Campo Sujo G
PNB08 Arboreal palm swamp Campo Sujo G PNB09 Gallery forest Campo Sujo G PNB10 Gallery forest Campo Limpo G PNB12 Typical palm swamp Campo Sujo G PNB13 Typical palm swamp
edge zone
Campo Sujo G
PNB14 Typical palm swamp edge zone
Campo Sujo G
PGSV01 Typical palm swamp Cerradostricto sensu C PGSV02 Typical palm swamp Cerradostricto sensu C PGSV03 Sparse palm swamp Cerradostricto sensu C PGSV04 Typical palm swamp
edge zone
Cerradostricto sensu C
PGSV05 Typical palm swamp Cerradostricto sensu C PGSV07 Swamp Forests andCerradostricto sensu F PGSV09 Swamp Forests and swamp F PGSV10 Swamp Forests andCerradostricto sensu F PGSV11 Typical palm swamp Campo Sujo and Cerrado
stricto sensu
G
RBC01 Gallery forest Cerradostricto sensu C CD01 Typical palm swamp
edge zone
Campo Rupestre G
SE01 Swamp Campo Rupestre G
3. Results
3.1. Percentage and total concentration diagrams
Palynological analysis of the twenty four surface samples resulted in the identification of 236 types of pollen grain. The pollen types included different taxonomic levels and ranged from species to family; descrip-tions of the pollen morphology and illustradescrip-tions of these pollen types were published elsewhere (Cassino, 2014). Many pollen taxa only oc-curred in one or in a few samples, and the diversity (number of taxa) is highly variable among the samples: in the least-diverse pollen spec-tra, only nineteen pollen types were observed, and in the most diverse, a total of sixty one pollen types were identified (Fig. 3). The samples with higher pollen diversity came from the gallery forests and the sam-ples with the lowest taxa diversity were from the drier soils present in the border zone of swamps or palm swamps; therefore, it is noteworthy that there is a relationship between the pollen diversity and local envi-ronment. The majority of the pollen types were‘rare taxa’: they
oc-curred in very low percentages and were represented by one or two
grains in the pollen spectra. One or two very abundant taxa, typically Poaceae, Melastomataceae/Combretaceae orMauritiaflexuosa(except for samples PNB03 and PGSV01, that were dominated byAlchornea andCecropia, respectively), dominated the pollen spectra (Fig. 3).
The total concentration of pollen grains in the sediment also varied greatly. The concentration does not directly reflect the amount of local pollen deposited because it is also influenced by sedimentation rates,
which differed from site to site. However, of note, the samples collected in swamps or in the border zone of palm swamps typically showed lower total pollen concentrations that ranged from 11,000 to 36,000 pollen grains/cm3. The other samples collected in palm swamps or
gal-lery forests showed variable total pollen concentrations that ranged from 35,000 to 135,000 pollen grains/cm3. The sample PGSV01, from a
palm swamp, was very different from the other samples and showed a pollen concentration of more than 400,000 pollen grains/cm3. This
anom-alous concentration was due to the abundance ofCecropiapollen in the sample.
The pollen diagrams of the twenty four samples (Fig. 3) suggest that the pollen spectra are typically dominated by local taxa. Of course,
Fig. 2.Environments and vegetation of selected surface samples. On the left, satellite images (Google Earth) of the sites and on the right, schematic representations of the local and regional vegetations. A and B) Samples PGSV04 and PGSV05, collected respectively on the edge zone and in the central zone of a typical palm swamp (local vegetation), surrounded byCerrado stricto sensu (regional vegetation) inParque Nacional Grande Sertão Veredas. The extension of the palm swamp central zone on the collection site is of approximately 50 m, and the ex-tension of the edge zone, where herbaceous vegetation predominates, is of approximately 20 m in each side of the central zone. C and D) Sample PNB09, collected in the gallery forest of a small stream, surrounded byCampo Sujo, inParque Nacional de Brasília. The gallery forest has as extension of approximately 50 m and the sample was collected in its center. E and F) Sample PNB05, collected in a swamp surrounded byCampo Sujo, inParque Nacional de Brasília.
depending on the type of local environment, different taxa should be considered“local taxa”; thus, for swamps, Poaceae and Cyperaceae are
local taxa, while for the gallery forests, forest trees should be considered as local. For example, in the pollen spectra of the palm swamps, generally the most abundant taxa areMauritiaflexuosa, Cyperaceae, Melastomataceae/Combretaceae and Poaceae, all taxa that are abundant in this environment. Samples collected in the edge zone of the palm swamp tend to have lowerM.flexuosaand higher Poaceae, reflecting the fact that the palmM.flexuosais concentrated in the central zone of
the palm swamp and its edge zone is predominantly herbaceous. Pollen spectra of swamp samples are dominated by Poaceae; and gallery forest samples have low percentages of Poaceae and more significant
percent-ages of forest trees such asTapirira,Alchornea,Hedyosmum brasiliense
and Myrtaceae (Fig. 3). Therefore, for all the considered environments, the local taxa are predominant, and consequently, samples collected in the same type of local environment are more alike than samples that come from sites with the same regional vegetation (Fig. 3) and there is no direct relationship between pollen spectra and regional vegetation. For example, there were no higher percentages ofCerradoarboreal taxa in the samples collected on sites surrounded by a dense arboreal Cerradoand, likewise, there were no higher percentages of herbaceous taxa in samples collected on sites characterized by grassland regional vegetation (Fig. 3). It is of note, however, that despite the local pollen predominance and the similarities between pollen spectra of samples from the same type of local environment, there are, between samples of the same local environment, significant differences in the percentages
of certain taxa (for example Melastomataceae/Combretaceae;Fig. 3) and in the presence and diversity of rare taxa.
3.2. Principal Component Analysis numerical methods
Considering the diversity of pollen types and the similarities and dif-ferences between pollen spectra observed in the pollen diagrams of the twenty four surface samples, and given the use of pollen spectra as pa-rameters for paleo-vegetational reconstruction, it is important to test if it is in fact possible to determine the vegetation of the sites where sur-face samples were collected from their pollen spectra. For this to be
considered possible, when comparing the pollen spectra from surface samples, pollen spectra that come from sites with the same kind of veg-etation must be more alike. In a Principal Component Analysis (PCA), this means that pollen spectra from sites with the same kind of vegeta-tion must group together in the biplot. If pollen spectra deposited in the same vegetational context are sufficiently homogeneous and different from pollen spectra deposited in other contexts, they will plot together in the PCA biplot, indicating that it is possible to reconstruct the paleo-vegetation of a fossil sample from its pollen spectra.
In the present case of study, the vegetational context of each site is characterized by two independent entities: the vegetation of the
Fig. 3 (continued).
depositional environment (local vegetation) and the phyto-physiognomy that surrounds the site (regional vegetation). As already discussed, the pollen diagrams suggest that the pollen spectra have a minor influence of the regional vegetation and thus samples that come from the same kind of regional vegetation, but from different local environments, can have very different pollen spectra. Thus, it is ex-pected that, comparing the samples in a PCA, they will not be grouped according to their regional vegetation in the biplot. On the other hand, samples collected in the same type of local environment tend to have similar pollen spectra, although there are differences in the abundance of some taxa and overlaps between pollen spectra from different local environments. Thus, initially, in thefirst phase of the numerical
analy-sis, PCA was used to test if the more similar pollen spectra, i.e. those plotted closer in the biplot, were in fact from samples of the same local environment and not from samples of the same regional vegeta-tion, thus confirming the bigger influence of local pollen in the samples. That being the case, the PCA was also used to test if the pollen spectra are sufficiently different to allow precise and correct assignment of the samples to their local environment.
In thisfirst phase, the fortyfive most-common taxa were included in the PCA, all taxa that occurred infive or more samples were considered (Table 2,Fig. 3) with the exception ofCecropia, which was excluded be-cause it was overrepresented in sample PGSV01; the percentages were recalculated to sum 100%.
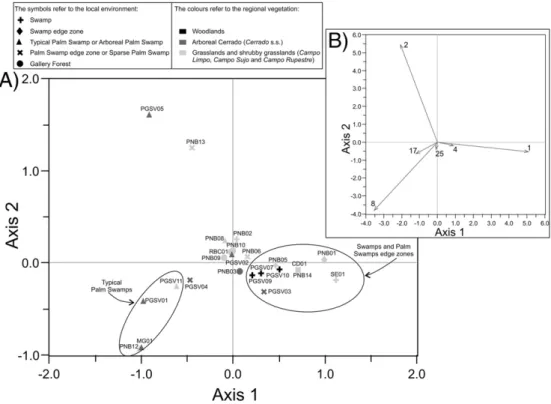
In the obtained biplot (PCA-45;Fig. 4), thefirst principal component
accounted for 36% of the variance in the pollen spectra, and the second principal component accounted for 27%. Poaceae, Melastomataceae/ Combretaceae andMauritiaflexuosashowed the highest species scores, and the separation between samples was primarily due to the percent-ages of these taxa (Fig. 4). Other taxa that have achieved a high score, i.e., whose percentages were important to differentiate between sam-ples, were Cyperaceae, usually abundant in the same samples that Poaceae; Erythroxylum which was very abundant only in sample PGSV11; andCuphea micrantha, which occurred in a few samples of dif-ferent environments (Fig. 4). The biplot PCA-45 confirms that pollen
spectra are more influenced by the local vegetation as the distribution of the samples in the biplot is more related to their local environment: the majority of the typical palm swamp samples are in the bottom left of the diagram due to their high content ofM.flexuosa; samples from swamps and from the edge zone of palm swamps are on the right side, reflecting their high content of Poaceae and Cyperaceae; samples
from gallery forests concentrated near the origin because they showed lower percentages of these three taxa. However, two samples with high Melastomataceae/Combretaceae and low Poaceae percentages placed in the top left of the diagram although they were not from the same environment and many samples (e.g., PGSV02, PGSV04, PNB02 and PNB06) were not placed within their groups (i.e., within the group of samples from the same local environment). Therefore, the comparison of pollen spectra based on these forty-five taxa did not allow a correct assignment of samples to their local environment. This method is thus not adequate to determine the local environment of fossil samples from the comparison with modern spectra.
The reason for this result is likely the fact that the group of
forty-five taxa used in the PCA included taxa, such as Cyperaceae and
Melastomataceae/Combretaceae, that are abundant in various local en-vironments and, also, the fact that the regional vegetation also has an
in-fluence, although limited, on the percentages of these forty-five taxa.
Therefore, modifying the basis of comparison of samples, that is, restricting the comparison to the percentages of some selected taxa, it is possible that a biplot in which samples would be grouped according to their local environment could be obtained. PCA was thus used, in the second phase of the numerical analysis, to determine which group of taxa provides, when used to compare samples, the best grouping according to the local environment of the samples. The PCA was thus repeated multiple times, removing taxa progressively, until a group of taxa that best separated the local environments in the biplot
was obtained. This was achieved using a group of seventeen taxa (Table 2,Fig. 3) that included some abundant taxa, such asMauritia flexuosaand Poaceae, and excluded others, such as Cyperaceae and
Melastomataceae/Combretaceae. Besides those two taxa, the group comprised other taxa abundant in the palm swamps and swamps (Alternanthera,Drosera,Eryngium,XyrisandByrsonima) and some arbo-real taxa that occur in gallery forests (Arecaceae,Allophylus,Euplassa, Hedyosmum brasiliense,Ilex,Protium,Symplocos,Symplocos uniflora, Tapirira). In all analyses, the percentages were recalculated to sum 100%.
The analysis that included this group of seventeen taxa (PCA-17) re-sulted in a PCA biplot that accurately separated the samples by their local environment (Fig. 5); thefirst component accounted for 74% of
the variance among the spectra, and the second component accounted for 20% of the variance. The samples from swamps grouped in the left bottom part of the diagram, and the samples from palm swamps grouped in the right bottom (Fig. 5). Samples collected in the border zone of palm swamps or in sparse palm swamps grouped to the left
Table 2
Lists of the pollen taxa used in the different numerical analyses. The letters in the left col-umn refer to the ecological group of the taxon: C—Cerradoarboreal taxa; F—forest taxa; G—grassland taxa; H—Cerradoherbs and shrubs; S—swamp taxa; and V—various environments.
Most common taxa (PCA-45; CD-45) Seventeen selected taxa (PCA-17; CD-17) C Arecaceae C Arecaceae
C Erythroxylum(Erythroxylaceae) F Allophylus(Sapindaceae) C Tabebuia(Bignoniaceae) F Euplassa(Proteaceae) C TypeEriotheca(Bombacaceae) F Hedyosmum brasiliense
(Chloranthaceae) C Vochysiaceae F Ilex(Aquifoliaceae) F Alchornea(Euphorbiaceae) F Protium(Burseraceae) F Cestrum(Solanaceae) F Symplocos(Symplocaceae) F Hedyosmum brasiliense
(Chloranthaceae)
F Symplocos uniflora(Symplocaceae)
F Hyeronima(Euphorbiaceae) F Tapirira(Anacardiaceae) F Ilex(Aquifoliaceae) G Alternanthera(Amaranthaceae) F Moraceae/Urticaceae G Poaceae
F Myracrodruon urundeuva
(Anacardiaceae) S Drosera(Droseraceae) F Myrsine(Myrsinaceae) S Eryngium(Apiaceae) F Piper(Piperaceae) S Mauritiaflexuosa(Arecaceae) F Podocarpus(Podocarpaceae) S Xyris(Xyridaceae) F Protium(Burseraceae) V Byrsonima(Malpighiaceae) F Schefflera(Araliaceae) V Myrtaceae
F Serjania(Sapindaceae) Fourteen arboreal taxa (PCA-14; CD-14) F Sloanea(Elaeocarpaceae) C Caryocar brasiliense(Caryocaraceae) F Tapirira(Anacardiaceae) C Curatella americana(Dilleniaceae) F Trema micrantha(Ulmaceae) C Plenckia populnea(Celastraceae) G Alternanthera(Amaranthaceae) C TypeEriotheca(Bombacaceae) G Cuphea micrantha(Lythraceae) F Chrysophyllum(Sapotaceae) G Cuphea(Lythraceae) F Euplassa(Proteaceae) G Gomphrena(Amaranthaceae) F Ilex(Aquifoliaceae) G Poaceae F Matayba(Sapindaceae) G Polygala(Polygalaceae) F Maytenus(Celastraceae) H Hyptis(Lamiaceae) F Myrsine(Myrsinaceae) H Mimosa(Fabaceae) F Podocarpus(Podocarpaceae) H Sebastiania corniculata
(Euphorbiaceae)
F Roupala(Proteaceae)
H Senna(Fabaceae) F Schefflera(Araliaceae) H TypeMaprounea(Euphorbiaceae) F Trema micrantha(Ulmaceae) H TypeBorreria(Rubiaceae)
H TypePeixotoa(Malpighiaceae) H TypeSpermacoce(Rubiaceae) S Cyperaceae
S Drosera(Droseraceae) S Ludwigia(Onagraceae) S Mauritiaflexuosa(Arecaceae) S Xyris(Xyridaceae) V Asteraceae
V Byrsonima(Malpighiaceae) V Melastomataceae/Combretaceae V Myrtaceae
side, nearer to the origin. The samples from gallery forests formed a dis-tinct group in the top of the diagram (Fig. 5). Sample PGSV08, collected in the center of an arboreal palm swamp, which is in the process of be-coming a gallery forest, placed close to the gallery forest group. Sample PGSV10, collected on a swamp, placed within the samples from palm swamps borders, which may be explained by the presence of a palm swamp nearby. Therefore, when comparing the pollen spectra consider-ing only the percentages of these seventeen taxa, the position of sam-ples along the axes of the PCA reflects their local environment and the correct assignment that was not achieved in the previous analysis was reached in this biplot.
A direct relationship between the pollen spectra and the surround-ing phytophysiognomy (regional vegetation) was not observed in the pollen diagrams and the PCA-45 confirmed that, when the percentages
of the most common taxa are considered, the pollen spectra are not grouped in the biplot according to the regional vegetation of the sam-ples. Hence, a third phase of the numerical analysis was conducted, in which PCA was used to test if removing the local taxa and restricting the analyses to arboreal taxa, it would be possible to recognize properly and accurately the regional vegetation of each sample from its pollen spectra. Again, various PCAs with different groups of taxa were run until a biplot in which the samples were grouped according to their
Fig. 4.Principal component biplot calculated using the fortyfive most-common taxa in the pollen spectra: A) sample scores for thefirst and second components (the circles enclose sam-ples from similar environments) and B) species scores (only taxa with higher scores are shown (arrows): 1. Poaceae; 2. Melastomataceae/Combretaceae; 4. Cyperaceae; 8.Mauritia
flexuosa; 17.Erythroxylum; 25.Cuphea micrantha).
Fig. 5.Principal component biplot calculated using the group of seventeen selected taxa: A) sample scores for thefirst and second components (the circles enclose samples from similar environments) and B) species scores (only taxa with higher scores are shown (arrows): 4.Mauritiaflexuosa; 7. Poaceae; 10.Hedyosmum brasiliense; 12.Protium; 15.Tapiria; 16.Byrsonima; 17. Myrtaceae).
regional vegetation was obtained. The best result was reached with a PCA biplot that included a group of fourteen arboreal taxa (PCA-14;
Table 2,Fig. 6), although the variance accounted for by thefirst and second principal components (respectively 29 and 21%) was reduced compared with the previous analysis.
Thefirst feature of note in this diagram (Fig. 6) is that the samples of the two parks that concentrate the majority of the collection sites are separated along thefirst component axis, with samples fromParque Grande Sertão Veredas(PGSV) concentrated in the positive side of the axis and theParque Nacional de Brasília(PNB) in the negative side. An exception is made for samples PGSV07 and PNB03 that plotted to the
‘wrong’side. This separation between parks was not obtained in the
previous analyses and reflects a separation between two different cli-matic and vegetation zones. Moreover, the samples are, in most cases, grouped according to the predominant phytophysiognomy around the sites: samples surrounded byCerradostricto sensu plotted to the right bottom of the diagram (reflecting high percentages ofCaryocarorIlex, EriothecaandPlenckia). Samples surrounded by more open vegetation (Campo LimpoandCampo Sujo) grouped to the bottom left due to the absence ofCerradoarboreal taxa and the presence ofPodocarpus. The presence ofPodocarpuspollen in those samples, from open vegetation sites, is interesting as this taxon is usually found in forests and gallery forests in this region; however, being an anemophilous tree, its pollen is more easily dispersed than those from most typicalCerradospecies, and can consequently be present in depositional environments surrounded by grassland vegetation and distant from its occurrence area. Two samples, collected near Woodlands, plotted to the right top, with high percentages ofTremaandMatayba. The samples from gallery forests are the ones that least reflected the regional vegetation and tended to plot near to the origin, which is explained by the fact that the denser vegetation may prevent the accumulation of regional pollen.
3.3. Dissimilarity coefficients
In addition to Principal Component Analysis, dissimilarity coeffi
-cients were calculated to assess the dissimilarity between the pollen
spectrum of a given sample and all the other samples in the dataset. The results were plotted in diagrams that show the dissimilarity coeffi
-cients in ascending order, which enables grouping of the less dissimilar samples. In the diagrams, presented for eight selected samples (PGSV02, PGSV04, PGSV05, PGSV09, PNB03, PNB05, PNB13 and RBC01), the sam-ple that is being compared has a coefficient equal to zero and is plotted in the left extremity of the diagram (Figs. 7, 8, 9 and 10). For example, in
Fig. 6A, sample PGSV02 is being compared with all the other samples of the dataset; the diagram shows that the most similar sample to PGSV02 is PGSV03 that have a dissimilarity coefficient around 30, and the most dissimilar sample is PNB03, which presents a dissimilarity coefficient of 160.
Dissimilarity coefficients were used with the same objectives of the Principal Component Analysis, in order to see if different results would be obtained when using a different numerical method. As done for PCAs, initially, dissimilarity coefficients were used to test if, when the most common taxa are considered in the analyses (DC-45), pollen spectra from the same type of local environment have lower dissimi-larity coefficients. Additionally, dissimilarity coefficients considering all the taxa were also calculated (DC-all). Then, dissimilarity coeffi -cients were calculated considering only the group of seventeen taxa (DC-17) determined from the PCAs, to test if samples would be grouped according to their local environment in the diagrams. Finally, dissimilarity coefficients were also calculated considering only the group of fourteen arboreal taxa (DC-14) determined from the PCAs, to test if samples would be grouped according to their regional vegetation.
When the calculation of the dissimilarity coefficient is based on all
taxa (DC-all), in the majority of cases the nearest samples (with lower dissimilarity coefficients) are not of the same local environment or the same regional vegetation. There are some exceptions, for example, for samples PGSV09, PNB05 and PNB03 (Figs. 8 and 9) pollen spectra from similar local environments tended to concentrate on the left of the diagram. However, in general, if all the taxa are considered, the dissimilarity coefficients do not provide a diagram with samples
grouped according to their vegetational context. When the forty-five
most common taxa are used in the coefficient calculations (DC-45),
different results are obtained (Figs. 7, 8, 9 and 10); in these diagrams, samples from the same type of local environment tend to have lower
dissimilarity coefficients. As observed for the PCAs, this confirms the
hypothesis that pollen spectra are primarily influenced by the local vegetation of the sites.
Fig. 7.Diagrams of dissimilarity coefficients calculated from all the taxa, the fortyfive most-common taxa, the seventeen selected taxa and the fourteen arboreal taxa for samples PGSV02 and PGSV04. The vertical line in the seventeen-taxa diagrams separates samples with coefficients lower than the critical value (30).
When the seventeen selected taxa (DC-17) are used, the dissimilar-ity coefficients display a better grouping of samples with respect to local environment. Indeed, dissimilarity coefficients b40 were
zone of palm swamps, which are very similar local environments. Conversely, samples collected on palm swamps and gallery forests, when compared to sample PNB05, show dissimilarity coefficients N60. The same pattern was observed in other samples (PGSV05,
PGSV09, PNB03, RBC01 and PNB13). For PGSV02 and PGSV04, the
dissimilarity coefficient that separates the samples of the same envi-ronment from the other samples is lower (approximately 30).
The attempt to separate the samples based on their regional vegeta-tion was less conclusive when based on the dissimilarity coefficients than in the PCA. In the DC-14 analysis of samples PNB05, PNB13 and
Fig. 9.Diagrams of dissimilarity coefficients calculated from all taxa, the fortyfive most-common taxa, the seventeen selected taxa and the fourteen arboreal taxa for samples PNB03 and PNB05. The vertical line in the seventeen-taxa diagrams separates the samples with coefficients lower than the critical value (30).
RBC01, which had more open regional vegetation, lower coefficient
values (b100) were obtained for other samples from grasslands and
shrubby grasslands (Figs. 9H,10H and D) although some samples
were‘misplaced’. In the analysis of samples PGSV02 and PGSV04,
which are surrounded by an arborealCerrado, samples that showed the same regional vegetation also tended to present dissimilarity
coefficients ofb100 (Fig. 7D and H). However, for the other samples,
this critical value could not be used to determine samples of the same regional vegetation type.
4. Discussion
The pollen diagrams of the twenty-four surface samples presented here showed that the pollen spectra have more influence of the local vegetation, i.e. the vegetation of the depositional site, so that samples collected in the same local environment, for example the central zone of a palm swamp, are more alike, regardless of the phytophysiognomy present around the site. In the previously mentioned data presented byLedru (2002), a clear difference in the percentage of Poaceae was found in surface samples from different phytophysiognomies, however, our study shows that in surface samples collected on depositional sites similar to those where cores are collected, this difference is no longer visible, as it is masked by local pollen. Previously published data from surface samples collected on palm swamps or similar environments (Ferraz-Vicentini, 1993, 1999; Barberi et al., 2000) had already demon-strated the abundance in the pollen spectra of local taxa such asMauritia flexuosaand Cyperaceae. However, as there was no comparison of sam-ples from different phytophysiognomies (and moreover, most of the samples were from disturbed areas), it was not clear if the influence of the regional vegetation could be visible in the percentage of Poaceae or of the arboreal taxa.
As local pollen is more abundant in the pollen spectra of the surface samples and samples from the same local environment are more alike, the vegetation of the depositional site can more easily be reconstructed from the pollen spectra than the regional vegetation. Even so, the PCA that compares the samples based on the percentages of the forty-five more common taxa (PCA-45,Fig. 4) did not allow the correct grouping of all samples according to their local environments. This indicates that,
firstly, that are heterogeneities among samples from the same local en-vironments and overlapping between samples from different environ-ments, and, secondly, that other factors, such as the surrounding phytophysiognomy, also have an influence in the pollen spectra, which is, of course, expected. If the composition of the pollen spectra had no other influence than that of the local vegetation, the samples
would be grouped according to their local environment in the PCA and in the dissimilarity coefficient diagrams that considered the most common taxa (PCA-45; DC-all; DC-45), which was not the case in this study.
However, parameters of comparison can be chosen in order to ob-tain diagrams in which samples are correctly grouped according to their local environment. To achieve this, instead of comparing samples in relation to the percentages of all taxa, only the taxa whose percent-ages are more directly related to the vegetation of the depositional en-vironments were selected and used in the statistical analyses. Our results (PCA-17,Fig. 5) showed that, to separate between the most com-mon depositional environments of theCerrado(palm swamps, swamps, and gallery forests), the percentages of the seventeen following taxa should be used in the statistical analyses: Arecaceae; Allophylus; Euplassa;Hedyosmum brasiliense;Ilex;Protium;Symplocos;Symplocos uniflora;Tapirira;Alternanthera; Poaceae;Drosera;Eryngium;Mauritia flexuosa;Xyris;Byrsonima; and Myrtaceae. The percentages of these taxa are useful for differentiating between the different types of deposi-tional environments of theCerrado, which means that this group of taxa can be used to compare a fossil sample, whose depositional environ-ment is unknown, with the surface samples from this database. From the fossil sample position in the PCA diagram (PCA-17), it will be possi-ble to determine exactly in which type of environment the fossil sample was deposited. It is important to note that in the PCA-17, the determina-tion of the local environment is quite precise. For example, samples PGSV04 and PGSV05 were collected a few meters away from each other, the former in the herbaceous edge zone of a palm swamp and the other in its inner shrubby-arboreal zone (Fig. 2); despite the
geographical proximity of the samples, they plotted to different groups in the biplot. This indicates that the analysis has sufficient accuracy to
separate between closely located environments that harbor different kinds of vegetation and shows that PCA-17 will be useful to visualize expansions and retractions of the central zone of palm swamps in fossil cores, since this analysis allows the separation between samples depos-ited in the central zone of the palm swamp from those deposdepos-ited in its edges.
In addition to PCA-17, our results show that the determination of the local environment of fossil samples can also be obtained with the dis-similarity coefficient analysis based on the same group of seventeen taxa (DC-17). In this analysis, a critical value of 30 can be defined from
our study, as the value below which the pollen spectra are from the same local environment. This value may be used as a parameter to com-pare fossil samples with the modern pollen spectra and to determine modern analogs for past deposition environments.
Although it is interesting to reconstruct the expansions and retrac-tions of the palm swamps and the variaretrac-tions of the vegetation of the de-positional site, since these are influenced, among other factors, by changes in climate humidity, the principal goal of palaeoenvironmental studies is usually to reconstruct the changes in the regional vegetation and their climatic implications. It is therefore valid to attempt the recon-struction of the regional vegetation from the samples collected in palm swamps and similar depositional environments, although, as noticed, the predominance of local pollen complicates this task. The case of sam-ples PGSV04 and PGSV05, discussed above, reflects this difficulty, as these samples, which come from the exact same regional vegetation, have quite different pollen spectra, as shown in PCA-45 (Fig. 4). Howev-er, the influence of regional vegetation in the pollen spectra exists and can be retrieved. Presumably, the openness of the regional vegetation could be reflected in the pollen spectra as the percentage of herbaceous
taxa and in particular, Poaceae. However, these elements are also very abundant in the depositional sites where the samples were collected, i.e., their occurrence and abundance in the pollen spectra primarily reflect the local vegetation and have little influence of the degree of
openness of the regional vegetation. Thus, to assess the openness of the regional vegetation, and so to determine the phytophysiognomy, the most important parameter to consider is the percentage of certain arboreal taxa that are common in the savannah or in the forest phytophysiognomies. Indeed, depending on the degree of openness of the vegetation, these arboreal taxa are more or less abundant or even absent in the pollen spectra, and our results show that they are the most suitable parameter to reconstruct the regional paleo-vegetation. This group of fourteen arboreal taxa includes some typical Cerradostricto sensu taxa (Caryocar brasiliense,Curatella Americana, Plenckia populneaand TypeEriotheca) and some arboreal taxa typical of the forests phytophysiognomies (Chrysophyllum, Euplassa, Ilex, Matayba,Maytenus,Myrsine,Podocarpus,Roupala,ScheffleraandTrema micrantha). The percentages of these taxa are useful to determine the regional vegetation of the samples, as thefirst ones are present in the samples from savannah phytophysiognomies, the second ones in the samples from forest phytophysiognomies and onlyPodocarpus, because of its anemophilous type of pollination, is present in the pollen spectra from grasslands phytophysiognomies.
5. Conclusions
The study of pollen spectra from twenty four surface samples collected in different sites within theCerradobiome has important im-plications for the interpretation of fossil pollen records and the recon-struction of past vegetation in Central Brazil. A great diversity of pollen types is present in the modern samples; however, in general, the spectra are dominated by one or two local taxa. The regional vegeta-tion surrounding the deposivegeta-tion site is poorly represented in the spectra, even when a denseCerradois present. This provides an extra impor-tance to rare pollen taxa and emphasizes the imporimpor-tance of using
saturation curves for pollen counting, as done in this study, in sediment samples from theCerrado. Counting with saturation curves usually exceeds the pollen sum of 300 grains traditionally used for other vege-tation types, providing a more complete represenvege-tation of rare taxa.
Despite this predominance of local taxa, the use of numerical methods has demonstrated that two aspects of the landscape may be reconstructed based on the pollen spectra: the local environment of the deposition site and the regional vegetation that surrounds the site. The reconstruction of these two aspects is important in paleoenvironmental research because not only the regional vegetation but also the local environment is influenced by climatic and other envi-ronmental changes. The central question when using numerical methods for comparing pollen spectra is the taxa that are considered for the calculations. The PCA and dissimilarity coefficient calculations presented here showed that little information is retrieved from compar-isons when a great number of taxa are used. The pollen spectra were very diverse; thus, there was too much noise in the analyses, and this noise prevented good separation between the sites.
Different analyses that consider different groups of taxa should be used to group similar samples based on the two different aspects of the landscape that were investigated. A set of seventeen taxa is pro-posed as being optimal for statistical analyses when investigating the local environment. When using this group of taxa for calculating dissim-ilarity coefficients, a critical value of 30 was established, above which two samples may be considered as originating from the same local environment.
A set of fourteen arboreal taxa is proposed as being optimal for the investigation of regional vegetation. Although in palynological analysis the abundance of herbaceous taxa, and in particular Poaceae, is fre-quently used as an indicator of the openness of regional vegetation, the data presented here showed that in theCerradopollen spectra, the abundance of Poaceae pollen is influenced primarily by local vegetation and does not reflect the openness of the landscape. Therefore, in numer-ical analyses, the use of herbaceous taxa is not appropriate for assessing regional vegetation openness.
The data presented here also suggest that arboreal taxa are more appropriate when assessing climatic regions from pollen spectra; how-ever, a more complete data set is required to determine a group of taxa that can be used effectively in statistical analyses to separate the different climatic regions of theCerrado.
Acknowledgments
This research was supported by the Conselho Nacional de Desenvolvimento Científico e Tecnológico (CNPq), process number 475929/2011-0 and grant number 151478/2011-2. The authors thank the Instituto de Pesquisa Chico Mendes de Biodiversidade (ICMBio) for authorizing the sampling on the national parks. We also thank the two anonymous reviewers for their constructive comments and sugges-tions that helped to improve the early version of this manuscript.
References
Barberi, M., Salgado-Labouriau, M.L., Suguio, K., 2000.Paleovegetation and paleoclimate of “Vereda de Águas Emendadas”, Central Brazil. J. S. Am. Earth Sci. 13, 241–254. Behling, H., 1995.A high resolution Holocene pollen record from Lago do Pires, SE Brazil:
vegetation, climate andfire history. J. Paleolimnol. 14 (3), 253–268.
Behling, H., 2002.Late Quaternary vegetation and climate dynamics in Southeastern Amazonia inferred from Lagoa da Confusão in Tocantins State, Northern Brazil. Amazoniana 17 (1/2), 27–39.
Behling, H., 2003.Late Glacial and Holocene vegetation, climate andfire history inferred from Lagoa Nova in the Southeastern Brazilian lowland. Veg. Hist. Archaeobot. 12, 263–270.
Bennett, K.D., Willis, K.J., 2001.Pollen. In: Smol, J.P., Birks, H.J.B., Last, W.M. (Eds.), Track-ing Environmental Change UsTrack-ing Lake SedimentsTerrestrial, Algal, and Siliceous Indicators vol. 3. Kluwer Academic Publishers, Dordrecht, pp. 5–32.
Burn, M.J., Mayle, F.E., Killeen, T.J., 2010.Pollen-based differentiation of Amazonian rainforest communities and implications for lowland palaeoecology in tropical South America. Palaeogeogr. Palaeoclimatol. Palaeoecol. 295, 1–18.
Cassino, R.F., 2014.Reconstituição paleoambiental da região dos cerrados do norte de Minas Gerais baseada na análise palinológica de sedimentos de veredas e na comparação com conjuntos polínicos atuais Ph.D thesis Instituto de Geociências, Universidade de Brasília.
Cassino, R.F., Meyer, K.E.B., 2013.Reconstituição Paleoambiental do Chapadão dos Gerais durante o Quaternário Tardio, a Partir da Análise Palinológica da Vereda Laçador. Rev. Bras. Paleontol. 16 (1), 127–146.
Ferraz-Vicentini, K.R., 1993.Análise palinológica de uma vereda em Cromínia - GO Masters thesis, Departamento de Ecologia, Universidade de Brasília.
Ferraz-Vicentini, K.R., 1999.História do fogo no Cerrado: uma análise palinológica Ph.D thesis Departamento de Ecologia, Universidade de Brasília.
Ferraz-Vicentini, K.R., Salgado-Labouriau, M.L., 1996.Palynological analysis of a palm swamp in central Brazil. J. S. Am. Earth Sci. 9 (3/4), 207–219.
Furley, P.A., 1999.The nature and diversity of neotropical savanna vegetation with partic-ular reference to the Brazilian cerrados. Glob. Ecol. Biogeogr. 8, 223–241. Gosling, W.D., Mayle, F.E., Tate, N.J., Killeen, T.J., 2009.Differentiation between Neotropical
rainforest, dry forest, and savannah ecosystems by their modern pollen spectra and implications for the fossil pollen record. Rev. Palaeobot. Palynol. 153, 70–85. Henriques, R.P.B., 2005.Influência da história, solo e fogo na distribuição e dinâmica das
fitofisionomias no bioma do Cerrado. In: Scariot, A., Sousa-Silva, J.C., Felfili, J.M. (Eds.), Cerrado: Ecologia, Biodiversidade e Conservação. Editora do Ministério do Meio Ambiente, Brasília, pp. 75–92.
Horák, I., 2009.Relações pedológicas, isotópicas e palinológicas na reconstrução paleoambiental da turfeira da Área de Proteção Especial (APE) Pau de Fruta, Serra do Espinhaço Meridional Masters thesis, Escola Superior de Agricultura‘Luiz de Queiroz’, Universidade de São Paulo.
Juggins, S., 2007.C2 Version 1.5 User Guide. Software for Ecological and Palaeoecological Data Analysis and Visualisation. Newcastle University, Newcastle upon Tyne, UK (73 pp.).
Ledru, M.P., 1993.Late Quaternary environmental and climatic changes in Central Brazil. Quat. Res. 39 (1), 90–98.
Ledru, M.P., 2002.Late Quaternary history and evolution of the cerrados as revealed by palynological records. In: Oliveira, P.S., Marquis, R.S. (Eds.), Ecology and Natural His-tory of a Neotropical Savanna: The Cerrados of Brazil. The University of Columbia Press, pp. 33–50.
Lorente, F.L., Meyer, K.E.B., Horn, A.H., 2010.Análise Palinológica da Vereda da Fazenda Urbano, Município de Buritizeiro, Minas Gerais, Brasil. Geonomos 18 (2), 57–72. Mendonça, R.C., Felfili, J.M., Walter, B.M.T., Silva Júnior, M.C., Rezende, A.V., Filgueiras, T.S.,
Nogueira, P.E., Fagg, C.W., 2008.Flora Vascular do Cerrado. Checklist com 12.356 espécies. In: Sano, S.M., Almeida, S.P., Ribeiro, J.F. (Eds.), Cerrado: Ecologia e Flora vol. 2. Embrapa Informação Tecnológica, Brasília, pp. 423–1279.
Meyer, K.E.B., Cassino, R.F., Lorente, F.L., Raczka, M., Parizzi, M.G., 2014.Paleoclima e paleoambiente do Cerrado durante o Quaternário com base em análises palinológicas. In: Carvalho, I.S., Garcia, M.J., Lana, C.C., Strohschoen, O. (Eds.), Paleontologia: Cenários da Vida vol. 5. Interciência, Rio de Janeiro, pp. 403–420. Ortuño, T., Ledru, M.P., Cheddadi, R., Kuentz, A., Favier, C., Beck, S., 2011.Modern pollen
rain, vegetation and climate in Bolivian ecoregions. Rev. Palaeobot. Palynol. 165, 61–74.
Overpeck, J.T., Webb, T., Prentice, I.C., 1985.Quantitative interpretation of fossil pollen spectra: dissimilarity coefficients and the method of modern analogs. Quat. Res. 23, 87–108.
Parizzi, M.G., Salgado-Labouriau, M.L., Kohler, C.H., 1998.Genesis and environmental history of Lagoa Santa, SE Brazil. The Holocene 8 (3), 311–321.
Raczka, M.F., De Oliveira, P.E., Bush, M., Mcmichael, C.H., 2012.Two paleoecological histories spanning the period of human settlement in southeastern Brazil. J. Quat. Sci. 28, 144–151.
Ribeiro, J.F., Walter, B.M.T., 2008.As principaisfitofisionomias do Cerrado. In: Sano, S.M., Almeida, S.P., Ribeiro, J.F. (Eds.), Cerrado: Ecologia e Flora vol. 1. Embrapa Informação Tecnológica, Brasília, pp. 151–199.
Salgado-Labouriau, M.L., 1973.Contribuição à Palinologia dos Cerrados. Academia Brasileira de Ciências, Rio de Janeiro.
Salgado-Labouriau, M.L., 1997.Late Quaternary palaeoclimate in the savannas of South América. J. Quat. Sci. 12 (5), 371–379.
Salgado-Labouriau, M.L., 2007.Critérios e Técnicas para o Quaternário. Editora Edgard Blucher, São Paulo.
Salgado-Labouriau, M.L., Rull, V., 1986.A method of introducing exotic pollen for palaeoecological analysis of sediments. Rev. Palaeobot. Palynol. 47, 97–103. Sano, S.M., Almeida, S.P., De Ribeiro, J.F., 2008.Cerrado: Ecologia e Flora vol. 1. Embrapa
Informação Tecnológica, Brasília.
Stutz, S., Prieto, A.R., 2003.Modern pollen and vegetation relationships in Mar Chiquita coastal lagoon area, southeastern Pampa grasslands, Argentina. Rev. Palaeobot. Palynol. 126, 183–195.
Ter Braak, C.J.F., 1983.Principal components biplots and alpha and beta diversity. Ecology 64 (3), 454–462.