AR
TICLE
1 Programa de Pós-Graduação em Saúde Coletiva, Universidade Federal do Rio Grande do Norte (UFRN). Av. Senador Salgado Filho 1787, Lagoa Nova. 59056-000 Natal RN Brasil.
[email protected] 2 Departamento de Ciências Atmosféricas e Climáticas, UFRN. Natal RN Brasil. 3 Departamento de Nutrição, UFRN. Natal RN Brasil.
Nutritional status of children under 5 years of age in Brazil:
evidence of nutritional epidemiological polarisation
Abstract The objective of this study was to eval-uate the nutritional status of children under 5 years of age in Brazil in 2009 and its association with social and demographic factors. Data from the Household Budget Survey (Pesquisa de Orça-mento Familiar - POF 2008-2009) were used, in which the nutritional profile was evaluated ac-cording to the weight-for-age (W/A), height-for-age (H/A) and weight-for-height (W/H) indices (n = 14,569). The association was estimated by applying the Pearson association test, a logistic re-gression and a correspondence analysis. The corre-spondence analysis showed a higher association of thinness with children in the North and Northeast regions, in families with lower levels of income and in those of black colour/race. Overweight and obesity had a stronger relationship with children living in the South, Southeast and Central-West, in males, in those from urban areas, in those of Caucasian colour/race, in those aged 3 years and in those from families with intermediate income ranges. Overweight and obesity showed a heter-ogeneous spatial distribution amongst Brazilian states. A nutritional epidemiological polarisation that presents a major challenge for public health is indicated: we must reduce nutritional deficiencies and promote healthy eating habits from childhood to improve the nutritional and epidemiological
profiles and mortality of the population.
Key words Child, Nutritional status, Nutritional
epidemiology, Demographic surveys
Ingrid Freitas da Silva Pereira 1
Lára de Melo Barbosa Andrade 2
Maria Helena Constatino Spyrides 2
P
er
eir
Introduction
Since the second half of the twentieth century, Brazil has experienced significant demographic changes1 and changes to its populational
morbid-ity-mortality and disability profiles. However, in contrast to developed countries, the Brazilian ep-idemiological transition has been marked by the simultaneous existence of high rates of morbidity and mortality from chronic non-communicable diseases (CNCDs) and the permanence or resur-gence of infectious and parasitic diseases2.
Changes in the demographic and epidemio-logical profiles of the population are reflected by a decline in the prevalence of malnutrition and the significant prevalence of overweight/obesity, characterising the progression known as the nu-tritional transition3. Between 1974 and 2003, the
nutritional epidemiological panorama in Brazil changed significantly, with a notable 72% cumu-lative decline in stunting in children under 54.
Childhood obesity remained stable in the peri-ods between 1974-1975 and 2006-2007, with per-centages of approximately 6 to 7%. However, this trend does not apply to other populational age groups, such as adolescents and adults, in whom the prevalence of obesity increased substantially over the same period5.
Globally, in 2011, approximately 101 million children under 5 years of age were underweight, whereas in 2013, an estimated 42 million chil-dren worldwide (6.3%) in that same age group were overweight. Malnutrition is linked to more than 1/3 of all deaths in children worldwide, al-though it is rarely listed as a direct cause. Obesity, in turn, is considered 1 of the 4 principal risk fac-tors for CNCDs, and it is more damaging the ear-lier it occurs. Therefore, it is important to study children’s nutritional status, given the demon-strated association of nutritional conditions in the infant-juvenile phase with health levels in adulthood6,7.
Children’s nutritional status is considered an important tool in gauging a population’s health conditions and quality of life8. Considering its
complex and multifactorial character9, a child’s
nutritional status is determined by the popula-tion’s living conditions, particularly regarding social and economic aspects10,11.
By contrast, children’s nutritional conditions are associated with short- and long-term individ-ual and collective consequences, including lower height in adulthood, lower school performance, increased morbidity and mortality, reduced pro-ductivity in adulthood and risk of chronic
dis-ease. Child growth patterns are, therefore, strong predictors of future human capital, social pro-gress and the health of future generations12,13.
It is essential to know how malnutrition, obesity and their intervening factors affect the population so that health care models can be developed that are based on the individual as a whole and the environment in which she/he lives. Against this backdrop, the objective of this study was to evaluate the nutritional status of children under 5 years of age in Brazil in 2009 and to iden-tify discrepancies and peculiarities regarding so-cial and demographic aspects.
Methods
This was a cross-sectional population-based study, in which the population of interest was children under 5 years of age who participat-ed in the 2008-2009 Household Budget Survey (Pesquisa de Orçamento Familiar – POF) of the Brazilian Institute of Geography and Statistics (Instituto Brasileiro de Geografia e Estatística - IBGE); in total, 14,569 children were included.
In planning the POF sample, complex sam-pling procedures were employed involving ge-ographical stratification and statistics derived from the collection of national census tracts, the random selection of groups of sectors within strata and the random selection of households within sectors. Following the selection of sectors and households, the sectors were distributed over the 4 survey quarters, ensuring that in all quar-ters, geographical and socioeconomic strata were represented by the selected households14.
Each household belonging to the POF sam-ple represents a certain number of permanent private households of the population (universe) from which this sample was selected. In this man-ner, each household in the sample is associated with a sample weight or expansion factor, which, when attributed to the characteristics investigat-ed in the study, provides estimates for the values of interest in the study universe. To calculate es-timates for the variables of interest, the adjusted expansion factors provided with the survey data by the IBGE were used in this study.
aúd
e C
ole
tiv
a,
22(10):3341-3352,
2017
The weight, height, age and gender variables were used to classify nutritional status. These were processed using the WHO Anthro15 software
to obtain the z-scores for each child, adopting the growth curves proposed by the World Health Or-ganisation (WHO)16 as a reference. Nutritional
diagnosis was determined from 3 anthropomet-ric indices: height-for-age (H/A), weight-for-age (W/A) and weight-for-height (W/H).
Using the z-score statistical criterion and the classification recommended by the Food and Nu-trition Surveillance System (Sistema de Vigilân-cia Alimentar e Nutricional - SISVAN)17, children
whose H/A, W/A and W/H indices had z-scores lower than -2.0 were classified as stunted, under-weight or thin, respectively; children with W/H index z-scores greater than or equal to -2.0 and less than or equal to +2.0 were classified as eu-trophic. The W/H ratio was also used to rate chil-dren whose index z-score value was greater than +2.0 and less than or equal to +3.0 as overweight and children with z-scores greater than +3.0 as obese.
If at least 1 of the 3 indices used in this study had values considered biologically implausible (outliers) for a child, this was considered an ex-clusion criterion according to the method pro-posed by the WHO Anthro15 software. The
fol-lowing cut-off points were used for exclusion: z < -6 or > 5 for the W/A index; z < -5 or > 5 for the W/H index; and z < -6 or > 6 for the H/A in-dex. A total of 14,013 of the 14,569 children were thus included in this study, representing a loss of 3.8%.
The sociodemographic variables used in the study were as follows: gender (male, female), age (0, 1, 2, 3, 4 years), race/colour (Caucasian, black, Asian, mixed race, indigenous), home location (urban, rural), monthly per capita family income in minimum salaries (< ¼, ¼ to ½, ½ to 1, 1-5, > 5), macro-region (North, Northeast, South-east, Central-West, South) and state (or “Feder-al Unit”) (Rondônia, Acre, Amazonas, Roraima, Amapá, Tocantins, Maranhão, Piaui, Ceará, Rio Grande do Norte, Paraíba, Pernambuco, Alagoas, Sergipe, Bahia, Minas Gerais, Espírito Santo, Rio de Janeiro, São Paulo, Paraná, Santa Catarina, Rio Grande do Sul, Mato Grosso do Sul, Mato Gros-so, Distrito Federal).
To classify the monthly per capita family in-come, the value expressed in the consumer unit per capita income variable was divided by the value corresponding to 1 minimum salary on the survey reference date (15 January 2009), which was R$ 415.00.
The Statistical Package for Social Science (SPSS), version 20, was used for data analysis. Pearson’s chi-square test and logistic regres-sion models were used in the first stage of the study to evaluate associations between the de-pendent variables W/A, H/A and W/H and the explanatory variables represented by social and demographic information (age, gender, colour/ race, home location, monthly family per capi-ta income and macro-region). A binary logistic regression was used for the W/A and H/A vari-ables, and a multinomial logistic regression was used for the W/H variable, with eutrophic as a reference category.
First, the chi-square test was applied to iden-tify which explanatory variables were signifi-cantly associated with the response variables. The variables that were statistically significant at 20% were then included in the logistic regres-sion model, with those that were significant after the stepwiseselection method remaining in the final model, when the odds ratio values were es-timated with their confidence intervals. The level of statistical significance adopted in the logistic regression analysis was 5% (p < 0.05).
In the second stage of the study, sets of re-lationships were explored by applying a corre-spondence analysis between socioeconomic and demographic factors and the child’s nutritional status, based on the categorised W/H variable. The software XLSTATwas used for this analysis.
A correspondence analysis is an exploratory statistical technique used to examine associations or similarities between qualitative or categorical variables. Using a graphical representation, the spatial positions of the categories of each variable on a multi-dimensional map can be interpreted as associations, in which variables perceived as similar or associated are allocated to closer points on the map, and those perceived as not similar are represented by distant points18.
The application of a correspondence analy-sis is very appropriate in population data stud-ies and cross-sectional designs because it allows the association between variables to be explored without assuming a causal relationship between them and without assuming a probability distri-bution19.
Results
P
er
eir
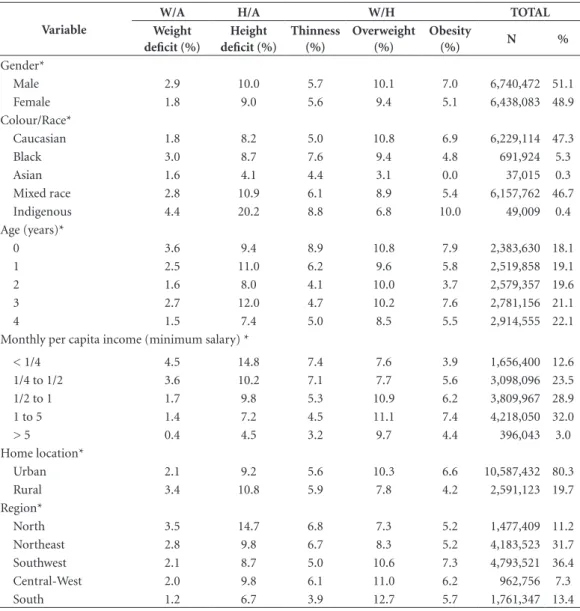
(4.4% and 20.2%, respectively), those residing in rural areas (3.4% and 10.8%, respectively) and those in the North (3.5% and 14.7%, respective-ly) and Northeast (2.8% and 9.8%, respectiverespective-ly). The Central-West region also showed high rates of stunting (9.8%) (Table 1).
Weight deficits, measured by the W/A ratio, and thinness, defined by the W/H index, were more prevalent in children under 1 year of age, at 3.6% and 8.9%, respectively. Stunting was higher among children 3 of years of age (12.0%). For all analysed indices, the monthly per capita income variable showed deficit prevalence levels
that were inversely proportional to the income increase (Table 1).
Overweight and obesity were more prevalent in male children (10.1% and 7.0%, respectively), those belonging to families with intermediate in-come levels of ½ to 1 minimum salary per capita (10.9% and 6.2%, respectively) and 1 to 5 mini-mum salaries per capita (11.1% and 7.4%, respec-tively), those residing in urban areas (10.3% and 6.6%, respectively) and those in the South, Mid-west and Southeast (12.7%, 11.0% and 10.6%, respectively, for overweight and 5.7%, 6.2% and 7.3%, respectively, for obesity) (Table 1).
Table 1. Prevalences of weight and height deficits, thinness, overweight and obesity in children under 5 years of age. Brazil, 2009.
Variable
W/A H/A W/H TOTAL
Weight deficit (%)
Height deficit (%)
Thinness (%)
Overweight (%)
Obesity
(%) N %
Gender*
Male 2.9 10.0 5.7 10.1 7.0 6,740,472 51.1
Female 1.8 9.0 5.6 9.4 5.1 6,438,083 48.9
Colour/Race*
Caucasian 1.8 8.2 5.0 10.8 6.9 6,229,114 47.3
Black 3.0 8.7 7.6 9.4 4.8 691,924 5.3
Asian 1.6 4.1 4.4 3.1 0.0 37,015 0.3
Mixed race 2.8 10.9 6.1 8.9 5.4 6,157,762 46.7
Indigenous 4.4 20.2 8.8 6.8 10.0 49,009 0.4
Age (years)*
0 3.6 9.4 8.9 10.8 7.9 2,383,630 18.1
1 2.5 11.0 6.2 9.6 5.8 2,519,858 19.1
2 1.6 8.0 4.1 10.0 3.7 2,579,357 19.6
3 2.7 12.0 4.7 10.2 7.6 2,781,156 21.1
4 1.5 7.4 5.0 8.5 5.5 2,914,555 22.1
Monthly per capita income (minimum salary) *
< 1/4 4.5 14.8 7.4 7.6 3.9 1,656,400 12.6
1/4 to 1/2 3.6 10.2 7.1 7.7 5.6 3,098,096 23.5
1/2 to 1 1.7 9.8 5.3 10.9 6.2 3,809,967 28.9
1 to 5 1.4 7.2 4.5 11.1 7.4 4,218,050 32.0
> 5 0.4 4.5 3.2 9.7 4.4 396,043 3.0
Home location*
Urban 2.1 9.2 5.6 10.3 6.6 10,587,432 80.3
Rural 3.4 10.8 5.9 7.8 4.2 2,591,123 19.7
Region*
North 3.5 14.7 6.8 7.3 5.2 1,477,409 11.2
Northeast 2.8 9.8 6.7 8.3 5.2 4,183,523 31.7
Southwest 2.1 8.7 5.0 10.6 7.3 4,793,521 36.4
Central-West 2.0 9.8 6.1 11.0 6.2 962,756 7.3
South 1.2 6.7 3.9 12.7 5.7 1,761,347 13.4
Source: POF (2008-2009). IBGE.
aúd
e C
ole
tiv
a,
22(10):3341-3352,
2017
The low prevalence of overweight and obesi-ty in Asian children was also striking (3.1% and 0.0%, respectively), along with a marked prev-alence of obesity among indigenous children (10.0%) and overweight in Caucasians (10.8%) (Table 1).
The binary logistic regression model (Table 2) revealed that all colour/race categories, ex-cept for black in the case of stunting and Asian for both deficits (weight and height), had great-er odds of developing nutritional deficits than Caucasian children. Those most likely to present some deficit were indigenous children, whose
re-sult for stunting was almost double that of Cau-casians (OR = 1.754, 95% CI 1.714 to 1.794).
Children of 4 years of age had a reduced chance of having deficits compared to children of all other ages, particularly those younger than 1 year of age for a weight deficit and those 3 years of age for a height deficit. The income variable continued to demonstrate an inverse association with weight and height deficits, indicating that the lower the income level, the greater the chance of the child developing a nutritional deficiency. This association was almost 10 times higher for the group of up to ¼ minimum salary regarding
Table 2. Odds ratios (ORs) and confidence intervals (95% CIs) of weight/height deficits in the binary logistic regression model with weight-for-age and height-for-age indices as dependent variables. Brazil, 2009.
Variable WEIGHT-FOR-AGE HEIGHT-FOR-AGE
OR CI (95%) OR CI (95%)
Gender*
Male 1.628 1.615 1.640 1.107 1.103 1.111
Female 1.00 - - 1.00 -
-Colour/Race*
Caucasian 1.00 - - 1.00 -
-Black 1.302 1.282 1.323 0.927 0.919 0.936
Asian 0.818 0.753 0.889 0.464 0.440 0.489
Mixed race 1.166 1.157 1.176 1.124 1.119 1.128
Indigenous 1.391 1.330 1.454 1.754 1.714 1.794
Age (years)*
0 2.509 2.480 2.539 1.291 1.283 1.299
1 1.782 1.760 1.804 1.554 1.544 1.563
2 1.144 1.129 1.160 1.083 1.077 1.090
3 1.819 1.797 1.841 1.693 1.684 1.703
4 1.00 - - 1.00 -
-Monthly per capita income (minimum salaries)*
< 1/4 9.568 9.106 10.052 3.493 3.437 3.549
1/4 to 1/2 7.782 7.409 8.173 2.241 2.206 2.276
1/2 to 1 3.762 3.582 3.952 2.197 2.163 2.231
1 to 5 3.201 3.047 3.362 1.638 1.613 1.664
> 5 1.00 - - 1.00 -
-Home location*
Urban 1.00 - - 1.00 -
-Rural 1.114 1.104 1.124 0.916 0.912 0.921
Region*
North 1.908 1.876 1.941 1.901 1.886 1.917
Northeast 1.472 1.449 1.495 1.183 1.174 1.191
Southeast 1.625 1.600 1.650 1.257 1.248 1.265
Central-West 1.468 1.439 1.498 1.394 1.381 1.407
South 1.00 - - 1.00 -
P
er
eir
stunting (OR = 9.568, 95% CI 9.106 to 10.052) and almost 4 times higher regarding low weight (OR = 3.493, 95% CI 3.437 to 3.549) (Table 2).
Children of any other Brazilian region were more likely to have deficits than those living in the South region, with special emphasis on the North, where the chances are almost double compared to the South (low weight: OR = 1.908; 95% CI 1.876 to 1.941; stunting: OR = 1.901, 95% CI 1.886 to 1.917) (Table 2).
The multinomial logistic regression model (Table 3) revealed that males of all age groups had higher odds of developing overweight and obesity than 4-year-old children, except those 3 years old for obesity. Those from urban areas also had higher odds of developing overweight and obesity than those from rural areas. All other ge-ographical regions had lower odds of becoming overweight and higher odds of being obese than those from the South.
Because the Asian race category did not have children with obesity, it was grouped with the mixed-race category in the multinomial logistic regression model, given the similarity between the 2 regarding children’s nutritional status pat-terns. After this data grouping adjustment, all other categories had lower odds of becoming overweight and obese than Caucasians, except obesity for indigenous children (OR = 1.893, 95% CI 1.836 to 1.952) (Table 3).
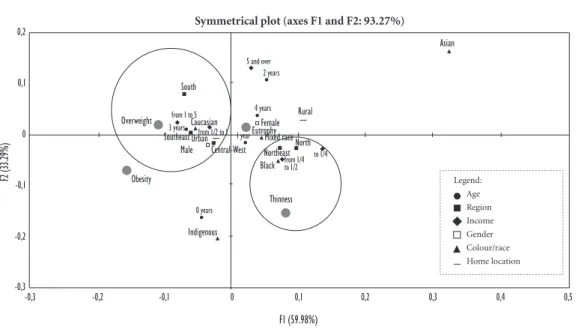
The results of the correspondence analysis (Figure 1) were in line with those found when the logistic regression models were applied. For the thinness classification (W/H deficit), there was a stronger relationship with children from the North and Northeast regions, those belonging to families with lower levels of per capita income (up to ¼ minimum salary and ¼ to ½ minimum salary) and those of black colour/race.
In the upper left quadrant of Figure 1, over-weight appears to be more closely related to the children from the South, Southeast and Cen-tral-West regions, to males, to those residing in the country’s urban strata, to Caucasians, to those aged 3 and to those belonging to families with intermediate per capita income levels (½ to 1 minimum salary and from 1 to 5 minimum salaries).
The positions of children under 1 year of age and indigenous children should also be noted. They are located between obesity and thinness, showing a high percentage of these 2 deficits in children belonging to these social groups.
Figure 2 shows the correlation analysis be-tween the W/H index and Federal Units. The
states that were most closely associated with thin-ness were Roraima, Maranhão, Amapá, Amazo-nas, Alagoas, Pernambuco and the Federal Dis-trict. These associations corroborate the above findings; notably, most of these states are located in the North and Northeast regions. The states most closely related to excess weight were San-ta CaSan-tarina, Paraná, São Paulo, Rio Grande do Sul, Espírito Santo, Mato Grosso do Sul, Paraíba, Minas Gerais, Goiás and Ceará. Notably, most of the Federal Units that were associated with excess weight are located in the Southeast, South and Central-West, with the exception of 2 states in the Northeast. The states associated most closely with obesity were Rio de Janeiro, Mato Grosso, Ceará, Alagoas, Amazonas and Amapá.
Discussion
The main results of this study demonstrate that children’s nutritional deficits are highly linked to the socioeconomic conditions in which they live. By contrast, the overweight and obesity distribu-tions had a more complex character, demonstrat-ing heterogeneous prevalences in widely different population groups.
A study evaluating the trend of linear growth retardation in children younger than 5 years of age in Brazil, Batista Filho and Rissin5
demon-strated a sharp decline in stunting in 1975, 1989 and 1996, although there was a higher prevalence in the rural stratum than in the urban stratum and in the North and Northeast regions than in the Central-South. In this study, the North pre-sented much greater weight and height deficit levels than other regions. However, regarding stunting, the Northeast region had a percentage similar to those recorded in the Southeast and Central-West, demonstrating that the Northeast has been able to improve child nutrition levels, albeit more slowly than the macro-regions situ-ated in the Central-South of the country.
Monteiro et al.20 corroborated the findings of
this study when identifying the high risk of expo-sure to malnutrition in the under 5 population in the North. In other macro-regions of the coun-try, the value was moderate and very homoge-nous. They also noted the substantial reduction in the risk of child malnutrition, particularly in the Northeast, between 1996 and 2006.
aúd
e C
ole
tiv
a,
22(10):3341-3352,
2017
considerable proportion of the funds transferred is destined for the purchase of food and to meet health care demands, due to conditions existing in these programs21.
Monteiro et al.22 evaluated the effects of the
Bolsa Família cash transfer programme on child malnutrition using data collected in the “Chama-da Nutricional 2005” survey conducted in the Brazilian semi-arid region. They used adjusted prevalence estimates of H/A deficits and found that for children under 5 years of age, as a whole, participation in the programme resulted in a re-duction of almost 30% in the frequency of mal-nutrition.
Specifically, in low-income families, the ef-fects of the Bolsa Família Program, for example, have translated into higher household spending on food, greater availability of freshor minimally processed foods and a greater availability of foods that usually diversify and improve the nutritional quality of a diet, such as meat, tubers and vege-tables23. The repercussions of these programmes
may have positively affected the nutritional sta-tus profile of Northeastern children, given that this region has the largest number of beneficiary families in the programme.
However, this greater availability of food may affect children’s weight gain in an inappropriate
Table 3. Odds ratios (ORs) and confidence intervals (95% CIs) of the multinomial logistic regression model with weight-for-height index as the dependent variable (reference category = eutrophic). Brazil, 2009.
Variable
Nutritional status Thinness
OR (95% CI)
Overweight OR (95% CI)
Obesity OR (95% CI) Gender*
Male 1.043 (1.038 - 1.048) 1.109 (1.105 - 1.113) 1.419 (1.412 - 1.425)
Female 1.00 1.00 1.00
Colour/Race*
Caucasian 1.00 1.00 1.00
Black 1.365 (1.352 - 1.379) 0.962 (0.953 - 0.970) 0.726 (0.718 - 0.735)
Mixed race and Asian 1.041 (1.036 - 1.047) 0.929 (0.925 - 0.933) 0.830 (0.825 - 0.834)
Indigenous 1.542 (1.494 - 1.593) 0.923 (0.890 - 0.956) 1.893 (1.836 - 1.952)
Age (years)*
0 2.027 (2.013 - 2.042) 1.402 (1.393 - 1.410) 1.561 (1.550 - 1.572)
1 1.311 (1.301 - 1.321) 1.150 (1.143 - 1.157) 1.060 (1.052 - 1.067)
2 0.833 (0.827 - 0.840) 1.138 (1.132 - 1.145) 0.663 (0.658 - 0.669)
3 0.996 (0.988 - 1.004) 1.258 (1.251 - 1.266) 1.441 (1.431 - 1.451)
4 1.00 1.00 1.00
Monthly per capita income (minimum salaries) *
< 1/4 2.207 (2.165 - 2.250) 1.009 (0.997 - 1.022) 1.174 (1.153 - 1.195)
1/4 to 1/2 2.126 (2.086 - 2.166) 0.968 (0.957 - 0.979) 1.553 (1.528 - 1.578)
1/2 to 1 1.698 (1.667 - 1.730) 1.307 (1.292 - 1.321) 1.653 (1.627 - 1.680)
1 to 5 1.504 (1.476 - 1.532) 1.249 (1.235 - 1.263) 1.820 (1.792 - 1.849)
> 5 1.00 1.00 1.00
Home location*
Urban 1.00 1.00 1.00
Rural 0.822 (0.817 - 0.827) 0.823 (0.818 - 0.827) 0.694 (0.689 – 0.698)
Region*
North 1.478 (1.463 - 1.494) 0.631 (0.626 - 0.636) 1.054 (1.043 - 1.065)
Northeast 1.432 (1.419 - 1.445) 0.733 (0.728 -0.737) 1.100 (1.091 - 1.109)
Southeast 1.225 (1.214 - 1.235) 0.851 (0.847 - 0.856) 1.314 (1.304 - 1.323)
Central-West 1.441 (1.424 - 1.458) 0.917 (0.909 - 0.924) 1.175 (1.162 - 1.188)
South 1.00 1.00 1.00
P
er
eir
manner. The tendency observed in Brazil to re-place traditional meals based on fresh or mini-mally processed foods by ultraprocessed foods is causing harm to health. Ultraprocessed foods have higher energy density and higher sugar,
to-tal fat, saturated fat and trans-fat contents and lower fibre and potassium contents24.
This discussion highlights an emerging chal-lenge for public health: to promote educational interventions in health, more specifically in Food
Figure 2. Correspondence analysis applied to the weight-for-height index and Federal Units in children under 5 years of age. Brazil, 2009.
Overweight Obesity
Thinness
Eutrophy Symmetrical plot (axes F1 and F2: 81.46%)
-0,2 -0,1 0
F2
(3
0.2
8%
)
SC PRSP RSGOES
PB MS MG CE MTRJ
AL AM AP
DF PE MA RR
TO SE PA PI BA
RO RN AC
0,1 0,2 0,3 0,4
-0,6 -0,5 -0,4 -0,3 -0,2 -0,1 0 0,1 0,2 0,3 0,4 0,5
F1 (51.18%)
Figure 1. Correspondence analysis applied to the weight-for-height index and sociodemographic variables of children under 5 years of age. Brazil, 2009.
F1 (59.98%)
Legend: Age Region Income Gender Colour/race Home location
Asian
Overweight
Obesity
Thinness
Indigenous
0 years
Male Central-West
South
from 1 to 5
Caucasian
3 years from 1/2 to 1
Southeast Urban
2 years
4 years Rural
Northeast North
to 1/4 from 1/4 to 1/2
Black
5 and over
Female Eutrophy
1 year Mixed race
Symmetrical plot (axes F1 and F2: 93.27%)
-0,3 -0,2 -0,1 0 0,1 0,2 0,3 0,4 0,5
-0,3 -0,2 -0,1 0 0,1 0,2
F2
(3
3.2
9%
aúd
e C
ole
tiv
a,
22(10):3341-3352,
2017
and Nutrition Education, through viewing eating behaviour as the result of social and historical re-lationships and thus overcoming its biomedical roots25 and promoting the autonomous and
vol-untary practice of healthy eating habits26.
The effect of socioeconomic status on infant growth has been observed in different contexts in the Brazilian population and is already signif-icantly represented in the literature, which con-firms this relationship11,27-30. Family income has
a frequent significant inverse association with nutritional deficit situations. Using data from the National Demographic and Health Survey (Pesquisa Nacional de Demografia e Saúde – PNDS) from 1996 and 2006, Monteiro et al.28
identified improvements in household purchas-ing power as a determinant responsible for 21.7% of the total decline in the prevalence of malnutri-tion in children under 5 years of age observed in Brazil between 1996 and 2006.
The data from this study revealed a higher prevalence of nutritional deficits in male chil-dren than in female chilchil-dren. Other studies with more specific aggregation levels obtained similar results27,31. One study suggests that boys appear
to be more vulnerable to malnutrition in an en-vironment unfavourable to growth31.
Regarding the high prevalence of weight and particularly height deficits in indigenous children, as in this study, research conducted in various indigenous villages and communities across the country has reported results that re-veal prevalences of stunting, in particular, that are well above the national average32,33.
Howev-er, although reports of malnutrition, in general, characterise children’s anthropometric profiles among indigenous peoples, the increase in chil-dren with obesity in this population merits par-ticular attention. Evaluating the nutritional sta-tus of indigenous children from Alto Xingu, and in a study of the nutritional profile of indigenous Kaingáng children, Mondini et al.34 and Kuhl et
al.35, respectively, also found a marked
percent-age of overweight, similar to that observed in this study. The authors also noted that these findings are not isolated cases in the indigenous context and note that recent studies have identified cases of overweight amongst children from different indigenous groups.
Westernisation of the diet, marked by the re-placement of traditional eating habits, and the incorporation of practices from the urban popu-lation, particularly in relation to processed foods, along with a reduction in physical activity levels, may represent changes in the lifestyle of
indige-nous peoples indicative of a food and nutritional transition, possibly resulting in significant reper-cussions for the epidemiological profile of this population in the future36,37.
This study also shows that with regard to age group, the prevalence of a deficit was higher in children under 1 compared to almost all oth-er age groups except for children aged between 1 and 3 for the (H/A) index. The onset of mal-nutrition usually occurs between the fourth and sixth month of a child’s life, when the transition to complementary foods may be inadequate re-garding quality and quantity, and also exposes the child to infections, particularly diarrhoea, making this age group increasingly vulnerable38,39.
The greatest weight and height growth rates occur at 2 stages of an individual’s life: in the first 2 years of age and in adolescence; the former is the period most vulnerable to growth disorders40.
When a child of this age group develops a health problem, it can compromise both weight and height. Children can recover from a weight defi-cit fully, with no harm to the weight expected ac-cording to the individual’s genetic potential. The full recovery of a height deficit is more complex and may even lead to significant consequences in later life, such as the onset of chronic diseases in adulthood41,42.
An important finding of this study was the manner in which overweight and obesity ap-peared to be distributed across diverse popula-tion groups, demonstrating their heterogeneous and complex character. A study based on PNDS - 2006 data also revealed higher prevalences of overweight in children under 5 in all Brazilian re-gions, with the highest percentages in the South (9.3%) and the lowest percentages in the North region (5.1%)43.
Additionally, regarding spatial distribution, the urban stratum demonstrated a significantly higher prevalence of overweight than the rural stratum. This pattern may be particularly at-tributed to differences in access to food, health services, physical activity patterns and social norms between these strata44.
The heterogeneous pattern of overweight and obesity among the various regions and pop-ulation groups in Brazil reflects the enormous physical, socioeconomic and cultural diversity of the country. This heterogeneous pattern makes deconstructing the idea of obesity as a disease of developed countries or socially advantaged groups important45.
P
er
eir
once the only nutritional disorder. States in the North and Northeast known to have less eco-nomic power, such as Alagoas, Ceará, Amazonas and Amapá, were associated with this condition.
The increased obesity in groups with lower income levels appears to reflect a lack of knowl-edge regarding obesity-related damage, as well as unequal access to physical activity and proper nutrition regarding both quality and quantity. Such inequalities impose a pattern of poor nu-trition on low income groups. It is increasingly common to observe adherence to a healthier diet and the practice of physical activity in more priv-ileged social groups45.
Furthermore, although a decline in malnu-trition is evident, it remains prevalent in Brazil in the most severe forms, particularly regarding H/A deficits. These are more serious in the North but also appear in pockets of poverty in other re-gions, characterising malnutrition as a result of social inequality and poverty in the country46.
Furthermore, regarding stunting, which re-flects the chronicity of malnutrition, a higher percentage was found than that expected in a healthy reference population, i.e., 2.3%, in all sub-categories analysed in this study17.
The persistence of this deficit in the Brazil-ian population, coexisting with the growing and widespread distribution of obesity, speaks to the phenomenon of epidemiological polarisation and indicates that, although occurring at an ac-celerated pace, the nutritional transition process in Brazil is not yet complete. It coexists with the reduction in malnutrition associated with a decrease in the occurrence of communicable diseases, characterising the third phase of nutri-tional transition, known as “hunger reduction.” However, concomitantly, there is an increase in obesity and related CNCDs, both in low-income populations and in those with greater purchasing power, characterising the fourth phase of the nu-tritional transition47.
A possible limitation of this study is the per-centage (3.8%) of children excluded from the sample because they had biologically implausible z-score values (outliers). The WHO recognises anthropometric surveys in which the proportion of biologically implausible values does not exceed 1% of individuals studied to be good quality48.
However, despite this limitation, the importance of this study must be stressed, given the reduced number of studies using population databases as comprehensive as the POF, which allows the investigation of anthropometric and nutritional aspects at a territorial level and that are not re-stricted to local realities or specific groups. More-over, there was no significant selective loss related to the explanatory variables, which allows making statistical inferences without losing test power.
The results of this study show that in parallel to the phenomenon of epidemiological polar-isation, Brazil is experiencing a nutritional epi-demiological polarisation, marked by the per-sistence of malnutrition in certain regions and population groups and the diffuse distribution of overweight, which is indiscriminately reaching the most diverse population groups. In this sense, this study presents a dualised agenda for public health, which must seek to reduce nutritional deficiencies and thus malnutrition, but which concentrates on food and nutrition education as a strategy to promote healthy eating habits from childhood, thus changing the nation’s nutritional and epidemiological profile and mortality.
aúd
e C
ole
tiv
a,
22(10):3341-3352,
2017
Collaborations
IFS Pereira and MHC Spirydes participated in the design and delineation of the study, analysis and interpretation of the data and the writing of the article. LMB Andrade participated in the de-sign and development of the study, contributing to the application of statistical methods, analysis of results and final writing of the text. CO Lyra participated in the interpretation of the data and writing of the article.
References
1. Carvalho JAM, Wong LLR. A transição da estrutura etária da população brasileira na primeira metade do século XXI. Cad Saude Publica 2008; 24(3):597-605. 2. Araújo JD. Polarização epidemiológica no Brasil.
Epi-demiol Serv Saúde 2012; 21(4):533-538.
3. Guimarães LV, Barros MBA. As diferenças de estado nutricional em pré-escolares de rede pública e a transi-ção nutricional. J Pediatr 2001; 77(5):381-386. 4. Batista Filho M, Rissin A. A transição nutricional no
Brasil: tendências regionais e temporais. Cad Saude
Pu-blica 2003; 19(Supl. 1):181-191.
5. Victora CG, Aquino EML, Leal MC, Monteiro CA, Barros FC, Szwarcwald CL. Maternal and child health in Brazil: progress and challenges. Lancet 2011; 377(9780):1863-1876.
6. World Health Organization (WHO). Essential nutri-tion acnutri-tions: improving maternal, newborn, infant and
young child health and nutrition. Geneva: WHO; 2013
7. World Health Organization (WHO). Global status
re-port on noncommunicable diseases 2014. Geneva: WHO;
2014.
8. United Nations Children´s Fund. Tracking progress on child and maternal nutrition: a survival and
develop-ment priority. New York: Unicef; 2009.
9. Jesus GM, Castelão ES, Vieira TO, Gomes DR, Vieira GO. Déficit nutricional em crianças de uma cidade de grande porte do interior da Bahia, Brasil. Cien
Sau-de Colet 2014; 19(5):1581-1588.
10. Martins IS, Marinho SP, Oliveira DC, Araújo EAC. Po-breza, desnutrição e obesidade: inter-relação de esta-dos nutricionais de indivíduos de uma mesma família.
Cien Saude Colet 2007; 12(6):1553-1565.
11. Monteiro CA, Benicio MHDA, Conde WL, Konno S, Lovadino AL, Barros AJD, Victora CG. Narrowing so-cioeconomic inequality in child stunting: the Brazilian experience, 1974-2007. Bull World Health Organ 2010; 88(4):305-311.
12. Black RE, Allen LH, Bhutta ZA, Caulfield LE, Onis M, Ezzati M, Mathers C, Rivera J. Maternal and child un-dernutrition: global and regional exposures and health consequences. Lancet 2008; 371(9608):243-260. 13. Victora CG, Adair L, Fall C, Hallal PC, Martorell R,
Richter L, Sachdev HS. Maternal and child undernutri-tion: consequences for adult health and human capital.
Lancet 2008; 371(9609):340-357.
14. Instituto Brasileiro de Geografia e Estatística (IBGE).
Pesquisa de Orçamentos Familiares 2008-2009: antro-pometria e estado nutricional de crianças, adolescentes e
adultos no Brasil. Rio de Janeiro: IBGE; 2010.
15. World Health Organization (WHO). WHO Anthro. [computer program]. Version 3.2.2, January 2011. Ge-neva: WHO; 2011.
16. World Health Organization (WHO). WHO child growth standards: Length/height-for-age, for-age, weight-for-length, weight-for-height and body mass
index-for-age. Methods and development. Geneva: WHO; 2006.
17. Brasil. Ministério da Saúde (MS). Orientações para a coleta e análise de dados antropométricos em serviços de saúde: Norma Técnica do Sistema de Vigilância
Alimen-tar e Nutricional - SISVAN. Brasília: MS; 2011.
P
er
eir
19. Greenacre MJ. Practical Correspondence Analysis. In: Barnett V. Looking at Multivariate Data. New York: J. Wiley & Sons; 1981. p. 119-146.
20. Monteiro CA, Conde WL, Konno SC, Lima ALL, Silva ACF, Benicio MHDA. Avaliação antropométrica do es-tado nutricional de mulheres em idade fértil e crianças menores de cinco anos. In: Brasil. Ministério da Saú-de (MS). Pesquisa Nacional de Demografia e Saúde da Criança e da Mulher – PNDS 2006: dimensões do
proces-so reprodutivo e da saúde da criança. Brasília: MS; 2009.
p. 214-230.
21. Burlandy L. Transferência condicionada de renda e se-gurança alimentar e nutricional. Cien Saude Colet 2007; 12(6):1441-1451.
22. Monteiro CA, Conde WL, Konno SC. Análise do in-quérito Chamada Nutricional 2005. In: Ministério do Desenvolvimento Social e Combate à Fome,
organiza-dor. Chamada Nutricional: um estudo sobre a situação
nutricional das crianças no semi-árido brasileiro.
Brasí-lia: Ministério do Desenvolvimento Social e Combate à Fome; 2006. p. 29-36.
23. Martins APB. Impacto do Programa Bolsa Família sobre a aquisição de alimentos em famílias brasileiras de baixa
renda [tese]. São Paulo: Faculdade de Saúde Pública;
2013.
24. Louzada MLC, Martins APB, Canella DS, Baraldi LG, Levy RB, Claro RM, Moubarac JC, Cannon G, Montei-ro CA. Alimentos ultrapMontei-rocessados e perfil nutricional da dieta no Brasil. Rev Saude Publica 2015; 49(38):1-11. 25. Mancuso AMC, Vincha KRR, Santiago DA. Educação
Alimentar e Nutricional como prática de interven-ção: reflexão e possibilidades de fortalecimento. Physis
2016; 26(1):225-249.
26. Brasil. Ministério do Desenvolvimento Social e Com-bate à Fome. Marco de Referência de Educação
Alimen-tar e Nutricional para as Políticas Públicas. Brasília:
Mi-nistério da Saúde; 2012.
27. Menezes RCE, Lira PIC, Leal VS, Oliveira JS, Santana SCS, Sequeira LAS, Rissin A, Batista Filho M. Determi-nantes do déficit estatural em menores de cinco anos no Estado de Pernambuco. Rev Saude Publica 2011; 45(6):1079-1087.
28. Monteiro CA, Benicio MHDA, Konno SC, Silva ACF, Lima ALL, Conde WL. Causas do declínio da desnu-trição infantil no Brasil, 1996-2007. Rev Saude Publica
2009; 43(1):35-43.
29. Lima ALL, Silva ACF, Konno SC, Conde WL, Benicio MHDA, Monteiro CA. Causas do declínio acelerado da desnutrição infantil no Nordeste do Brasil (1986-1996-2006). Rev Saude Publica 2010; 44(1):17-27.
30. Ramos CV, Dumith SC, César JA. Prevalence and factors associated with stunting and excess weight in children aged 0-5 years from the Brazilian semi-arid region. J Pediatr 2015; 91(2):175-182.
31. Vitolo MR, Gama CM, Bortolini GA, Campagnolo PDB, Drachler ML. Alguns fatores associados a excesso de peso, baixa estatura e déficit de peso em menores de 5 anos. J Pediatr 2008; 84(3):253-262.
32. Santos Junior MS. Consequências de um encontro: a insegurança alimentar das populações indígenas brasi-leiras e a relação de contato com a sociedade nacional. In: Taddei JAAC, Viana K, Vitalle MSS, organizadores.
Jornadas cientificas do NISAN: Núcleo
Interdepartamen-tal de Segurança Alimentar e Nutricional 2008/2009.
Ba-rueri: Minha Editora; 2013. p. 79-98.
33. Leite MS. Transformação e persistência: antropologia da alimentação e nutrição em uma sociedade indígena
ama-zônica. Rio de Janeiro: Editora Fiocruz; 2007.
34. Mondini L, Rodrigues DA, Gimeno SGA, Baruzzi RG. Estado nutricional e níveis de hemoglobina em crian-ças Aruak e Karibe – povos indígenas do Alto Xingu, Brasil Central, 2001- 2002. Rev Bras Epidemiol 2009; 12(3):469-477.
35. Kühl AM, Corso ACT, Leite MS, Bastos JL. Perfi l nutri-cional e fatores associados à ocorrência de desnutrição entre crianças indígenas Kaingáng da Terra Indígena de Mangueirinha, Paraná, Brasil. Cad Saude Publica 2009; 25(2):409-420.
36. Castro TG, Schuch I, Conde WL, Veiga J, Leite MS, Du-tra CLC, Zuchinali P, Barufaldi LA. Estado nutricional dos indígenas Kaingáng matriculados em escolas in-dígenas do Estado do Rio Grande do Sul, Brasil. Cad
Saude Publica 2010; 26(9):1766-1776.
37. Boaretto JD, Molena-Fernades CA, Pimentel GGA. Estado nutricional de indígenas Kaingang e Guarani no estado do Paraná, Brasil. Cien Saude Colet 2015; 20(8):2323-2328.
38. World Health Organization. Multicentre Growth Ref-erence Study Group. Complementary feeding in the WHO Growth Reference Study. Acta Paediatr 2006; 95(Supl. 450):27-37.
39. Souza MM, Figueroa Pedraza D, Menezes TN. Estado nutricional de crianças assistidas em creches e situação de (in)segurança alimentar de suas famílias. Cien Saude
Colet 2012; 17(12):3425-3436.
40. Spyrides MHC, Struchiner CJ, Barbosa MTS, Kac G. Efeito das práticas alimentares sobre o crescimento in-fantil. Rev Bras Saude Mater Infant 2005; 5(2):145-153. 41. Yanomoto RM, Lopes FM, Pinto MMS, Ito RKL, Iver-sen R, Cunha SR. Retardo de crescimento secundário à desnutrição no segundo ano de vida: há recuperação até a idade escolar? Pediatria 2001; (1):37-44. 42. Hoffman DJ. Growth retardation and metabolic
pro-gramming: implications and consequences for adult health and disease risk. J Pediatr 2014; 90(4):325-328. 43. Meller FO, Araújo CLP, Madruga SW. Fatores
associa-dos ao excesso de peso em crianças brasileiras menores de cinco anos. Cien Saude Colet 2014, 19(3):943-955. 44. Wang Y. Cross-national comparison of childhood
sity: the epidemic and the relationship between obe-sity and socioeconomic status. Int J Epidemiol 2001; 30(5):1129-1136.
45. Ferreira VA, Magalhães R. Obesidade no Brasil: tendên-cias atuais. Rev Port Saúde Pública 2006; 24(2):71-81. 46. Coutinho JG, Gentil PC, Toral N. A desnutrição e
obe-sidade no Brasil: o enfrentamento com base na agenda única da nutrição. Cad Saude Publica 2008; 24(Supl. 2):332-340.
47. Popkin BM. An overview on the nutrition transition and its health implications: the Bellagio meeting. Public
Health Nutr 2002; 5(1A):93-103.
48. World Health Organization (WHO). Physical Status:
The use and interpretation of Anthropometry. Geneva:
WHO; 1995. WHO technical reports series.
Article submitted 03/07/2016 Approved 28/09/2016