Subcortical atrophy in frontotemporal
dementia and Alzheimer’s disease
Significance for differential diagnosis and
correlation with clinical manifestations
Renata Teles Vieira
1, Leonardo Caixeta
2Abstract – Cerebral subcortical atrophy occurs in both Alzheimer’s disease (AD) and frontotemporal dementia (FTD) but its significance for clinical manifestations and differential diagnosis between these common types of dementia has not been extensively investigated. Objectives: To compare the severity of cerebral subcortical atrophy in FTD and AD and to analyze the correlations between cerebral subcortical atrophy and demographics and clinical characteristics. Methods: Twenty three patients with FTD and 21 with AD formed the sample, which comprised 22 men and 22 women, aged 33 to 89, with mean age (±SD) of 68.52±12.08 years, with schooling ranging from 1 to 20 years, with a mean (±SD) of 7.35±5.54 years, and disease duration with a mean (±SD) of 3.66±3.44 years. The degree of cerebral subcortical atrophy was measured indirectly with a linear measurement of subcortical atrophy, the Bifrontal Index (BFI), using magnetic resonance imaging. We evaluated cognition, activities of daily living and dementia severity with the Mini-Mental State Examination, Functional Activities Questionnaire and the Clinical Dementia Rating, respectively. Results: There was no significant difference (p>0.05) in BFI between FTD and AD. The severity of cognitive deficits (for both FTD and AD groups) and level of daily living activities (only for AD group) were correlated with BFI. Conclusions: A linear measurement of cerebral subcortical atrophy did not differentiate AD from FTD in this sample. Cognitive function (in both FTD and AD groups) and capacity for independent living (only in AD group) were inversely correlated with cerebral subcortical atrophy. Key words: frontotemporal dementia, Alzheimer’s disease, structural neuroimaging, subcortical atrophy.
Atrofia subcortical na demência frontotemporal e na doença de Alzheimer: importância para o diagnóstico diferencial e correlações com as manifestações clínicas
Resumo – Atrofia subcortical cerebral ocorre na doença de Alzheimer e na demência frontotemporal (DFT) mas sua importância para as manifestações clínicas e para o diagnóstico diferencial não foram amplamente investigadas.Objetivos: Comparar a gravidade da atrofia subcortical cerebral na DA e na DFT e analisar as correlações entre atrofia subcortical cerebral e características demográficas e clínicas.Métodos: Vinte e três pacientes com diagnóstico de DFT e 21 com DA formaram a amostra que foi constituída por 22 homens e 22 mulheres, com idades entre 33 e 89 anos, idade média (±DP) de 68,52 (±12,08) anos, escolaridade variando de 1 a 20 anos, média de 7,35 (±5,54) e duração da doença com média de 3,66 (±3,44). O grau de atrofia subcortical foi avaliado indiretamente com uma medida linear de atrofia subcortical, o índice bifrontal (IBF) com o emprego de imagem por ressonância magnetica. A cognição, atividades de vida diária e gravidade da demência foram avaliadas com o Mini-Exame do Estado Mental, Questionário de Atividades Funcionais e Escore Clínico de Demência, respectivamente. Resultados: O IBF não foi diferente entre os grupos com AD e DFT (p>0.05). A gravidade do transtorno cognitivo (tanto para DA como DFT) e as atividades de vida diária (apenas para DA) correlacionaram-se com o IBF. Conclusões: Uma medida linear de atrofia subcortical não foi diferente entre pacientes com DA e DFT nesta amostra. A cognição (na DA e na DFT) e a capacidade de vida independente (apenas na DA) correlacionaram-se inversamente com a atrofia subcortical cerebral.
Palavras-chave: demência frontotemporal, doença de Alzheimer, neuroimagem estrutural, atrofia subcortical.
1MSc. Behavioral and Cognitive Neurology Unit, Hospital das Clínicas, Federal University of Goiás, Goiânia (GO), Brazil. 2M.D, Ph.D. Associate Professor
of Neuroscience, Federal University of Goiás (UFG). Coordinator, Cognitive and Behavioral Neurology Unit, Hospital das Clínicas-UFG.
Diagnosis in life, of Alzheimer’s disease (AD) and
Fron-totemporal dementia (FTD) is made on clinical grounds,
but currently used criteria are burdened with considerable
subjective judgments,
1,2and yield an overall accuracy of
81% to 88% in AD cases.³ Given the high prevalence of
both diseases and the increasing treatment options,
4simple
and sensitive quantitative indicators of both forms of
de-mentia in its early stages would represent valuable
clini-cal tools. Measures of hippocampal atrophy have proven
the most sensitive way of differentiating mild to moderate
Alzheimer’s disease from non-demented elderly. Of these
measures, the width of the temporal horn yields the
high-est sensitivity, predicting the disease in 73% of cases with
95% specificity.
5Differentiation between FTD and AD on
neuroimag-ing, however, remains a great challenge, especially in the
clinical setting.
6-11Cerebral atrophy occurs in almost all types of dementia
and is characterized by a loss of global cerebral volume that
can be indirectly observed by ventricular and cerebral
sul-cal enlargement.
12Sensitive imaging providing linear and
volumetric measures of atrophy rates have been proposed
to track this decline.
13-17Generally these measures are larger
in patients with dementia than in healthy elderly.
18In this study, we aimed to better understand the
rela-tionship between the severity of cerebral subcortical
atro-phy and the type of dementia (FTD and AD), as well as to
explore the relationship of age, duration and aggravation
of dementia, educational level, daily living activities and
cognition, with cerebral subcortical atrophy. Finally we test
the usefulness of a linear measure of atrophy in
differenti-ating AD from FTD.
Methods
Participants
A total of 44 participants diagnosed with dementia were
recruited from the Clinicas Hospital at the Federal
Univer-sity of Goiás Medical School (FM-UFG), Brazil. There were
no gender or ethnic restrictions.
The study involved 22 men
and 22 women, aged 33 to 89 years, with mean age (±SD)
of 68.52±12.08 years, with schooling ranging from 1 to
20 years, with mean (±SD) of 7.35±5.54 years and disease
duration with a mean (±SD) of 3.66±3.44 years.
The clinical diagnoses were reached by an experienced
psychiatrist/neurologist (LC) based on patient history,
neu-roimaging results and neuropsychological tests. Diagnosis
of dementia was based on the criteria of the Diagnostic
and Statistical Manual Mental Disorders, Fourth Edition
(DSM-IV).
20Etiology of dementia included patients with
Alzheim-er’s disease (n=21) and Frontotemporal Dementia (n=23).
Diagnosis of FTD was based on Neary et al. criteria
21while
the diagnosis of probable AD was based on the National
Institute of Neurological Disorders and Communicative
Disorders and Stroke-Alzheimer´s Disease and Related
Dis-orders Association (NINCDS-ADRDA) criteria.
22Prior to carrying out this research, approval by the local
research ethics committee was obtained (protocol number:
006/05). All subjects who agreed to participate signed a
written informed consent.
Instruments and procedures
Bifrontal index-BFI
Magnetic resonance was performed on a 1.5–T MRI
unit with a quadrature head coil. T1-weighted sequences
were analyzed for this study. From the axial slice of
struc-tural neuroimaging (Magnetic Resonance Imaging), the
BFI was measured on a plane parallel to the temporal
lobe plane at the level of the maximum width between the
tips of the frontal horns of the lateral ventricles, and
de-fined as the ratio of this value to the diameter of the inner
skull table at the same level. The resulting ratio was then
multiplied by 100 and expressed as a percentage (Figure
1).
15,16,23,24A graded
caliper with a 0.1 mm scale was used
for this linear measurement on film copy.
The dilatation of the frontal horns of the lateral
ven-tricle is one of the earliest changes seen in cerebral atrophy,
while the BFI is a more reliable and practical linear
mea-surement to predict early cerebral atrophy.
25Clinical Dementia Rating (CDR) –
Dementia severity
was determined by total on the Clinical Dementia Rating
Scale. The CDR assesses cognitive function in six domains:
memory, orientation judgment and problem solving,
com-munity affairs and personal care. Based on six scores, a
Figure 1. Axial MR image showing the width between the frontal
global CDR score is assigned in which CDR 0 indicates no
dementia, CDR 0.5 indicates very mild dementia, CDR 1
indicates mild dementia, CDR 2 indicates moderate
de-mentia, and CDR 3 indicates severe dementia.
19Mini-Mental State Examination (MMSE) –
All
pa-tients completed the MMSE at baseline, which was
admin-istered to determine cognitive function.
26Pfeffer Functional Activities Questionnaire (FAQ) –
Caregivers of dementia patients completed this
question-naire. It is a good instrument for assessing functional
sta-tus, and includes ten questions on Activities of Daily Living
(ADL).
27All 44 individuals were assessed using the BFI, CDR,
MMSE and FAQ. Thus, duration of dementia and
edu-cation level (in years) were also examined and served as
inputs for the survival analysis. The neurological
examina-tion was performed during the same period as the clinical
imaging. The patients were divided into two groups: one
with FTD (
n
=23) and the other with AD
(n
=21). The BFI
was compared in both groups for all analyzed variables.
Statistical analysis
We conducted all statistical analysis using the SPSS 12.0
software for Windows. The Mann-Whitney test (U) was
performed to compare mean rates of variation between
the two patient groups. The analyzed variables were: age,
duration of dementia, MMSE scores, Functional Scale of
Pfeffer’s scores, level of education in years, Clinical
Demen-tia Rating Scale and BFI rate. We established the confidence
interval as 95% for the statistical tests.
The Spearman Coefficient (
rs
) was used to obtain the
correlation
p
and to verify the correlations between mean
rates of brain atrophy (measured by BFI) and all other
vari-ables. The Spearman’s Coefficient was the non-parametric
alternative when the data was not Gaussian and linear.
Results
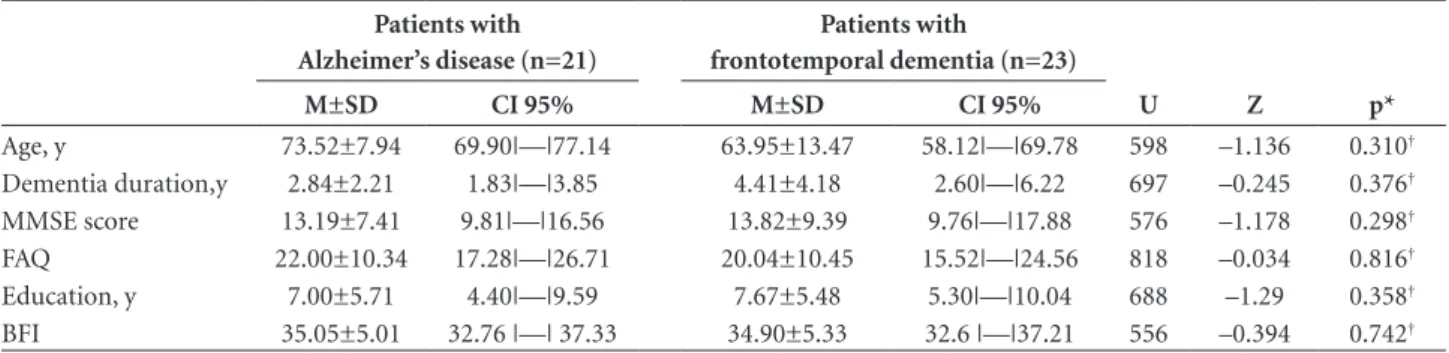
Table 1 shows the means (including standard deviation
and confidence interval) of all the clinical features along
with BFI for AD and FTD groups. Both patient groups
were closely matched for age, duration of dementia, MMSE
scores, Pfeffer Functional Activities Questionnaire (FAQ)
scores and educational level. There was no significant
dif-ference in BFI between groups.
In the FTD group, only the MMSE score showed a
strong correlation with BFI (Table 2). The AD group also
showed a significant correlation between MMSE score
and BFI, but weaker than that observed in the FTD group.
There was a significant correlation (p<0.05) between BFI
Table 1. Comparison of subcortical atrophy, demographic factors, disease severity and the duration of symptoms in patients with Al-zheimer’s disease and frontotemporal dementia.
Patients with Alzheimer’s disease (n=21)
Patients with frontotemporal dementia (n=23)
U Z p*
M±SD CI 95% M±SD CI 95%
Age, y 73.52±7.94 69.90|—|77.14 63.95±13.47 58.12|—|69.78 598 –1.136 0.310†
Dementia duration,y 2.84±2.21 1.83|—|3.85 4.41±4.18 2.60|—|6.22 697 –0.245 0.376†
MMSE score 13.19±7.41 9.81|—|16.56 13.82±9.39 9.76|—|17.88 576 –1.178 0.298†
FAQ 22.00±10.34 17.28|—|26.71 20.04±10.45 15.52|—|24.56 818 –0.034 0.816†
Education, y 7.00±5.71 4.40|—|9.59 7.67±5.48 5.30|—|10.04 688 –1.29 0.358†
BFI 35.05±5.01 32.76 |—| 37.33 34.90±5.33 32.6 |—|37.21 556 –0.394 0.742†
*Significance on Mann-Whitney Test (U); †No significant difference between groups p>0.05; MMSE, Mini-Mental State Examination; BFI, Bifrontal Index; EPSs,
Extrapyra-midal Signs; FAQ, Pfeffer-Functional Activities Questionnaire; M, Mean; SD, Standard Deviation; CI, Confidence interval; Z, standard normal deviation.
Table 2. Correlation of Bifrontal Index Rate with demographic factors, disease severity and the duration of symptoms in the two groups.
BFI
Patients with Alzheimer’s disease Patients with frontotemporal dementia
Spearman’s correlation (rs) p value Spearman’s correlation (rs) p value
Age, y 0.282 0.216‡ 0.214 0.326‡
Dementia duration,y 0.029 0.902‡ 0.079 0.722‡
MMSE score –0.491 0.024* –0.647 0.001†
FAQ 0.495 0.023* 0.375 0.078‡
Education, y –0.246 0.282‡ 0.068 0.759‡
CDR 0.315 0.164‡ 0.395 0.062‡
*Denotes p value of <0.05; †Denotes p value of <0.001; ‡ Differences of modalities not significant (p>0.05); MMSE, Mini-Mental State Examination; CDR, Clinical
and Pfeffer Functional Activities Questionnaire (FAQ)
scores in the AD group only.
Age, duration of dementia and educational level were
not correlated with BFI in either patient group (
p
<0.05).
Other correlations were also not significant.
Discussion
Indirect measures of subcortical atrophy, such as the
BFI, Bicaudate Index and Ventricle-Brain ratio have been
reported by many researchers to evaluate structural brain
damage in patients with dementia. Both linear and
volu-metric measurements are probably more reliable than those
made postmortem when ventricles are usually smaller than
the same ventricles before death.
13-16,29,30AD and FTD can be
difficult to differentiate clinically
because of overlapping
symptoms. Distinguishing the two
dementias based on volumetric
measurements of brain
at-rophy with MRI has been only partially
successful.
9Our
study did not demonstrate BFI differences between AD and
FTD groups.
Age was not correlated with rates of BFI in either group
across all analyses performed. This finding is consistent
with the results reported by Brinkman et al.
33in the study
of quantitative indexes of computed tomography in 28
pa-tients with Alzheimer’s dementia and 30 elderly persons.
Nevertheless, other authors
34have shown that age-related
increases in BFI most probably reflect losses in adjacent
brain structures including the caudate nuclei in normal
aging.
Concerning the analysis of cognitive performance,
measured by the MMSE, there was a negative correlation
with BFI in both patient groups, mainly in the FTD group
(p<0.001). This finding is in line with previous reports in
the literature that have shown distinct types of cerebral
changes predicting impaired performance on specific
cog-nitive tests.
35-37Soderlund et al.
35also observed that
sub-cortical atrophy estimated by means of ventricular
enlarge-ment were associated with cognitive deficits. Nevertheless,
the measures used in the cited study were the BFI, the
Cau-date Ventricular Index and Occipital Ventricular Index. The
average of the three indexes was used to calculate a global
score. Furthermore, the 1254 participants had an MMSE
score above 24 and were non-demented individuals.
A small number of studies have focused attention on
the relationship between activities of daily living and linear
brain measures in dementia patients, but only in Vascular
Dementia and normal aging.
35,38Activities of daily living
performance decreased with increased subcortical atrophy
only for the AD group. Perhaps, one explanation for this
fact is that FTD patients present a reduced capacity to
per-form daily tasks from the early stages of disease (a
differ-ence from AD),
39when BFI values still remain low.
We found no correlation between duration of
symp-toms and the linear measurement of subcortical atrophy.
This may be expected because the extent of dementia is
only an estimate. To our knowledge, no previous study has
reported the association involving duration of dementia
and subcortical atrophy measured by BFI.
We have also demonstrated that subcortical atrophy is
not correlated with educational level. This could possibly
be explained by the fact that participants had a large
dis-crepancy in terms of years of education. Clinical
pathologi-cal studies are necessary to clarify the association between
subcortical atrophy and progression of dementia.
Studies including only one brain variable can be
mis-leading because their putative association may be due to
a correlated brain change while cerebral atrophy is an
in-direct measure of pathological processes occurring on a
cellular level. In addition, the BFI is a non-specific finding
which can result from brain injury or degeneration and
which occurs normally in ageing, although many disease
processes result in distinctive patterns of atrophy due to
differential involvement of specific areas of the brain.
In conclusion, a linear measurement of subcortical
atrophy such as BFI probably is not useful for providing
a differential diagnosis between AD and FTD.
Further-more, cognitive function (in both FTD and AD groups)
and capacity for independent living (only in AD group)
decreased with increased subcortical atrophy. Our findings
also revealed that age, duration of dementia and
educa-tional level do not significantly correlate with degree of
cerebral atrophy.
References
1. Rascovsky K, Hodges JR, Kipps CM, et al. Diagnostic crite-ria for the behavioral vacrite-riant of frontotemporal dementia (bvFTD): current limitations and future directions. Alzheimer Dis Assoc Disord 2007;21:S14-S18.
2. Kazee AM, Eskin TA, Lapham LW, Gabriel KR, McDaniel KD, Hamill RW. Clinicopathologic correlates in Alzheimer disease: assessment of clinical and pathologic diagnostic criteria. Alz Dis Assoc Disord 1993;3:152–164.
3. Tierney MC, Fisher RH, Lewis AJ, et al. The NINCDS-ADRD-A work group criteria for the clinical diagnosis of probable Alzheimer’s disease: a clinicopathologic study of 57 cases. Neurology 1988;38:359–364.
4. Hogan DB, Bailey P, Black S, et al. Diagnosis and treatment of dementia: 4. Approach to management of mild to moderate dementia. CMAJ 2008;179:787-793.
5. Bocti C, Rockel C, Roy P, Gao F, Black SE. Topographical patterns of lobar atrophy in frontotemporal dementia and Alzheim-er’s disease. Dement Geriatr Cogn Disord 2006;21:364-372. 6. Perry RJ; HodgesJR.Differentiating frontal and temporal
variant frontotemporal dementia from Alzheimer’s disease. Neurology 2000;54:2277-2284.
and behavioral differentiation of frontal lobe degeneration of the non-Alzheimer type and Alzheimers disease. Dement Geriatr Cogn Disord 1998;9:205-213.
8. Lipton AM, BenavidesR, Hynan LS, et al. Lateralization on neuroimaging does not differentiate frontotemporal lobar de-generation from Alzheimer‘s Disease. Dement Geriatr Cogn Disord 2004;17:324-327.
9. Du AT, Schuff N, Kramer JH, et al. Different regional patterns of cortical thinning in Alzheimer’s disease and frontotempo-ral dementia. Brain 2007;130:1159-1166.
10. Varma AR, Adams W, Lloyd JJ, et al. Diagnostic patterns of regional atrophy on MRI and regional cerebral blood flow change on SPECT in young onset patients with Alzheimer’s disease, frontotemporal dementia and vascular dementia. Acta Neurol Scand 2002;105:261-269.
11. Julin P, Wahlund LO, Basun H, Persson A, Måre K, Rudberg U. Clinical diagnosis of frontal lobe dementia and Alzheimer’s disease: relation to cerebral perfusion, brain atrophy and elec-troencephalography. Dementia 1995;6:142-147.
12. Akyama H, Meyer JS, Mortel KF, Terayama Y, Thornby JI, Konno S. Normal human aging: factors contributing to cere-bral atrophy. J Neurol Sci 1997;152:39-49.
13. Synek V, Reuben JR .The ventricle-brain ratio using planimetric measurement of EMI scans. Br J Radiology 1976;49:233-237. 14. Heinz ER, Ward A, Drayer BP, Dubois PJ. Distinction between obstructive and atrophic dilatation of ventricles in children. J Comput Assist Tomogr 1980;4:320-325.
15. Aylward EH, Scwartz J, Machlin S, Pearlson G. Bicaudate Ra-tio as a Measure of Caudate Volume on MR Images. Am J Neuroradiol 1991:12:1217-1222.
16. Frisoni GB, Beltramello A, Weiss C, Geroldi C, Bianchetti A, Trabucci M. Linear Measures of Atrophy in Mild Alzheimer Disease. Am J Neuroradiol 1996;17:913-923.
17. Fox NC, Schott JM. Imaging cerebral atrophy: normal ageing to Alzheimer’s Disease. Lancet 2004;363:362-394.
18. Chaves MLF, Maia ALG, Lehmen R, Oliveira LM. Diagnosing dementia and normal aging: clinical relevance of brain ratios and cognitive performance in a Brazilian sample. Braz J Med Biol Res 1999; 32:1133-1143.
19. Morris JC. The Clinical Dementia Rating (CDR): current ver-sion and scoring rules. Neurology 1993;43:2412-2414. 20. American Psychiatry Association. Diagnostic and Statistical
Manual of Mental Disorders. 4 th ed. Washington DC:
Ameri-can Psychiatric Association; 1994.
21. Neary D, Snowden JS, Gustafson L, et al. Frontotemporal lo-bar degeneration. A consensus on clinical diagnostic criteria. Neurology1998;51:1546-1554.
22. McKhann G; Drachman D; Folstein M; Katzman R; Price D; Stadlan EM. Clinical Diagnosis of Alzheimer’s disease: report of the NINCDS-ADRDA work group under the auspices of department of health and human services task force on Al-zheimer’s disease. Neurology 1984;34: 939-944.
23. Baar AN, Heinze WJ, Dobben GD, Valvassori GE, Sugar O.
Bicaudate index computerized tomography of Huntington disease and cerebral atrophy. Neurology 1978;28:1196-1200. 24. Hahn FJY, Rim K. Frontal Ventricular Dimensions on Nor-mal Computed Tomography. AJR Am J Roentgenol 1976;126: 593-596.
25. Zhang Y, Wahlund, LH. Lean Frontal Horns Ratio- A New Linear Measurement to predict early cerebral atrophy on CT. Neurobiol Aging 2004;25:371-372.
26. Folstein MF, Folstein SE, Mchugh PR. “Mini-Mental State”. A practical method for grading the cognitive state of patients for clinician. J Psychiatr Research 1975;12:189-198.
27. Pfeffer RI, Kurosaki TT, Harrah CH, Chance JM, Filos S. Measurement of functional activities in older adults in the community. J Gerontology 1982;37:323-329.
28. Bigler ED, Hubler DW, Cullum CM, Turkheimer E. Intellec-tual and Memory in Dementia. Computed Axial Topography Volume Correlations. J Nerv Ment Dis 1985;173:347-354. 29. Woods BT, Douglass A, Gescuk B. Is the VBR still a useful
measure of changes in the cerebral ventricles? Psychiatry Re-search: Neuroimaging 1991;40:1-10.
30. Brinkman SD, Sarwar M, Levin HS, Morris HH. Quantitative indexes of computed tomography in dementia and normal aging. Radiology 1981;138:89-92.
31. Doraiswamy PM, Patterson L, Na C, et al. Bicaudate index on magnetic resonance imaging: effects of normal aging. J Geriatr Psychiatry Neurol 1994;7:13-17.
32. Söderlund H, Nillsson L-G, Berger K, et al. Cerebral changes on MRI and cognitive functions: The CASCADE study. Neu-robiol Aging 2006;27:16-23.
33. Laakson MP, Soininem H, Partamnem K, et al. Volumes of hippocampus, amygadala and frontal lobes in the MRI-bases diagnosis of early Alzheimer’s disease: Correlation with mem-ory functions. J Neural Transm 1995;9:73-86.
34. Laakson MP, Soininem H, Partamnem K, et al. MRI of the Hippocampus in Alzheimer’s disease: sensitivity, specificity, and analysis of the incorrectly classified subjects. Neurobiol Aging 1998;19:23-31.
35. Broderick JP, Gaskill M, Dhawan A, Khoury JC. Temporal changes in brain volume and cognition in a randomized treat-ment trial of vascular detreat-mentia. J Neuroimaging 2001;11:6-12. 36. Mioshi E, Kipps CM, Dawson K, Mitchell J, Graham A, Hodg-es JR.Activities of daily living in frontotemporal dementia and Alzheimer disease. Neurology 2007;68:2077-2084. 37. Laakson MP, Soininem H, Partamnem K, et al. MRI of the
Hippocampus in Alzheimer’s disease: Sensitivity, Specificity, and Analysis of the Incorrectly Classified Subjects. Neurobiol Aging 1998; 19:23-31.