zyxwvutsrqponmlkjihgfedcbaZWTRQPOMLIFECA
Lung Cancer Risk in Painters: A Meta-Analysis
Risco de Câncer de pulmão em pintores: Uma metaanálise
A
R
T
IG
O
A
R
T
IC
L
E
Neela Guha 1 Franco Merletti 2 Nelson Kyle Steenland 3 Andrea Altieri 4 Vincent Cogliano 1 Kurt Straif 1
* Supplemental Material is
available online (doi: 10.1289/ ehp.0901402.S1 via http://dx.doi.org/).
1Section of IARC
Monographs, International Agency for Research on Cancer. 150 cours Albert Thomas 69372 Lyon cedex 8 France. [email protected]
2 Unit of Cancer
Epidemiology, Department of Biomedical Sciences and Human Oncology, University of Turin, Turin, Italy.
3 Department of
Environmental and Occupational Health, Rollins School of Public Health, Emory University,
Atlanta, Georgia, USA. 4
Emerging Risks Unit, European Food Safety Authority, Parma, Italy.
Abstract
We conducted a metaanalysis to quan- titatively compare the association between occu- pation as a painter and the incidence or mortal-ity from lung cancer. PubMed and the reference lists of pertinent publications were searched and reviewed. For the m etaanalysis, we used data from 47 independent cohort, record linkage, and case–control studies (from a total of 74 reports), including > 11,000 incident cases or deaths from lung cancer among painters. Three authors inde- pendently abstracted data and assessed study qual- ity. The summary relative risk (metaRR, ran-dom effects) for lung cancer in painters was 1.35 [95% confidence interval (CI), 1.29–1.41; 47 stud- ies] and 1.35 (95% CI, 1.21–1.51; 27 studies) af-ter controlling for smoking. The relative risk was higher in neversmokers (metaRR = 2.00; 95% CI, 1.09–3.67; 3studies) and persisted when re- stricted to studies that adjusted for other occupa-tional exposures (metaRR = 1.57; 95% CI, 1.21– 2.04; 5 studies). These results support the conclu-sion that occupational exposures in painters are causally associated with the risk of lung cancer.
Key words Epidem iology, Lung cancer, Meta-analysis, Painter
Resumo Conduziuse uma metaanálise para
comparar quatitativamente a associação entre o trabalho de pintor e a incidência ou mortalidade por câncer de pulmão. PubMed e listas de referên-cia de publicações pertinentes foram pesquisadas e revisadas. Para a análise, foram usados dados de 47 estudos de caso, coorte independente e ligação de dados (de um total de 74 relatórios), incluindo > 11 mil casos de incidentes ou morte por câncer de pulmão entre pintores. Três autores coletaram dados e avaliaram a qualidade de estudo. O risco relativo (metaRR, efeitos aleatórios) de câncer de pulmão em pintores foi de 1,35 [95% intervalo de confiança (IC), 1,291,41; 47 estudos] e 1,35 (95% IC, 1,211,51; 27 estudos) depois de se des- tacar os fumantes. O risco relativo foi maior na-queles que nunca fumaram (metaRR = 2.00; 95% CI, 1,093,67; 3 estudos) e persistiu quanto res- tringido a estudos que foram ajustados para ou-tras exposições ocupacionais (m etaRR = 1,57; 95% CI, 1,212,04; 5 estudos). Estes resultados sustentam a conclusão de que exposições ocupacio-nais em pintores são causadamente associada com o risco de câncer de pulmão.
G
Lung cancer is the most common cancer diagno-sis worldwide and is the major cause of cancer mortality, particularly among men. The Interna- tional Agency for Research on Cancer (IARC) es-timated that there were > 900,000 new cases of lung cancer each year among men and > 330,000 among women (IARC 2001, 2003). Approximately 90% of the lung cancer burden in developed coun-tries is attributed to smoking, which acts either independently or synergistically with other occu- pational, lifestyle, or hereditary risk factors (Bo-ffetta and Trichopoulos 2002; Peto et al. 1994). Several agents encountered in the occupational setting, such as asbestos, polycyclic aromatic hy- drocarbons, arsenic, beryllium, cadmium, chro-mium (VI), and nickel compounds, are established carcinogens that target the lung (IARC 2008).
An increased incidence and mortality from lung cancer has been observed in painters, an occupation that employs several million people worldwide (IARC 1989). This has led IARC to classify occupational exposure as a painter as “car-cinogenic to humans” (Group1) (IARC 1989, in press; Straif et al. 2007). Painters are exposed to m any known and suspected lung carcinogens through inhalation or dermal contact (IARC 1989; Siemiatycki et al. 2004), such as talc contain in g asbestos fiber s, ch r om iu m VI com -pou n ds, chlorin ated solven ts, an d cadm iu m compounds (IARC 1987, 1995, 1999, in press; Straif et al. 2009), although the specific causative agents have not yet been identified.
Cohort and record linkage studies demonstrat-ing a relatively consistent increased incidence and mortality from lung cancer among painters [Al-exander et al. 1996; Boice et al. 1999; Dubrow and Wegman 1984; Dunn and Weir 1965; Enterline and McKiever 1963; Gubéran et al. 1989; Guralnick 1963; Hrubec et al. 1995; Logan 1982; Menck and Henderson 1976; Office of Population Censuses and Surveys (OPCS) 1958, 1971, 1978, 1986, 1995; Petersen and Milham 1980; Pukkala 2009; van Loon et al. 1997; Whorton et al. 1983] have sup-ported the IARC Group 1 classification, although potential confounding by tobacco smoking could not be ruled out in several of these studies. (Here we refer to record linkage studies as a subset of cohort studies where two databases are linked, such as a cohort of painters derived from census data and national mortality data, with only min-imum demographic information available for the cohort.) Case–control studies have also shown that occupational exposure as a painter is a risk factor for lung cancer (Bethwaite et al. 1990; Bou-chardy et al. 2002; Breslow et al. 1954; DeStefani et
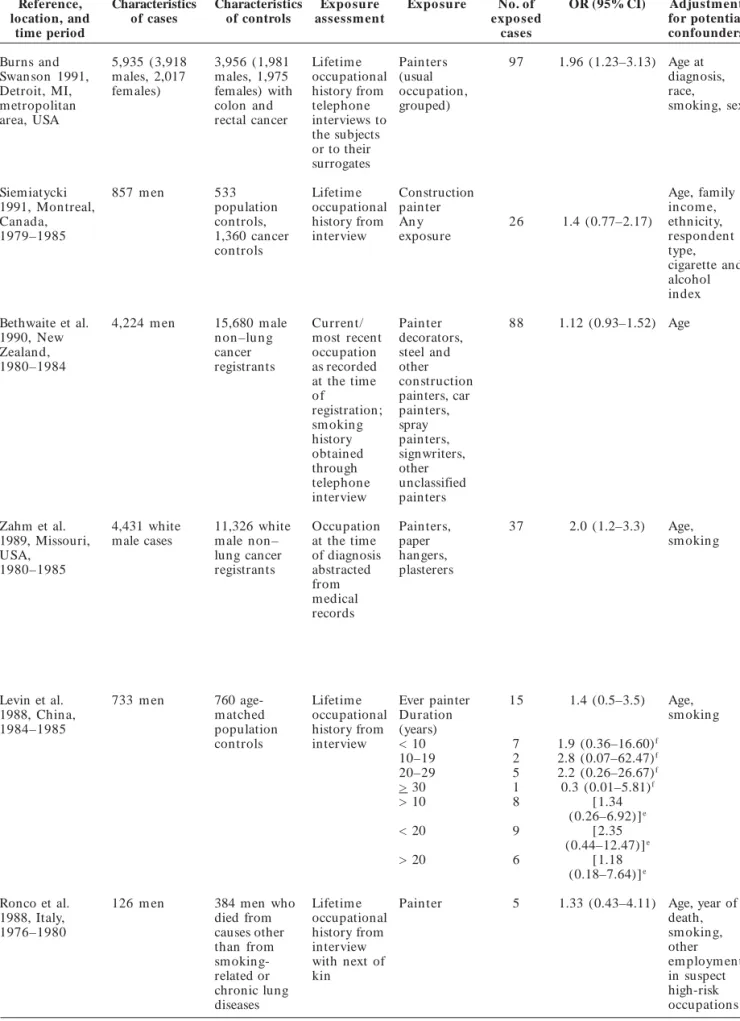
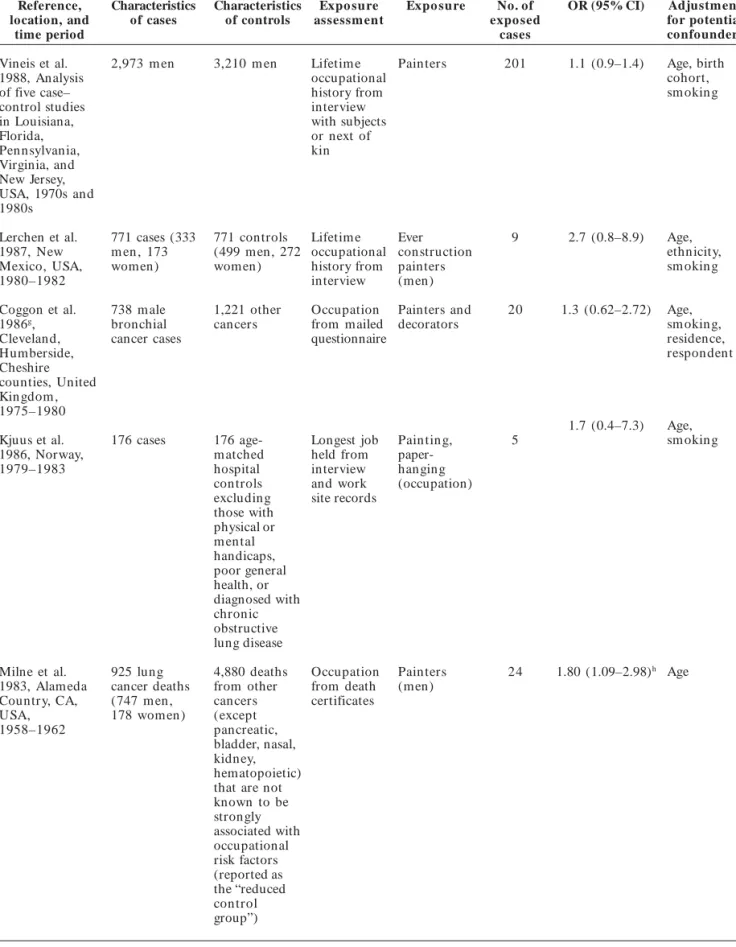
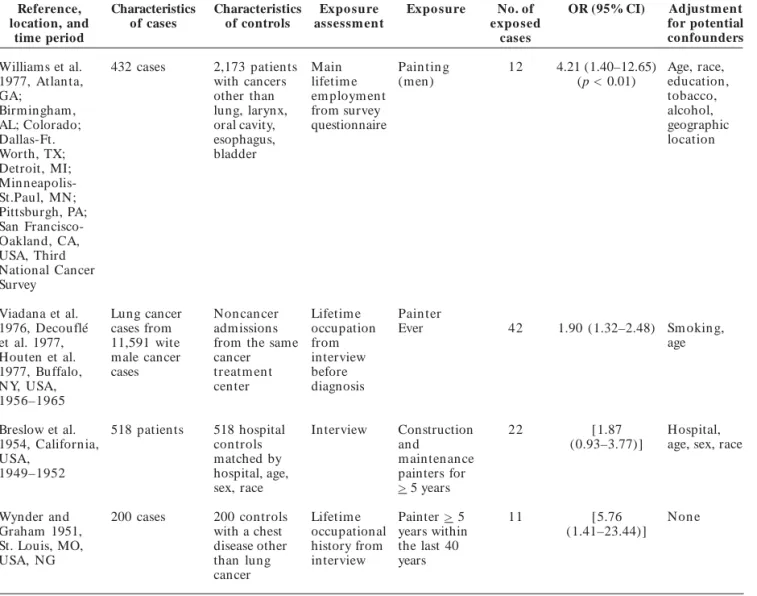
al. 1996; Finkelstein 1995; Milne et al. 1983; Pohla-beln et al. 2000; Wynder and Graham 1951), albeit somewhat less consistently (Baccarelli et al. 2005; Morabia et al. 1992; Muscat et al. 1998; Vineis et al. 1988; WünschFilho et al. 1998), and the in- creased risk persisted after adjusting for the po-tential confounding by smoking (BrüskeHohlfeld et al. 2000; Coggon et al. 1986; Decouflé et al. 1977; Houten et al. 1977; Jahn et al. 1999; Kjuus et al. 1986; Lerchen et al. 1987; Richiardi et al. 2004; Ronco et al. 1988; Viadana et al. 1976; Williams et al. 1977).
To assess the risk of lung cancer associated with occupational exposure as a painter, we con-ducted a metaanalysis of cohort, record linkage, and case–control studies to quantitatively com-pare the results of the different study designs and the potential confounding effect of smoking (by restricting to neversmokers), as well as other analyses to support the causal association. A thor- ough discussion of the individual studies includ-ed in the metaanalysis is not presented here but was summarized in the IARC Monographs (IARC
1989, in press). All of the studies reviewed, includ-ing the new studies published since the IARC Monographs, are summarized in Supplemental
Material, Tables1–3, available online (doi:10.1289/ ehp.0901402.S1 via http://dx.doi.org/).
Materials and Methods
Selection criteria
All epidemiologic studies included in the previ-ous IARC Monographs were considered (IARC 1989,
in press). Further, we searched PubMed (National Center for Biotechnology Information 2009) for articles in any language describing lung cancer in
painters referenced in or published since the previ-ous
We identified 121 publications after re-
stricting results to studies in humans. From the PubMed search, 69 studies were excluded because they were not epidemiologic studies, did not in-clude original data (they were review articles), did not assess occupation as a painter, or lung cancer was not the outcome. The reference lists of perti-nent publications were also reviewed to capture relevant data sources that may not have been iden-tified with the search criteria.
The definition of painter varied between stud-ies and often included other occupations exposed to paints such as plasterers, glaziers, wallpaper hangers, artists, decorators, French polishers, and aerographers [see Supplemental Material, Table 4 (doi:10.1289/ehp.0901402.S1) for definitions]. It is likely that paperhangers and other aforemen- tioned occupations work in the same job envi- ronment as painters or may also paint; there-fore, we con sidered this category as pain ters (Carstensen et al. 1988).
To be included in this metaanalysis, studies had to report estimates of the relative risk (RR), odds ratio (OR), standardized incidence ratio (SIR), standardized mortality ratio (SMR), pro- portionate mortality ratio (PMR), or propor-tional registration ratio with corresponding 95% confidence intervals (CIs) for everversusnever occupation as a painter or have provided enough information that allowed for their computation. For studies that did not report the everversus- never painter category, we estimated the risk esti- mates and 95% CIs for these categories. For stud-ies that reported only point estimates without corresponding CIs, pvalues, or standard errors,
or did not report the distribution of data to al-low for computation of relative risks and CIs (also for nonoverlapping populations), we made con-servative assumptions to estimate RRs and 95% CIs from the data provided on a studybystudy basis. These conservative assumptions underes-timated the relative risk (toward the null) and overestimated the width of the CI (i.e., by dou- bling the variance to approximate a 95% CI ad-justed for multiple factors).
For example, overlapping lung cancer cases among AfricanAmerican (black) men was iden-tified by Morabia et al. (1992) and Muscat et al. (1998). We accounted for this population over-lap by approximating the proportion of black male participants (cases and controls) based on distributions presented in other publications de-tailing this population, applying this proportion to the distribution presented by Morabia et al. (1992) (for black and whites combined) to deter-mine the number of overlapping subjects, and
subtracting the overlapping subjects from the distribution presented in Muscat et al. (1998).
Studies were excluded if estimation was im-possible. In Supplemental Material, Tables 1–3 (doi:10.1289/ehp.0901402.S1), we use brackets to indicate the RRs and 95% CIs we calculated. For studies with overlapping populations, we includ-ed only the publication with the most complete study population. Further comments on study quality and any exclusions made are presented in detail in Supplemental Material, Tables 1–3. In total, we included in the metaanalysis 17 cohort and record linkage studies, 29 case–control stud-ies, and 12 proportionate mortality analyses.
Data abstraction
All articles were assessed independently by three reviewers (A.A., F.M., N.K.S.) who extract-ed data that included authors, publication date, country of origin, characteristics of the study population including sex, and any details on the definition of painters, incidence versus mortality, lung cancer histology, observed and expected can- cer cases (for cohort and proportionate mortal- ity studies), number of exposed cases and con- trols (for case–control studies), yes/no adjust- ment for smoking or other occupational carcin-ogens, relative risks with corresponding 95% CIs, and results on exposure–response [see Supple-m en t al Mat er ial, Tab les1–3 ( d o i:10.1289/ ehp.0901402.S1)]. If adjusted and unadjusted re- sults were reported, the most valid point esti- mate (i.e., adjusted for smoking and other vari-ables) was abstracted. Any discrepancies in data collection were resolved by two other reviewers (N.G., K.S.).
Summary statistics calculated for inclusion in the meta-analysis
For cohort and record linkage studies, rela- tive risk estimates (SIR and SMR) were comput-ed by dividing the observed number of cases by the expected number, based on an external refer-ence population. The corresponding 95% CIs were estimated using the PAMCOMP program (Taeger et al. 2000). If only subgroup results (e.g., by sex or duration of exposure) were reported, fixedeffects models were used to combine stra-tumspecific data into one summary estimate [see Su p p lem en t al Mat er ial, Tab les1 an d 2
(doi:10.1289/ehp.0901402.S1)].
Wherever possible for the proportionate mor-tality studies, we used proportional cancer mor
e C
o
le
tiv
a, 1
6
(8
):3
6
1
3
3
6
3
2
, 2
0
1
1
G
tality ratios (calculating expected proportions of cancer deaths based on the proportion of cancer mortality in the reference population) in the anal- ysis instead of PMRs as a more conservative ap-proach, because proportional cancer mortality ratios provide a better risk estimate for specific cancer sites when the PMR for all cancer is artifi-cially inflated by a deficit in other causes of death (Dalager et al. 1980) [see Supplemental Material, Table 3 (doi:10.1289/ehp.0901402.S1)]. If several cancer sites are associated with a particular occu-pation, the PMR can underestimate the RR.
Subgroup analyses were conducted by fur- ther restriction to studies with stronger method-ologies, such as those studies that adjusted for smoking (Baccarelli et al. 2005; BrüskeHohlfeld et al. 2000; Burns and Swanson 1991; DeStefani et al. 1996, 2005; Dunn and Weir 1965; Hrubec et al. 1995; Jahn et al. 1999; Kjuus et al. 1986; Lerch-en et al. 1987; Levin et al. 1988; Matos et al. 2000; Morabia et al. 1992; Muscat et al. 1998; Notani et al. 1993; Pezzotto and Poletto 1999; Pohlabeln et al. 2000; Pronk et al. 2009; Richiardi et al. 2004; Ronco et al. 1988; Siemiatycki 1991; vanLoon et al. 1997; Viadana et al. 1976; Vineis et al. 1988; Williams et al. 1977; WünschFilho et al. 1998; Zah m et al. 1989; Zeka et al. 2006) , ot h er occupational risk factors (Jahn et al. 1999; Ron-co et al. 1988; Stockwell and Matanoski 1985; van Loon et al. 1997), or populationbased case–con-trol studies that adjusted for smoking (Brüske Hohlfeld et al. 2000; Burns and Swanson 1991; Coggon et al. 1986; Jahn et al. 1999; Lerchen et al. 1987; Levin et al. 1988; Pohlabeln et al. 2000; Ri-chiardi et al. 2004; Ronco et al. 1988; Siemiatycki 1991; Vineis et al. 1988; Zahm et al. 1989; Zeka et al. 2006). Only four of the cohort and record linkage studies provided information on smok-ing status (Dunn and Weir 1965; Hrubec et al. 1995; Pronk et al. 2009; vanLoon et al. 1997).
To allow for inclusion in the metaanalysis, we calculated 95% CIs if they were not presented in the original paper. If a 90% CI was presented and if the upper limit (UL) and lower limit (LL) were proportionally symmetric around the risk ratio (for RR and OR; i.e., if UL/RR = RR/LL), an estimate of the standard error (SE) was calculat-ed by SE = (ln UL – lnLL/3.29), where 3.29 = 2× 1.645 for 90% CIs. If only a p value for the null
hypothesis was presented, then a testbased SE was estimated using SE = (ln RR)/Zp, where Zp is
the value of the standardnormal test statistic cor-responding to the p value using a twotailed test.
The UL and LL of the 95% CI were estimated by RR ± 1.96(SE), where Zp = 1.96 if p = 0.05 using a
twotailed test (Rothman et al. 2008). A 95% CI corresponding to an unadjusted RR was used in the metaanalysis if a paper did not present enough data to allow for estimation of the adjusted CI.
Statistical analysis
Because cancer incidence data are often more accurate than mortality data, we used SIRs in the analyses instead of SMRs whenever both were presented. However, mortality data for lung can- cer are a very reasonable proxy for incidence be-cause of the high fatality of lung cancer and the good qu ality of data from death certificates (Schottenfeld and Fraumeni 2006). We performed a separate metaanalysis for proportionate mor- tality studies. The PMRs were, however, not in-cluded in the overall metaanalyses because of their often lower quality of exposure assessment and their additional potential for bias. Assuming that the different effect estimates (e.g., SMR, SIR, RR, OR) represent the relative risk, the data were combined for all of the cohort, record linkage, and case–control studies. Subanalyses were also performed by stratifying on study design.
Many of the cohort and record linkage stud- ies used an external reference population to calcu- late the expected cases. The use of an external ref-erence population may result in a healthy worker effect, so that incidence or mortality rates of can-cer in the exposed cohort may spuriously appear lower than in the general population. When the external reference rates used to calculate the ex-pected cases are usually assumed to be known without error, an estimate of the exposure coeffi- cient in a regression could be obtained by a weight- ed linear regression of the natural log of the ad-justed SMR on exposure (Sutton et al. 2000). The risk estimates from nested case–control studies were included with the analysis of cohort studies because, essentially, this design can represent a more efficient way to analyze cohort studies and does not suffer from the problems associated with control selection in a case–control study. Sum-mary ORs (metaORs) were obtained separately from the metaanalysis of case–control studies. Subgroup analyses were performed stratified by sex, study region, study design, types of adjust-ment, and duration of employment.
The I2
statistic quantifies the extent of incon- sistency among the studies (Higgins and Thomp-son 2002). I2
because the
Qstatistic informs about the pres-ence or absence of heterogeneity but does not quantify the extent (Huedo Medina et al. 2006). We used both random and fixedeffect models, with weights equal to the inverse of the variance, to calculate a summary risk estimate (DerSimo- nian and Laird 1986). Results from randomef-fects models, which account for heterogeneity among studies, are presented.
We conducted sensitivity analyses by drop- ping one study at a time and examining its influ-ence on the summary effect estimates. Forest plots were used to graphically display the data (Lewis and Clarke 2001). Publication bias was visually assessed using Funnel plots (Deeks et al. 2005). We performed all statistical analyses using STA-TA (version 10.0; StataCorp, College Station, TX, USA), employing the “metan” command for the metaanalyses (Bradburn 2004).
Results
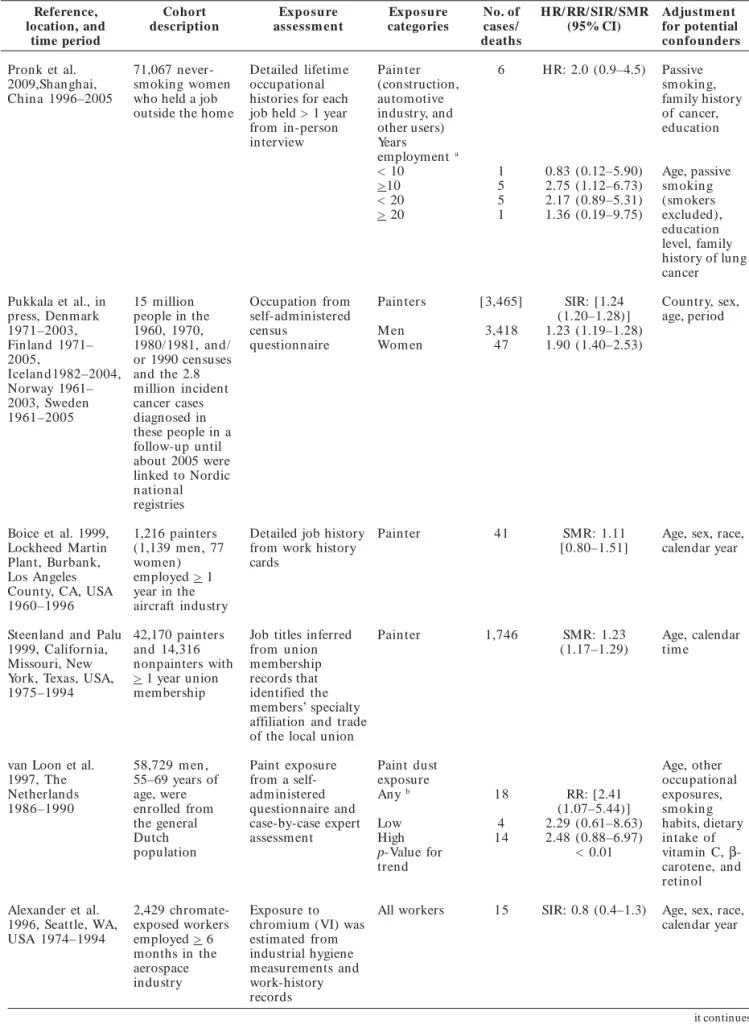
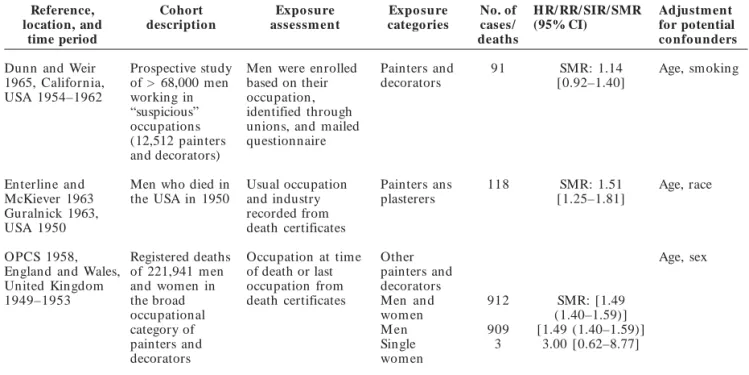
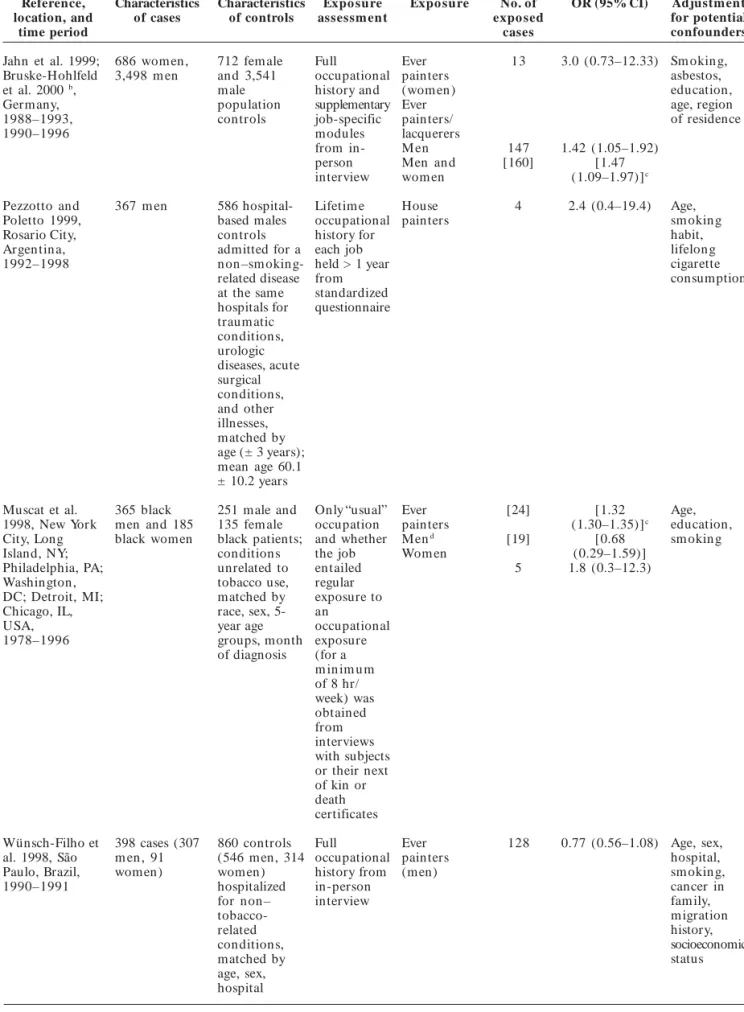
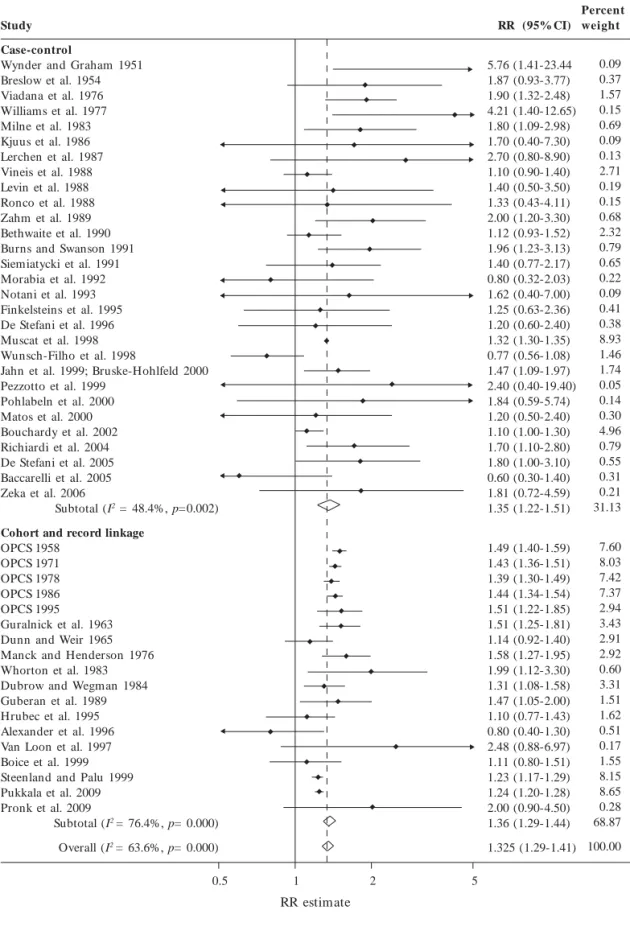
We reviewed 74reports published since 1951 as-sessing the relationship between occupation as a painter and the risk of lung cancer [see Supple-m en t al Mat er ial, Tab les1–3 ( d o i:10.1289/ ehp.0901402.S1)]. The estimates of the relative risk reported in 47 independent studies ranged from 0.60 to 5.76, with 43 studies reporting an RR > 1.0 (Tables 1 and 2). The combined analy-sis of 18 cohort and record linkage studies (meta RR = 1.36; 95% CI, 1.29–1.44; I2 = 76.4%, p = 0)
and 29 case–control studies (metaOR, 1.35; 95% CI, 1.22–1.51; I2 = 48.4%, p = 0.002), including >
11,000 incident cases and/or deaths from lung cancer among painters, demonstrated a signifi-cantly increased risk overall in persons who had ever reported occupation as a painter (metaRR = 1.35; 95% CI, 1.29–1.41; I2 = 63.6%, p = 0)
(Figure 1). Although the results of 13proportion-ate mortality studies were not included in the combined analysis, they also demonstrated a sig- nificantly increased risk of lung cancer in paint-ers (metaPMR, 1.22; 95% CI, 1.17–1.28). The Forest plot (Figure1) shows that there was no obvious trend in risk (at least no obvious trend toward a reduction in risk) over time. An influ-ence analysis showed that dropping individual studies did not significantly alter the results (data not shown).
Relative risks were higher in female painters (metaRR = 2.04; 95% CI, 1.59–2.62) (Jahn et al. 1999; Muscat et al. 1998; OPCS 1958, 1971; Pronk et al. 2009; Pukkala 2009; Zeka et al. 2006) than in
males (metaRR = 1.37; 95% CI, 1.29–1.44). Al- though there were only seven studies among fe- male painters, the metaRR was statistically sig-nificant. Stratification by study region showed that relative risks were highest in Asia (metaRR = 1.71; 95% CI, 0.97–3.03; I2 = 0%, p = 0.86),
similar in Europe (metaRR = 1.38 95% CI, 1.28– 1.48; I2 = 75.8%, p = 0) and North America (meta
RR = 1.35; 95% CI, 1.26–1.45; I2 = 56.4%, p =
0.001), and lower in South America (metaRR = 1.17; 95% CI, 0.77–1.76; I2 = 48.8%, p = 0.10). Of
the few studies that reported results for specific histologies (De Stefani et al. 1996, 2005; Pezzotto and Poletto 1999; Richiardi et al. 2004; Siemiaty- cki et al. 1987), relative risks were generally high- est among those diagnosed with smallcell can-cer, although the CIs were wide because of the small number of cases and because results for the different histologic entities were not reported consistently.
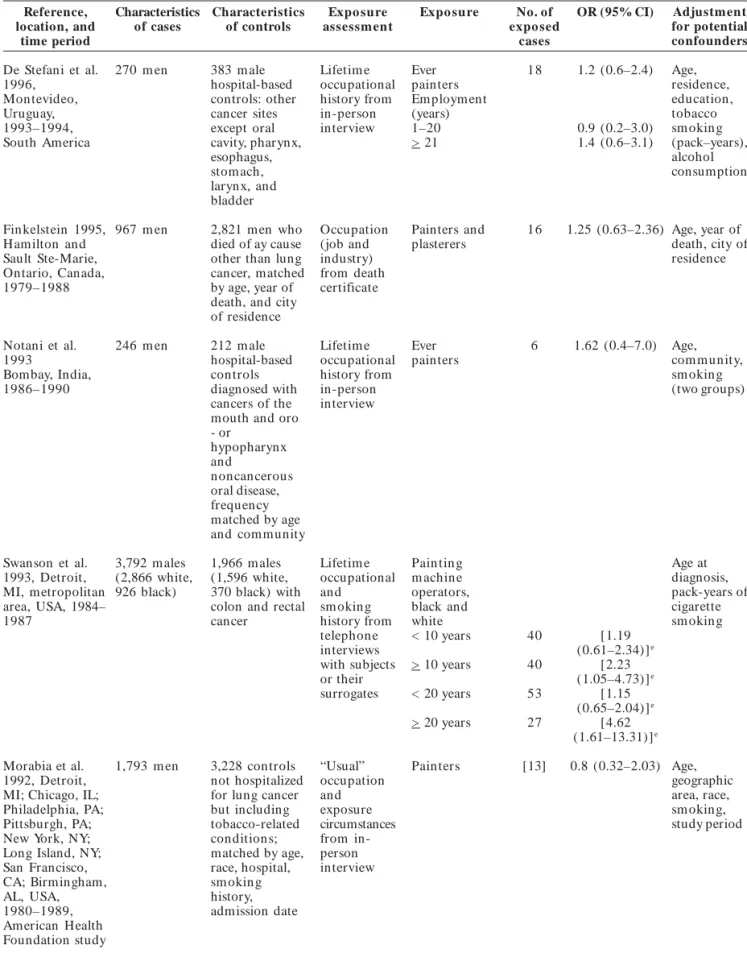
There appeared to be no evidence of publica- tion bias among cohort and record linkage stud-ies (data not shown). However, visual inspection of the funnel plot for 30 independent case–con- trol studies demonstrated some evidence of pub-lication bias: the plot was slightly skewed with a deficit of smaller nonpositive studies (represent-ed by large SEs) (Figure 2). When restricting the analysis to the larger case–control studies that showed both positive and negative results, the metaOR remained significantly elevated (meta OR, 1.31; 95% CI, 1.18–1.45; I2 = 51.6%, p =
0.003). There was little difference in the results of case–control studies stratified by hospitalbased controls (metaOR, 1.37; 95% CI, 1.09–1.74; I2 =
59.3%, p = 0.002) or populationbased controls
(metaOR, 1.34; 95% CI, 1.18–1.51; I2 = 25.9%, p
= 0.16), although the populationbased studies were less heterogeneous.
We performed additional analyses to exam-ine the summary estimates when restricted to populationbased case–control studies that ad-justed for tobacco smoking or other occupational exposures. Restricting to populationbased case– control studies that adjusted for smoking dem-onstrated less heterogeneity between studies and strengthened the results (metaOR, 1.41; 95% CI, 1.23–1.61; I2 = 0%, p = 0.45). Four cohort studies
reported smokingadjusted results (Dunn and Weir 1965; Hrubec et al. 1995; Pronk et al. 2009; vanLoon et al. 1997), with a meta RR of 1.22 (95% CI, 0.97–1.52; I2 = 23.7%, p = 0.27), slightly lower
than the metaRR for cohort studies that did not adjust for smoking (metaRR = 1.38; 95% CI, 1.30–1.46; I2 = 80.4%, p = 0).
e C
o
le
tiv
a, 1
6
(8
):3
6
1
3
3
6
3
2
, 2
0
1
1
zyxwvutsrqponmlkjihgfedcbaZYXWVUTSRQPONMLKJIHGFEDCBA
G
Table 1. Cohort and record linkage studies assessing lung and respiratory cancer among persons with occupation
as a painter by publication date.
Reference, Cohort Expo sure Expo sure No. of HR/ RR/ SIR/ SMR Adjustment
location, and description assessm ent categories cases/ (95% CI) for potential
time period deaths co nfo unders
Pronk et al. 71,067 never Detailed lifetim e Pain ter 6 HR: 2.0 (0.9–4.5) Passive
2009,Shanghai, smoking women occupational (construction, sm okin g,
Chin a 1996–2005 who held a job histories for each automotive family history
outside the home job held > 1 year industry, and of cancer,
from inperson other users) education
interview Years
employment a
< 10 1 0.83 (0.12–5.90) Age, passive > 10 5 2.75 (1.12–6.73) sm okin g < 20 5 2.17 (0.89–5.31) (smokers > 20 1 1.36 (0.19–9.75) excluded),
education level, family history of lung cancer
Pukkala et al., in 15 m illion Occupation from Pain ters [3,465] SIR: [1.24 Country, sex,
press, Denmark people in the selfadministered (1.20–1.28)] age, period
1971–2003, 1960, 1970, census M en 3,418 1.23 (1.19–1.28)
Finland 1971– 1980/1981, an d/ questionnaire Wom en 47 1.90 (1.40–2.53)
2005, or 1990 censuses
Icelan d1982–2004, and the 2.8 Norway 1961– million incident 2003, Sweden cancer cases 1961–2005 diagnosed in
these people in a followup until about 2005 were linked to Nordic n ation al registries
Boice et al. 1999, 1,216 painters Detailed job history Pain ter 41 SMR: 1.11 Age, sex, race,
Lockheed Martin (1,139 m en, 77 from work history [0.80–1.51] calendar year
Plant, Burbank, wom en) cards Los Angeles employed > 1
County, CA, USA year in the 1960–1996 aircraft industry
Steenland and Palu 42,170 painters Job titles inferred Pain ter 1,746 SMR: 1.23 Age, calendar
1999, California, an d 14,316 from union (1.17–1.29) tim e
Missouri, New nonpainters with membership York, Texas, USA, > 1 year union records that 1975–1994 membership identified the
members’ specialty affiliation and trade of the local union
van Loon et al. 58,729 m en , Paint exposure Paint dust Age, other
1997, The 55–69 years of from a self exposure occupational
Netherlands age, were administered Any b 18 RR: [2.41 exposures,
1986–1990 enrolled from questionnaire and (1.07–5.44)] sm okin g
the general casebycase expert Low 4 2.29 (0.61–8.63) habits, dietary
Dutch assessm ent High 14 2.48 (0.88–6.97) intake of
population pValue for < 0.01 vitamin C, β
-trend carotene, and
retin ol
Alexander et al. 2,429 chromate Exposure to All workers 15 SIR: 0.8 (0.4–1.3) Age, sex, race,
1996, Seattle, WA, exposed workers chromium (VI) was calendar year
USA 1974–1994 employed > 6 estimated from months in the industrial hygiene aerospace measurements and industry workhistory
records
zyxwvutsrqponmlkjihgfedcbaZYXWVUTSRQPONMLKJIHGFEDCBA
Table 1. continuation
Reference, location, and time period Cohort description Expo sure assessm ent Expo sure categories No. of cases/ deaths
HR/ RR/ SIR/ SMR (95% CI)
Adjustment for potential co nfo unders
Hrubec et al. 1995, USA 1954–1980 1,178 painters assembled from a roster of approximately 300,000 white male veterans of Occupation and usual industry of employment from mailed questionnaire Painters, construction, and m aintenance 36 SMR: 1.1 [0.77–1.43] Smoking, age, calendar time World War I Bethune et al. 1995; OPCS 1995, England and Wales, United Kingdom 1976–1989 Men from the 1971 and 1981 census cohorts who died between 1976 Occupation from death certificates Painters and decorators NG SMR: 1.51 (1.22–1.85) Age, sex, calendar year an d 1989 Gubéran et al. 1989, Switzerland 1971–1984 1,916 m ale painters from the 1970 Geneva Occupation from the 1970 census
Pain ters 40 SIR: 1.47
[1.05–2.00]
Age, sex, m atrim onial status, calendar census year OPCS 1986, Scotland, England, and Wales, United Kingdom 1979– 1980, 1982–1983 Men in Great Britain who died during 1979– 1980 and 1982– 1983; mortality of m en 15–74 Last fulltime occupation from death certificate Painters, decorators, French polishers M en
779 SMR: 1.44 [1.34–1.54] Age, sex years of age in England and Wales in 1981 Dubrow and Wegm an 1984, Massachusetts, USA 1971–1973 34,879 white men > 20 years of age Usual occupation from death certificate Pain ters grouped 110 SMR : 1.31 [1.08–1.58] Age Whorton et al. 1983, San Francisco/Oakland SMSA, CA, USA 1976–1978 2,200 painting union members (2,197 m en, 3 wom en)
1976–1977 un ion membership files
Pain ter 15 SIR: 1.99
[1.12–3.30] Age, sex, year OPCS 1978, England and Wales, United Kingdom 1970–1972 Registered deaths of 273,129 m en Last occupation recorded on the death certificate Painters and decorators 847 SMR: 1.39 [1.30–1.49] Age, sex Menck and Henderson 1976, Los Angeles County, CA, USA 1968–1970 Pooled mortality and morbidity data of 2,161 deaths from lung cancer and 1,777 incident cases of Last occupation from death certificates and surveillance registry files
Pain ter 87 SMR: 1.58
[1.27–1.95] Age lung cancer among white males OPCS 1971, England and Wales, United Kingdom 1959–1963 Registered deaths of men and wom en in England and Wales Last occupation from death certificate Painters and decorators 15–64 years of age Men an d wom en M en Single 1,506 1,502 4 SMR: 1.43 [1.36–1.51] 1.43 [1.36–1.50] 4.00 [1.09–10.24] Age, sex
wom en
G
Table 1. continuation
Reference, location, and time period Cohort description Expo sure assessm ent Expo sure categories No. of cases/ deaths
HR/ RR/ SIR/ SMR (95% CI)
Adjustment for potential co nfo unders
Dunn and Weir 1965, California, USA 1954–1962 Prospective study of > 68,000 men working in “suspicious” occupations (12,512 painters and decorators) Men were enrolled based on their occupation, identified through unions, and mailed questionnaire Painters and decorators 91 SMR: 1.14 [0.92–1.40] Age, smoking Enterline and McKiever 1963 Guralnick 1963, USA 1950 Men who died in the USA in 1950 Usual occupation and industry recorded from death certificates Painters ans plasterers 118 SMR: 1.51 [1.25–1.81] Age, race OPCS 1958, England and Wales, United Kingdom 1949–1953 Registered deaths of 221,941 m en and women in the broad occupational category of painters and decorators Occupation at time of death or last occupation from death certificates Other painters and decorators Men an d wom en M en Single wom en
912 909 3 SMR: [1.49 (1.40–1.59)] [1.49 (1.40–1.59)] 3.00 [0.62–8.77] Age, sex Abbreviations: HR, hazard ratio; NG, not given; SMSA, standard metropolitan statistical area. Values in brackets were calculated by us; a Information obtained by contacting authors; b Calculated using a fixedeffects model.
Table 2. Case–control studies of the association between lung cancer and occupation as a painter by publication date.
Reference, location, and time period Characteristics of cases Characteristics of controls Expo sure assessm ent
Expo sure No. of
expo sed cases
OR (95% CI) Adjustment
for potential confounders Zeka et al. 2006, Czech Republic, Hungary, Poland, Romania, Russia, Slovakia, United Kin gdom 1998–2002 223 never smoking cases (48 m en, 175 wom en) 1,039 n on sm okin g controls (534 m en , 505 wom en) Lifetim e occupational histories for jobs held > 1 year from inperson interview Pain ters Man and wom an Wom an
6 6 [1.81 (0.72–4.59)] 1.8 (0.53–6.0) Non e Sex, age, study center Baccarelli et al. 2005, Leningrad Province (Russia) 1993–1998 540 (474 m en , 66 wom en
582 (453 m en, 129 wom en) individuals withautopsy-based diagnoses of Lifetim e occupational histories from personal records Ever painters < 10 years >10 years 10 6 4 0.6 (0.3–1.4) 0.5 (0.2–1.5) 0.8 (0.2–3.0) Age, sex, sm okin g
zyxwvutsrqponmlkjihgfedcbaZYXWVUTSRQPONMLKJIHGFEDCBA
zyxwvutsrqponmlkjihgfedcbaZWTRQPOMLIFECA
Table 2. continuation
Reference, Characteristics Characteristics Expo sure Expo sure No. of OR (95% CI) Adjustment
location, and of cases of controls assessm ent expo sed for potential
time period cases confounders
De Stefani et al. 338 m en 1,014 m ales Lifetim e Ever painter 26 1.8 (1.0–3.1) Age,
2005, hospitalized occupational Em ploym ent residence,
Montevideo, for conditions history from (years) urban/rural
Uruguay not related to inperson 1–20 9.6 (2.6–36.0) status,
1994–2000 tobacco interview > 21 1.2 (0.6–2.2) education,
sm okin g, p for trend 0.07 sm okin g
matched by status and
age, residence years since
and urban/ quitting and
rural status age at start,
no. of cigarettes per day
Richiardi et al. 956 m en 1,253 m ale Lifetim e Ever 62 1.7 (1.1–2.8) Age, study
2004, Turin and population occupational painters area,
Easten Ven eto, based controls, history from sm okin g
Italy, 1990–1992 matched by inperson (never, ex,
study area, 5- interview active
year age groups smokers),
no. of job periods, education
Bouchardy et al. 9,106 m en 49,028 m ale Longest, Plasterers 273 1.1 (1.0–1.3) Age, registry,
2002, cantons of n on –lu n g current, or and painters civil status,
Basel, Geneva, St cancer most recent (in the period of
Gall, Vaud, and registrants occupation construction diagnosis,
Zurich, as recorded industry) nationality,
Switzerland, at the time urban/rural
1980–1993 of residence,
registration socioeconomic
(main or status,
best histologic
specified confirmation,
occupation in form ation
in Zurich from death
Registry) certificate
only (cases)
Matos et al. 200 m en 397 m ale Full Ever 16 1.2 (0.5–2.4) Age,
2000, Buenos controls occupational painters hospital,
Aires, Argentina, hospitalized history from sm okin g
1994–1996 for non– inperson (packyears),
tobacco interview. other
related Further occupations
conditions, details with
matched by requested significant
hospital and for ORs
age occupations (p < 0.05)
held > 1 year
Pohlabeln et al. 650 1,542 Inperson Ever 6 1.84 (0.59–5.74) Age, center
2000, 12 centers n on sm okin g n on sm okin g interview for painters in Germany, cases a (509 controls lifetim e (men) Italy, Portugal, wom en , 141 (1,011 occupational Sweden, United m en ) fem ales, 531 history
Kin gdom , males)
France, and Spain, 1988–1994
e C
o
le
tiv
a, 1
6
(8
):3
6
1
3
3
6
3
2
, 2
0
1
1
zyxwvutsrqponmlkjihgfedcbaZYXWVUTSRQPONMLKJIHGFEDCBA
G
Table 2. continuation
Reference, Characteristics Characteristics Expo sure Expo sure No. of OR (95% CI) Adjustment
location, and of cases of controls assessm ent expo sed for potential
time period cases confounders
Jahn et al. 1999; 686 wom en , 712 fem ale Full Ever 13 3.0 (0.73–12.33) Sm okin g,
BruskeHohlfeld 3,498 m en and 3,541 occupational painters asbestos,
et al. 2000 b , male history and (wom en) education,
Germ any, population supplementary Ever age, region
1988–1993, controls jobspecific painters/ of residence
1990–1996 modules lacquerers
from in M en 147 1.42 (1.05–1.92)
person Men an d [160] [1.47
interview wom en (1.09–1.97)]c
Pezzotto and 367 m en 586 hospital Lifetim e House 4 2.4 (0.4–19.4) Age,
Poletto 1999, based males occupational painters sm okin g
Rosario City, controls history for habit,
Argen tin a, admitted for a each job lifelon g
1992–1998 non–sm oking- held > 1 year cigarette
related disease from consumption
at the same standardized hospitals for questionnaire traum atic
conditions, urologic diseases, acute surgical conditions, and other illnesses, matched by age (± 3 years); mean age 60.1 ± 10.2 years
Muscat et al. 365 black 251 male and Only “usual” Ever [24] [1.32 Age, 1998, New York men and 185 135 fem ale occupation painters (1.30–1.35)]c education, City, Long black women black patients; and whether Mend [19] [0.68 sm okin g
Island, NY; conditions the job Wom en (0.29–1.59)]
Philadelphia, PA; unrelated to en tailed 5 1.8 (0.3–12.3)
Washington, tobacco use, regular
DC; Detroit, MI; matched by exposure to
Chicago, IL, race, sex, 5- an
USA, year age occupational
1978–1996 groups, month exposure
of diagnosis (for a m in im u m of 8 hr/ week) was obtained from interviews with subjects or their next of kin or death certificates
WünschFilho et 398 cases (307 860 controls Full Ever 128 0.77 (0.56–1.08) Age, sex,
al. 1998, São m en , 91 (546 m en, 314 occupational painters hospital,
Paulo, Brazil, wom en) wom en) history from (men) sm okin g,
1990–1991 hospitalized inperson cancer in
for non– interview fam ily,
tobacco m igration
related history,
conditions, socioeconomic
matched by status
age, sex, hospital
zyxwvutsrqponmlkjihgfedcbaZYXWVUTSRQPONMLKJIHGFEDCBA
Table 2. continuation
Reference, Characteristics Characteristics Expo sure Expo sure No. of OR (95% CI) Adjustment
location, and of cases of controls assessm ent expo sed for potential
time period cases confounders
De Stefani et al. 270 m en 383 m ale Lifetim e Ever 18 1.2 (0.6–2.4) Age,
1996, hospitalbased occupational painters residence,
Montevideo, controls: other history from Em ploym ent education,
Uruguay, cancer sites inperson (years) tobacco
1993–1994, except oral interview 1–20 0.9 (0.2–3.0) sm okin g
South America cavity, pharynx, > 21 1.4 (0.6–3.1) (pack–years),
esophagus, alcohol
stom ach, consumption
larynx, and bladder
Fin kelstein 1995, 967 m en 2,821 men who Occupation Painters and 16 1.25 (0.63–2.36) Age, year of
Hamilton and died of ay cause (job and plasterers death, city of
Sault SteMarie, other than lung industry) residence
Ontario, Canada, cancer, matched from death
1979–1988 by age, year of certificate
death, and city of residence
Notani et al. 246 m en 212 m ale Lifetim e Ever 6 1.62 (0.4–7.0) Age,
1993 hospitalbased occupational painters com m unity,
Bombay, India, controls history from sm okin g
1986–1990 diagnosed with inperson (two groups)
cancers of the interview mouth and oro
or
hypopharynx and
noncancerous oral disease, frequency matched by age and community
Swanson et al. 3,792 m ales 1,966 m ales Lifetim e Pain tin g Age at
1993, Detroit, (2,866 white, (1,596 white, occupational m achin e diagnosis,
MI, metropolitan 926 black) 370 black) with and operators, packyears of
area, USA, 1984– colon and rectal sm okin g black and cigarette
1987 cancer history from white sm okin g
telephone < 10 years 40 [1.19
interviews (0.61–2.34)]e
with subjects > 10 years 40 [2.23
or their (1.05–4.73)]e
surrogates < 20 years 53 [1.15 (0.65–2.04)]e > 20 years 27 [4.62
(1.61–13.31)]e
Morabia et al. 1,793 m en 3,228 controls “Usual” Pain ters [13] 0.8 (0.32–2.03) Age,
1992, Detroit, not hospitalized occupation geographic
MI; Chicago, IL; for lung cancer and area, race,
Philadelphia, PA; but including exposure sm okin g,
Pittsburgh, PA; tobaccorelated circumstances study period
New York, NY; conditions; from in
Long Island, NY; matched by age, person San Francisco, race, hospital, interview
CA; Birmingham, sm okin g
AL, USA, history,
1980–1989, admission date
American Health Foundation study
e C
o
le
tiv
a, 1
6
(8
):3
6
1
3
3
6
3
2
, 2
0
1
1
G
Table 2. continuation
Reference, Characteristics Characteristics Expo sure Expo sure No. of OR (95% CI) Adjustment
location, and of cases of controls assessm ent expo sed for potential
time period cases confounders
Burns and 5,935 (3,918 3,956 (1,981 Lifetim e Pain ters 97 1.96 (1.23–3.13) Age at Swan son 1991, m ales, 2,017 m ales, 1,975 occupational (usual diagnosis,
Detroit, MI, fem ales) females) with history from occupation, race,
m etropolitan colon and telephone grouped) smoking, sex
area, USA rectal cancer interviews to
the subjects or to their surrogates
Siem iatycki 857 m en 533 Lifetim e Construction Age, family
1991, Montreal, population occupational painter in com e,
Can ada, controls, history from An y 26 1.4 (0.77–2.17) ethnicity,
1979–1985 1,360 cancer interview exposure respondent
controls type,
cigarette and alcohol index
Bethwaite et al. 4,224 m en 15,680 m ale Current/ Pain ter 88 1.12 (0.93–1.52) Age
1990, New n on –lu n g most recent decorators,
Zealand, cancer occupation steel and
1980–1984 registrants as recorded other
at the time construction of painters, car registration; painters, sm okin g spray history painters, obtained signwriters, through other telephone unclassified interview painters
Zahm et al. 4,431 white 11,326 white Occupation Painters, 37 2.0 (1.2–3.3) Age,
1989, Missouri, male cases m ale non– at the time paper sm okin g
USA, lung cancer of diagnosis hangers,
1980–1985 registrants abstracted plasterers
from m edical records
Levin et al. 733 m en 760 age Lifetim e Ever painter 15 1.4 (0.5–3.5) Age,
1988, China, m atched occupational Duration sm okin g
1984–1985 population history from (years)
controls interview < 10 7 1.9 (0.36–16.60)f 10–19 2 2.8 (0.07–62.47)f 20–29 5 2.2 (0.26–26.67)f > 30 1 0.3 (0.01–5.81)f
> 10 8 [1.34
(0.26–6.92)]e
< 20 9 [2.35
(0.44–12.47)]e
> 20 6 [1.18
(0.18–7.64)]e
Ronco et al. 126 m en 384 men who Lifetim e Pain ter 5 1.33 (0.43–4.11) Age, year of
1988, Italy, died from occupational death,
1976–1980 causes other history from sm okin g,
than from interview other
sm oking with next of em ploym en t
related or kin in suspect
chronic lung highrisk
diseases occupations
Table 2. continuation
Reference, Characteristics Characteristics Expo sure Expo sure No. of OR (95% CI) Adjustment
location, and of cases of controls assessm ent expo sed for potential
time period cases confounders
Vineis et al. 2,973 m en 3,210 m en Lifetim e Pain ters 201 1.1 (0.9–1.4) Age, birth
1988, Analysis occupational cohort,
of five case– history from sm okin g
control studies interview
in Louisiana, with subjects
Florida, or next of
Pennsylvania, kin
Virginia, and New Jersey, USA, 1970s and 1980s
Lerchen et al. 771 cases (333 771 controls Lifetim e Ever 9 2.7 (0.8–8.9) Age,
1987, New m en , 173 (499 m en, 272 occupational construction ethnicity,
Mexico, USA, wom en) wom en) history from painters sm okin g
1980–1982 interview (men)
Coggon et al. 738 m ale 1,221 other Occupation Painters and 20 1.3 (0.62–2.72) Age,
1986g, bronchial cancers from mailed decorators sm okin g,
Cleveland, cancer cases questionnaire residence,
Humberside, respondent
Cheshire counties, United Kin gdom , 1975–1980
1.7 (0.4–7.3) Age,
Kjuus et al. 176 cases 176 age Longest job Pain tin g, 5 sm okin g
1986, Norway, m atched held from
paper-1979–1983 hospital interview hanging
controls and work (occupation) excluding site records
those with physical or m en tal handicaps, poor general health, or diagnosed with chronic obstructive lung disease
Milne et al. 925 lung 4,880 deaths Occupation Pain ters 24 1.80 (1.09–2.98)h Age 1983, Alam eda cancer deaths from other from death (men)
Countr y, CA, (747 m en, cancers certificates
USA, 178 wom en) (except
1958–1962 pancreatic,
bladder, nasal, kidney, hematopoietic) that are not known to be strongly associated with occupational risk factors (reported as the “reduced con trol group”)
e C
o
le
tiv
a, 1
6
(8
):3
6
1
3
3
6
3
2
, 2
0
1
1
G
Table 2. continuation
Reference, Characteristics Characteristics Expo sure Expo sure No. of OR (95% CI) Adjustment
location, and of cases of controls assessm ent expo sed for potential
time period cases confounders
Williams et al. 432 cases 2,173 patients Main Pain tin g 12 4.21 (1.40–12.65) Age, race,
1977, Atlan ta, with cancers lifetim e (men) (p < 0.01) education,
GA; other than em ploym en t tobacco,
Birmingham, lung, larynx, from survey alcohol,
AL; Colorado; oral cavity, questionnaire geographic
DallasFt. esophagus, location
Worth, TX; bladder
Detroit, MI; Minneapolis-St.Paul, MN; Pittsburgh, PA; San Francisco Oakland, CA, USA, Third National Cancer Survey
Viadana et al. Lung cancer Non can cer Lifetim e Pain ter
1976, Decouflé cases from admissions occupation Ever 42 1.90 (1.32–2.48) Sm okin g,
et al. 1977, 11,591 wite from the same from age
Houten et al. male cancer cancer interview 1977, Buffalo, cases treatm en t before
NY, USA, center diagnosis
1956–1965
Breslow et al. 518 patients 518 hospital Interview Construction 22 [1.87 Hospital,
1954, California, controls and (0.93–3.77)] age, sex, race
USA, matched by m aintenance
1949–1952 hospital, age, painters for
sex, race > 5 years
Wynder and 200 cases 200 controls Lifetim e Painter > 5 11 [5.76 Non e
Graham 1951, with a chest occupational years within (1.41–23.44)]
St. Louis, MO, disease other history from the last 40
USA, NG than lung interview years
cancer
NG, not given. Values in brackets were calculated by us.
a Nonsmokers, subjects who smoked < 400 cigarettes during their lifetime. b BIPS study in Bremen area and Frankfurt/Main area; GSF study in
NordrheinWestfalen, RheinlandPfalz and Bayern, Saarland, Thuringen, and Sachsen. cFixedeffects model used to calculate a weighted average. d The
study partially overlaps with Morabia et al. 1992 and thus some estimations were used to eliminate the overlap in men and the estimated variance was
doubled to approximate an adjusted CI. e Calculated using a fixedeffects model. f Variance was doubled to approximate an adjusted 95% CI. g Included in
the analysis restricted to case–control studies but excluded from the combined metaanalysis because of possible overlap with OPCS 1986. h The CI was
estimated by applying the ratio of reduced/total controls to the observed cell counts reported for the total control group.
An an alysis r estr icted to n ever sm oker s (metaRR = 2.00; 95% CI, 1.09–3.67; I2 = 0%, p =
0.97) (Kreuzer et al. 2001; Pronk et al. 2009; Zeka et al. 2006) and neversmokers and nonsmokers (metaRR = 1.96; 95% CI, 1.15–3.35; I2 = 0%, p =
0.99) (Pohlabeln et al. 2000) demonstrated stron- ger associations than overall estimates. Regard-less of study design, the studies that adjusted for other occupational exposures as well as smoking further strengthened the results (metaRR = 1.57; 95% CI, 1.21–2.04; I2 = 0%, p = 0.68). Because
estimates were relatively consistent between indi-vidual studies, regardless of study design, it is
reasonable to assume that there is no important confounding by tobacco smoking or other occu-pational exposures among the studies that were not able to adjust for these factors.
Analysis by duration of exposure (< 10 years vs. > 10years, < 20 years vs. > 20years) (Baccarelli et al. 2005; Dalager et al. 1980; Levin et al. 1988; Pronk et al. 2009; Swanson et al. 1993) showed that those exposed > 10 years (metaRR = 1.95; 95% CI, 1.26–3.02; I2 = 0%, p = 0.63) or > 20 years
(metaRR = 2.00; 95% CI, 1.01–3.92; I2 = 16.4%, p
Percent
Study RR (95% CI) weight
5.76 (1.4123.44 1.87 (0.933.77) 1.90 (1.322.48) 4.21 (1.4012.65) 1.80 (1.092.98) 1.70 (0.407.30) 2.70 (0.808.90) 1.10 (0.901.40) 1.40 (0.503.50) 1.33 (0.434.11) 2.00 (1.203.30) 1.12 (0.931.52) 1.96 (1.233.13) 1.40 (0.772.17) 0.80 (0.322.03) 1.62 (0.407.00) 1.25 (0.632.36) 1.20 (0.602.40) 1.32 (1.301.35) 0.77 (0.561.08) 1.47 (1.091.97) 2.40 (0.4019.40) 1.84 (0.595.74) 1.20 (0.502.40) 1.10 (1.001.30) 1.70 (1.102.80) 1.80 (1.003.10) 0.60 (0.301.40) 1.81 (0.724.59) 1.35 (1.221.51) 1.49 (1.401.59) 1.43 (1.361.51) 1.39 (1.301.49) 1.44 (1.341.54) 1.51 (1.221.85) 1.51 (1.251.81) 1.14 (0.921.40) 1.58 (1.271.95) 1.99 (1.123.30) 1.31 (1.081.58) 1.47 (1.052.00) 1.10 (0.771.43) 0.80 (0.401.30) 2.48 (0.886.97) 1.11 (0.801.51) 1.23 (1.171.29) 1.24 (1.201.28) 2.00 (0.904.50) 1.36 (1.291.44) 1.325 (1.291.41) 0.09 0.37 1.57 0.15 0.69 0.09 0.13 2.71 0.19 0.15 0.68 2.32 0.79 0.65 0.22 0.09 0.41 0.38 8.93 1.46 1.74 0.05 0.14 0.30 4.96 0.79 0.55 0.31 0.21 31.13 7.60 8.03 7.42 7.37 2.94 3.43 2.91 2.92 0.60 3.31 1.51 1.62 0.51 0.17 1.55 8.15 8.65 0.28 68.87 100.00 Case-control Wynder and Graham 1951 Breslow et al. 1954 Viadana et al. 1976 Williams et al. 1977 Milne et al. 1983 Kjuus et al. 1986 Lerchen et al. 1987 Vineis et al. 1988 Levin et al. 1988 Ronco et al. 1988 Zahm et al. 1989 Bethwaite et al. 1990 Burns and Swanson 1991 Siemiatycki et al. 1991 Morabia et al. 1992 Notani et al. 1993 Finkelsteins et al. 1995 De Stefani et al. 1996 Muscat et al. 1998 WunschFilho et al. 1998 Jahn et al. 1999; BruskeHohlfeld 2000 Pezzotto et al. 1999 Pohlabeln et al. 2000 Matos et al. 2000 Bouchardy et al. 2002 Richiardi et al. 2004 De Stefani et al. 2005 Baccarelli et al. 2005 Zeka et al. 2006
Subtotal (I2 = 48.4%, p=0.002)
Cohort and record linkage
OPCS 1958 OPCS 1971 OPCS 1978 OPCS 1986 OPCS 1995 Guralnick et al. 1963 Dunn and Weir 1965 Manck and Henderson 1976 Whorton et al. 1983 Dubrow and Wegman 1984 Guberan et al. 1989 Hrubec et al. 1995 Alexander et al. 1996 Van Loon et al. 1997 Boice et al. 1999 Steenland and Palu 1999 Pukkala et al. 2009 Pronk et al. 2009
Subtotal (I2 = 76.4%, p= 0.000)
Overall (I2 = 63.6%, p= 0.000)
x x x x x x x x x x x x x x x x x e C o le tiv a, 1 6 (8 ):3 6 1 3 3 6 3 2 , 2 0 1 1
0.5 1 2 5
RR estimate
Figur FigurFigur
G
L
o
g
R
R
2 1 0 1 2
0 0.5 1
SE of log RR
Figure 2. Begg’s funnel plot with pseudo95% CIs
to assess publication bias in case–control studies of lung cancer among persons reoporting occupation as a painter.
0%, p = 0.46) or < 20 years (metaRR = 1.37; 95%
CI, 0.89–2.13; I2 = 0%,
p = 0.54) (reference catego-ry, 0years of exposure), respectively.
Discussion
Previous studies demonstrating an increased risk of lung cancer in painters have allowed IARC to classify occupation as a painter as carcinogenic to humans (Group 1) (IARC 1989, in press). This metaanalysis supports the IARC Group 1 clas-sification by demonstrating a 35% increased risk of lung cancer in painters after adjusting for smok-ing (meta RR = 1.35; 95% CI, 1.21–1.51; I2 = 41.2%,
p = 0.01). This association was stronger for pop
ulationbased case–control studies (meta OR, 1.34; 95% CI, 1.18–1.51; I2 = 25.9%, p = 0.16) or studies
that adjusted for other potentially confounding occupational exposures (meta RR = 1.57; 95% CI, 1.21–2.04;
I2 = 0%, p = 0.68). Furthermore, expo-sure–response analyses suggested that the risk increased with duration of employment. Although paint composition or the painting environment could have differed by major geographic region, the results did not vary much when stratified by region (North America, Europe, Asia, and South America). This is the first metaanalysis that dem- onstrates a relative increase in incidence/mortali-ty from lung cancer in persons occupationally exposed as painters when restricted to neversmok- ers (and also nonsmokers), as well as demon- strating a statistically significant, positive dura-tion–response relationship.
It is important to note that the interpretation of a metaSMR (or metaSIR) for the cohort and record linkage studies is difficult because differ-ent reference populations were used in each study for the calculation of expected cases or deaths (Rothman et al. 2008). Although the cohort stud- ies of painters could assess possibly higher expo- sures from longer periods of followup, expo-sure assessment in many of the record linkage studies was often crude: Occupation as a painter was usually assessed at a single time point in a census and then linked to death registries. Al- though there can be relatively poor correspon- dence between occupation recorded on death cer-tificates an d in cen sus records (Dubrow an d Wegm an 1984; Enterline and McKiever 1963; Guralnick 1963; OPCS 1971, 1978) and there is a chance of falsepositive results due to multiple testing of occupations in record linkage studies, the SMRs were remarkably consistent between individual studies, generally ranging between 1.10 and 2.57. This also suggested that the significant results were not likely due to chance. Thus, the approach to combine the cohort and record link-age study SMRs for calculatin g a m etaSMR seemed to be justified.
In case–control studies, painters may only form a small proportion of the study population, but the full occupational history and additional information on lifestyle factors allowed several studies to adjust for tobacco smoking and some for other occupational carcinogens. An increased lung cancer risk associated with painting was con- sistently demonstrated in the case–control stud-ies, suggesting that occupation as a painter is a risk factor for lung cancer. Populationbased case– control studies may be less subject to selection biases than hospitalbased case–control studies (Rothman et al. 2008) because there is generally no concern about the appropriate source popu- lation if indeed the general population is repre- sented. However, if response rates are low in pop- ulation controls, this could result in a lack of com-parability with cases and therefore be prone to selection biases. A subanalysis comparing the meta OR of hospitalbased and populationbased case–control studies showed similar results.
same range of effect as the analyses overall and in cohort studies, further suggesting that these re-sults remained robust to these biases.
Smokingadjusted estimates were available for 23 of 29 case–control studies and in only 4 of 18 cohort and record linkage studies. The robust-ness of the summary estimates after adjusting for tobacco use, and the higher relative risk in neversmokers, suggest that residual confound- ing by tobacco use is unlikely and that occupa-tion as a painter is independently associated with the risk of lung cancer.
In women, the metaRR was similar for all studies (metaRR = 2.04; seven studies) (Jahn et al. 1999; Muscat et al. 1998; OPCS 1958, 1971; Pronk et al. 2009; Pukkala 2009; Zeka et al. 2006) and for studies restricted to neversmokers (meta RR = 2.00; three studies) (Kreuzer et al. 2001; Pronk et al. 2009; Zeka et al. 2006), further strengthening the evidence that the results are not confounded by smoking. However, female paint- ers (and neversmoking females) may not actu-ally have a higher risk of lung cancer compared with male painters (metaRR = 1.37; 39 studies). The relative risk in women is higher, which may be due to the fact that women have a lower back-ground lung cancer risk than men (Schottenfeld and Fraumeni 2006).
The robustness of the results is also indicated by the presence of a duration–response relation-ship, with higher RRs seen for exposure over ed 10 years (metaRR = 1.95) and ed 20 years (meta RR = 2.00) compared with those with < 10 and < 20 years of exposure, respectively (the reference category was no exposure).
Some painters (e.g., in the construction in-dustry) could have been exposed to asbestos. Indeed, a number of studies have shown an in-creased risk of mesothelioma in painters (Brown et al. 2002; Peto et al. 1995), which is most likely due to occupational asbestos exposure. Howev- er, taking into account that the exposure–re-sponse relationship for pleural mesothelioma is very different from that for lung cancer, poten-tial asbestos exposure cannot explain all of the increase in lung cancer. Therefore, other suspect-ed carcinogens to which painters are exposed, such as chlorinated solvents, chromium VI com-pounds, and cadmium compounds (IARC 1987, 1995, 1999, in press; Straif et al. 2009), may also partially explain the increased risk of lung cancer. Very few studies reported results for specific sus-pected causative agents. van Loon et al. (1997)
reported a positive exposure–response relation-ship with paint dust and Siemiatycki et al. (1987) found a suggestive association with mineral spir-its, whereas Alexander et al. (1996) did not find an increased risk of lung cancer in a cohort of painters and other employees in the aerospace industry exposed to chromium VI compounds.
Conclusion
There is great variability and complexity in paint- ing environments, which complicates the inter-pretation of epidemiologic studies of lung cancer risks in painters. Painters are exposed to a wide variety of chemical mixtures, with compositions that change over time. In more recent decades, a number of hazardous chemicals—including ben- zene, some other solvents, phthalates (plasticiz- ers), and lead oxides—have been reduced or re-placed in paint, although these chemicals are still used in some countries. This trend in reducing exposures to hazardous chemicals in paint has been promoted by the increasing use of water based paints and powder coatings. New formu-lations may also contain lowertoxicity solvents, neutralizing agents (e.g., amines), and biocides (IARC 1989, in press). However, this has not yet resulted in lower relative risks for lung cancer in painters, as reported in the more recent observa-tional epidemiologic studies. The elevated risk of lung cancer may also be partly due to the role that other substances may play in increasing the risk of lung cancer among painters.
Although there was not enough information in the studies provided to assess the association of lung cancer with specific chemical agents en- countered in painting, the robustness of the esti-mates in the subgroup analyses (by sex, region, study design, and controlling for smoking and other occupational exposures) and the stronger associations seen in specific subgroups (by du-ration of exposure) support the conclusion that occupational exposures in painters are causally associated with the risk of lung cancer. Because several million people are employed as painters worldwide and because lung cancer is the most common cancer in painters, even a modest in- crease in the relative risk is remarkable. It is im- portant for cancer control and prevention to de-sign studies with better exposure assessment to identify the underlying carcinogenic agents en-countered in painting.
e C
o
le
tiv
a, 1
6
(8
):3
6
1
3
3
6
3
2
, 2
0
1
1