A novel body mass index reference range - an
observational study
Sirlei Siani Morais,* Mirena Ide, Andrea Moreno Morgan, Fernanda Garanhani Surita
Departamento de Ginecologia e Obstetricia, Faculdade de Ciencias Medicas, Universidade de Campinas (UNICAMP), Campinas, SP, BR.
OBJECTIVE:To generate a new body mass index curve of reference values and ranges for body mass index and weight gain during pregnancy and to compare the new curve and weight gain ranges with the currently used references.
METHODS:A prospective observational study was conducted with a total of 5,656 weight and body mass index measurements in 641 women with single pregnancy who attended their first prenatal visit before 12 weeks. All the women were over 18 years old and had no medical conditions that would influence body mass index. Data were collected using prenatal charts and medical records during hospitalization for childbirth. A linear regression method was used for standard curve smoothing in the general population and for specific curves according to the baseline body mass index classification. Curves were obtained for the 5th, 10th, 50th, 85th, 90th and 95th percentiles. Concordance between the classification of women using the newly generated and currently used curves was evaluated by percentages and kappa coefficients. The weight gain was compared with the reference values of the Institute of Medicine using Student’s T test. The data were analyzed using SAS software version 9.2, and the significance level was set at 5%.
RESULTS: A general reference curve of percentiles of body mass index by gestational age was established. Additionally, four specific curves were generated according to the four baseline body mass index categories. The new general curve offered percentile limits for women according to their initial body mass index and according to the Centers for Disease Control and Prevention limits, showing poor agreement with the currently used curve (48.3%). Women who were overweight or obese when starting prenatal care had higher weight gain than the Institute of Medicine recommendation.
CONCLUSIONS:The new proposed curve for body mass index during pregnancy showed weak agreement with the currently used curve. The new curve provided more information regarding body mass index increase using percentiles for general and specific groups of body mass index. Overweight pregnant women showed an upward body mass index trend throughout pregnancy that increased more dramatically than those of other groups of pregnant women, and they also presented a major mean difference between weight gain and the Institute of Medicine recommendation.
KEYWORDS: Gestational Weight Gain; Body Mass Index; Prenatal Care.
Morais SS, Ide M, Morgan AM, Surita FG. A novel body mass index reference range - an observational study. Clinics. 2017;72(11):698-707 Received for publication onJanuary 24, 2017;First review completed onMay 22, 2017;Accepted for publication onSeptember 4, 2017 *Corresponding author. E-mail: [email protected]
’ INTRODUCTION
Nutritional disorders have become a worldwide problem due to the high prevalence of obesity during different stages of life. For women of reproductive age, two extreme condi-tions should be considered: on the one hand, obesity and excessive gestational weight gain (WG), and on the other hand, women with insufficient WG who compulsively avoid increased weight during pregnancy (1-6).
Several recommendations for gestational WG have been adopted in different populations based on different para-meters, such as weight or body mass index (BMI) before pregnancy and distribution curves of increased BMI or WG ranges during pregnancy. However, because of intense socio-cultural and behavioral changes in the last few decades, it is necessary to update the scientific knowledge and the normal range for these recommendations and, therefore, to establish parameters for health professionals to guide pregnant women (7,8).
These recommendations differ among countries. In Sweden, Germany, Switzerland, Austria and Turkey, the recom-mendations are based on caloric intake. The Institute of Medicine (IOM) in the United States suggests a weekly WG range by trimester based on pre-pregnancy BMI. WG recom-mendations according to pre-pregnancy BMI are followed by other countries (Italy, Vietnam, Western European countries, DOI:10.6061/clinics/2017(11)09
Copyright&2017CLINICS–This is an Open Access article distributed under the terms of the Creative Commons License (http://creativecommons.org/licenses/by/ 4.0/) which permits unrestricted use, distribution, and reproduction in any medium or format, provided the original work is properly cited.
Australia and Pacific Islands). The total WG forecast is also used in clinical practice. Increased caloric intake until the end of pregnancy is recommended in Japan. Singapore uses WG according to height, and the Philippines, India and Sudan use a recommendation of simply gaining weight and following a good diet (7).
In Brazil, the Ministry of Health suggests the use of Atalah’s curve (9), which incorporates the intersection of BMI and gestational age and has the advantage of not requiring a standard reference. BMI use simplifies nutritional assessments during pregnancy, is easy to calculate and demonstrates a good association with the degree of adiposity and the risk of non-communicable chronic diseases (9,10).
However, the use of Atalah’s curve in Brazil should con-sider the pre-pregnancy BMI classification, which differs from the current WHO classification. The curve was devel-oped a few decades ago; it does not provide clinical para-meters to evaluate upper and lower limits for obese and underweight women and was developed from a cross-sectional study of Chilean women (7,9,11).
The purpose of the present study was to assess BMI during pregnancy using a longitudinal study of Brazilian pregnant women to generate a reference curve according to pre-pregnancy BMI and, therefore, to provide new parameters that could be used to monitor the weight of women during pregnancy.
’ MATERIALS AND METHODS
The research protocol for this study was approved by the Institutional Review Board of the School of Medical Sciences of the University of Campinas and took into account all the requirements established by the Brazilian National Health Council.
A prospective observational study was conducted at the State Hospital of Sumaré (SHS), a university teaching hos-pital that is a reference for low-risk pregnant women and is affiliated with the University of Campinas. This hospital is located in the metropolitan region of Campinas, state of São Paulo, Brazil. The state of São Paulo has the highest popu-lation density in the country, with an estimated popupopu-lation of 41 million, and the metropolitan region of Campinas has the third largest population of women of reproductive age (12,13). From March to October 2015, data were collected from prenatal charts and the medical records of women who gave birth at the SHS. Women who had some conditions that could influence BMI during pregnancy, such as diabetes, drug use, HIV infection, multiple pregnancy or cancer, as well as women without prenatal care, with onset of prenatal care after 16 weeks of gestational age or women under 18 years of age, were excluded.
The sample size was calculated to evaluate the BMI varia-tion with a representative number of weight measurements in all gestational ages. We used a reported BMI mean value of 24.2±4.5 kg/m2in pregnancy. Considering a significance
level of 5% and variation of 2%, the sample size was esti-mated to be 333 women (to evaluate the BMI variation) (14). To evaluate the measurement, it was estimated that most women had approximately six prenatal visits during pre-gnancy. According to data from SHS in 2009, for the 2,340 deliveries that occurred there, an average number of 14,040 measurements would be available (15). Considering a sig-nificance level of 5% and a sampling error of 2%, the sam-ple size was calculated as 2,050 measurements. A total of
849 clinical records were assessed, among which 753 met the inclusion criteria and 641 contained complete information as required by the study protocol. The records showed that the prenatal charts contained between 6-16 weight measure-ments, resulting in 5,656 weight measurements at different gestational ages.
The inclusion criteria were verified with a checklist, and the available data were transcribed into a specific form and stored in an Excel file. Double entry of the data was perfor-med, and then the data were validated in Excel. After a detailed consistency checking procedure, inconsistencies in the database were reassessed using the data collection form, clinical records and prenatal charts as the main sources of data.
Data analyses
For maternal and perinatal data assessments, absolute and relative frequencies were used for the sample of 641 women. They were classified according to the first BMI evaluation during prenatal care, as defined by the WHO criteria using the weight/height2formula, into four categories: low weight (o18.5 kg/m2), adequate weight (18.5 to o25.0 kg/m2), overweight (25.0 too30 kg/m2) and obese (X30 kg/m2) (16).
The weight measurement was first assigned using the dependent data; however, because the measurements were collected from prenatal charts, there were substantial missing data at many gestational ages. Therefore, the values were studied in independent form: each gestational age and wei-ght was considered one measurement of the sampling unit. All the measurements and a stratification of the sample according the classes of initial BMI (WHO criteria) were evaluated to determine the equation to describe the evalua-tion of the change in weight and BMI according to gesta-tional age during pregnancy using a simple linear regression, and they were found to be normally distributed. However, the coefficient determination (R2) estimated for the curve by linear regression was low, and the curves were considered to have low predictive value.
The 5th, 10th, 50th, 85th, 90th and 95th percentiles for gestational age for the entire sample and for initial BMI stratification were described. A simple linear regression was also used for these new values to smooth the curve, and the equation was used to estimate the reference values for each percentile. The smoothed equation of the percentiles that was obtained from the entire sample curve was then used to classify each of the 641 women during early pregnancy (first measure), in the middle of pregnancy (between 19-23 weeks) and at the last prenatal evaluation (between 35 to 41 weeks). We classified the women according to four categories using the same percentiles as the Centers for Disease Control and Prevention (CDC) (17): low weight (those with BMI oP5), adequate weight (BMI XP5 and BMI oP85), overweight (BMIXP85 and BMIoP95) and obese (BMI4P95).
The mean WG during pregnancy was then compared with the IOM recommendation, and the difference was calculated and compared using Student’s T test.
The women were also classified by their BMI using two different instruments, the newly proposed curve and Atalah’s curve, during the three different periods of pregnancy: early, middle and late. The classification by Atalah’s curve was then compared with the classification by the new curve to assess prominent modifications. McNemar’s test and the weighted kappa coefficient, with its respective confidence intervals, were used. The significance level was 5%, and the data were
699
analyzed using SAS version 9.4 software Copyright (c) 2002-2012 by SAS Institute Inc., Cary, NC, USA.
All STROBE statement items for a prospective study were followed and checked in this manuscript (18). Financial sup-port for the current study was obtained from the São Paulo Research Foundation (FAPESP), grant number 2014/01770-7. The content of this article is solely the responsibility of the authors and does not necessarily represent the official views of FAPESP, which did not influence the content of the manuscript.
’ RESULTS
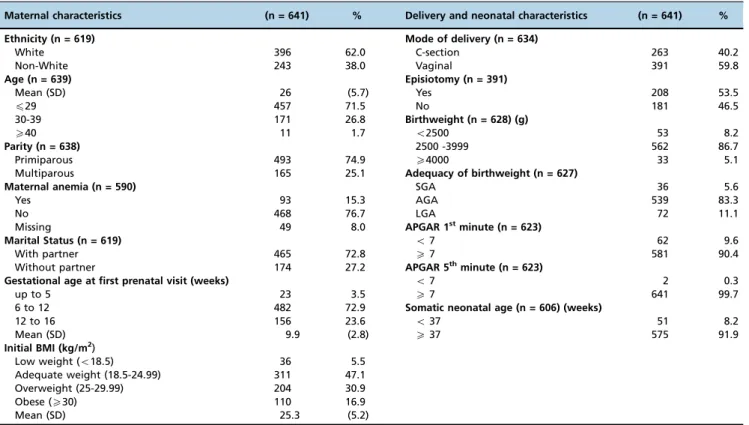
A total of 5,656 weight and BMI measurements from 641 women with single pregnancy and first prenatal visit before 16 weeks were obtained. Most of the women had white skin color (62%), were 20-34 years old (76.5%), and were pri-miparas (74.5%), and maternal anemia was present in 15.3% of the sample. Prenatal care was started between 6 and 12 weeks in 72.9% and between 12 and 16 weeks in 23.6% of the women. The first BMI measurement during prenatal care classified 47.1% of the women as adequate weight, 30.9% as overweight, and 16.7% as obese, resulting in a total of 47.5% of women with excessive weight. Vaginal delivery occurred in 59.8% of all pregnancies. Neonatal results showed that most newborns weighed 2,500-4,000 g (86.7%). Macrosomia occurred in 5.1% of newborns. Complete data with some characteristics of the sample are presented in Table 1.
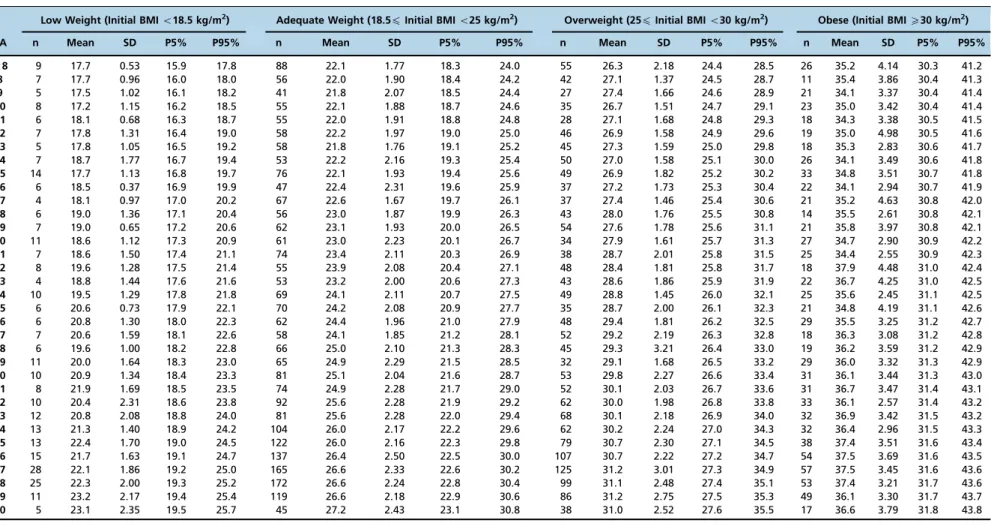
The mean increase in BMI during gestation was 2.7 to 4.6 units, representing a percentage mean increase in BMI between 8.2 and 26.1%. Of the women classified as obese at the first prenatal visit, 33.7% had excessive gestational WG according to the IOM recommendation (Table 2).
Women classified at the first prenatal visit as low weight or adequate weight did not present any significant difference between their gestational WG during pregnancy and the IOM recommendation. Women classified as overweight at the first prenatal visit had a mean WG of 4.1 kg above that recom-mended by the IOM, and those classified as obese had a mean WG of 2.2 kg above the IOM recommendation.
Using the equations presented in Table 3, we can estimate the percentiles of BMI for any gestational age.
However, we estimated the 5th, 10th, 50th, 85th, 90th and 95thpercentiles for each gestational age to evaluate the BMI of the pregnant women using the equation for each gesta-tional age between 8 and 40 weeks. The reference values for these percentiles are available in Table 4 or were alternatively generated using an Excel file calculator provided by the authors at https://www.dropbox.com/s/mbsfldtv257n6zn/ calculadora%20-%20link.xlsx?dl=0.
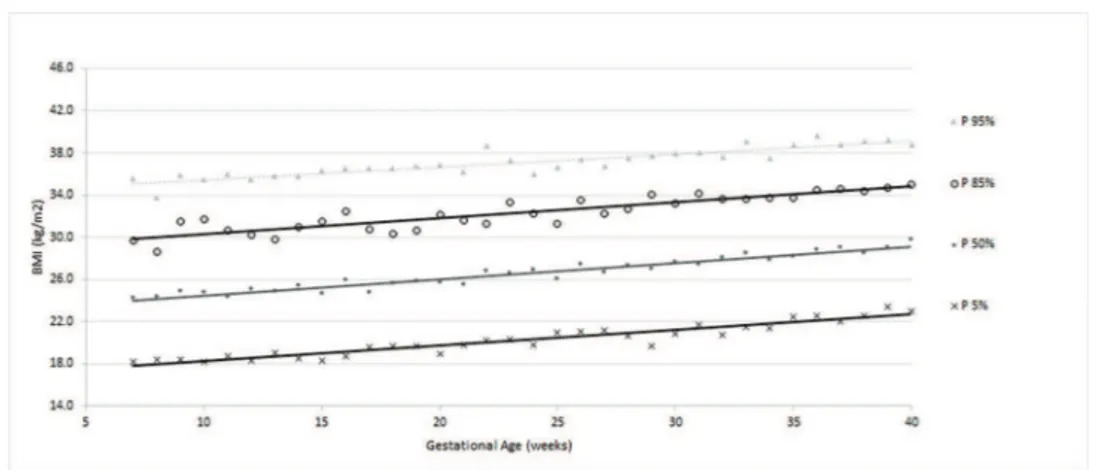
According to the obtained reference value data, a general curve was created. Four other specific curves were generated according pregestational BMI to monitor WG and conse-quent changes in BMI during pregnancy (figures 1 to 5).
The ranges of BMI values between percentiles 50 and 90 or between 50 and 95 were larger than the ranges of BMI between percentiles 5 and 50 or 10 and 50, showing a trend toward a higher concentration of cases in the upper part of the curve.
The four smoothed curves generated according to the first prenatal BMI were similar to the general curve at some points. However, there were different slopes by initial BMI. The slope of the line generated for the 50thpercentile was higher among women with a normal weight (slope=0.167), followed by over-weight (slope=0.159), low-over-weight (slope=0.156) and obese women (slope=0.115), demonstrating that the majority of
Table 1-Sociodemographic, nutritional, delivery and neonatal characteristics of the sample.
Maternal characteristics (n = 641) % Delivery and neonatal characteristics (n = 641) %
Ethnicity (n = 619) Mode of delivery (n = 634)
White 396 62.0 C-section 263 40.2
Non-White 243 38.0 Vaginal 391 59.8
Age (n = 639) Episiotomy (n = 391)
Mean (SD) 26 (5.7) Yes 208 53.5
p29 457 71.5 No 181 46.5
30-39 171 26.8 Birthweight (n = 628) (g)
X40 11 1.7 o2500 53 8.2
Parity (n = 638) 2500 -3999 562 86.7
Primiparous 493 74.9 X4000 33 5.1
Multiparous 165 25.1 Adequacy of birthweight (n = 627)
Maternal anemia (n = 590) SGA 36 5.6
Yes 93 15.3 AGA 539 83.3
No 468 76.7 LGA 72 11.1
Missing 49 8.0 APGAR 1stminute (n = 623)
Marital Status (n = 619) o7 62 9.6
With partner 465 72.8 X7 581 90.4
Without partner 174 27.2 APGAR 5thminute (n = 623)
Gestational age at first prenatal visit (weeks) o7 2 0.3
up to 5 23 3.5 X7 641 99.7
6 to 12 482 72.9 Somatic neonatal age (n = 606) (weeks)
12 to 16 156 23.6 o37 51 8.2
Mean (SD) 9.9 (2.8) X37 575 91.9
Initial BMI (kg/m2)
Low weight (o18.5) 36 5.5
Adequate weight (18.5-24.99) 311 47.1
Overweight (25-29.99) 204 30.9
Obese (X30) 110 16.9
Mean (SD) 25.3 (5.2)
women (50%) who initially gained weight had an adequate weight or were overweight (Table 3).
The curve of the women with low weight (figure 2) dis-played a greater dispersion of BMI values during the final weeks than in the first week of prenatal care. The mean WG in these women with low weight was 12.1±4.7 kg, ranging
between 0.80 kg and 24.9 kg. The average percentage of WG was 26.1±10.6%, ranging from 1.6% to 51.7% (data not
shown).
In women with an adequate initial BMI, the new curve (figure 3) showed that BMI increases occurred proportionally throughout gestation, as shown by the parallel percentile lines. The average WG of women with an adequate BMI was 11.5±5.0 kg. The mean percentage of WG was 20.3±9.0%
(data not shown).
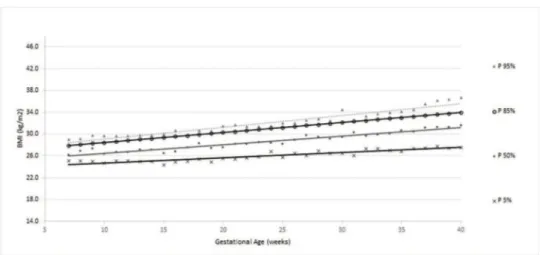
For women classified as overweight, the slopes of the percentiles were mostly lower than those of the low-weight, adequate-weight and obese women (figure 4). The average WG (in kg) of overweight women was 10.1±6.4 kg, ranging
from -10.6 kg to 28.2 kg. The average percentage of WG was 14.5%±9.5% (data not shown).
Obese women displayed a curve with a broad slope (figure 5), but an increase in data dispersion (variation of percentiles around the smoothed line) and a greater range were observed compared with those in the other groups. The average WG percentage was 7.2%±5.8%, ranging from -9.4%
to 28.8% (data not shown).
The agreement between the new curve and Atalah’s curve was approximately 50%. Among the 51.7% of women with discordant data in early pregnancy, 39.8% (27.7% over-weight/adequate + 12.1% obese/overweight) represented an underestimation of Atalah’s curve compared with the new curve for women classified as underweight or over-weight by Atalah’s curve. In the middle of pregnancy, the most discordant findings (25.8%) were for women classified as overweight by Atalah’s curve and adequate by the new curve. At the end of the prenatal period, this percentage was 26.7%. There was complete disagreement regarding women classified as overweight by Atalah’s curve. In general, Atalah’s curve provided classifications with good agreement for adequate women but with disagreement for low-weight and overweight women. The agreement could be considered weak for all the evaluated data based on the values obtained by the weighted kappa (Table 5).
’ DISCUSSION
The results of this study add reference values for BMI throughout gestation, both with regard to the lower limit through the 5thand 10thpercentile curves and to the upper limits through the 90th and 95th percentile. The smoothed
curves provide health teams with clinical tools to evaluate the BMI of pregnant women at each gestational age through-out pregnancy. A pregnant woman’s BMI values can be evaluated using the curve of the general population and, more specifically, through the different curves established according to BMI in early pregnancy using the WHO criteria (four categories). The standard increase in BMI during pregnancy was specific to each classification of early BMI in prenatal care, as observed in other studies (11,19,20).
The new curves showed weak agreement with the current curve (Atalah’s). However, an overestimation of the values at the beginning of prenatal care was observed, which is consistent with previous comparisons with Atalah’s curve
Table 2 -Gest ation al weigh t gain accor ding to initi al BMI and comp arison with the IOM recomm enda tions. WHO BMI classification at first pr enatal visit BMI increase in gestation* W eight gain in gestation* N % mean SD % mean SD IOM recommendation % of extra IOM** p-value mean S D Low weight 36 5.5 4.6 1.8 26.1 1 0.0 12.1 4.7 12.5 18.0 11.8 0.6324 Adequate weight 311 47.1 4.4 1.9 20.3 9.0 11.5 5.0 11.5 16.0 15.7 0.6695 Overweight 204 46.1 3 .9 2.5 14.5 9 .5 10.1 6 .4 7.0 1 1.5 38.2 o 0.0001 Obesity 110 16.6 2 .7 2.2 8 .2 6.5 7 .2 5.8 5 .0 9.0 33.7 o 0.0001 * The initial weight was considered the weight at the first prenatal care visit (max: 12 weeks). ** Percentage of women with weight gain greater than the IOM recommendati on, according to the original BMI classification. WHO = W orld Health Organization. BMI = body mass index. SD = standard deviation. IOM = Institute of Medicine. p -value = T test of mean weight gain during gestation and respective mean of IOM recommendation. 701
Weight Gain Percentile Intercept Slope X GA R2of model BMI (kg/m2) of percentile example for GA (weeks)
12 20 28
Any Initial BMI
Adequate Gain P 5 = 16.8 + 0.147 X GA 0.90 18.6 19.7 20.9 P 10 = 17.4 + 0.168 X GA 0.96 19.4 20.8 22.1 P 50 = 22.9 + 0.155 X GA 0.93 24.8 26.0 27.2 P 85 = 28.8 + 0.151 X GA 0.79 30.6 31.8 33.0 Excessive Gain P 90 = 31.3 + 0.134 X GA 0.62 32.9 34.0 35.1 P 95 = 34.3 + 0.122 X GA 0.80 35.8 36.7 37.7
Low Weight (Initial BMIo18.5 kg/m2)
Adequate Gain P 5 = 15.1 + 0.110 X GA 0.57 16.4 17.3 18.2 P 10 = 14.8 + 0.133 X GA 0.73 16.4 17.5 18.5 P 50 = 16.2 + 0.156 X GA 0.93 18.1 19.3 20.6 P 85 = 16.1 + 0.212 X GA 0.93 18.6 20.3 22.0 Excessive Gain P 90 = 16.5 + 0.207 X GA 0.85 19.0 20.6 22.3 P 95 = 16.1 + 0.240 X GA 0.83 19.0 20.9 22.8
Adequate Weight (18.5pInitial BMIo25 kg/m2)
Adequate gain P 5 = 17.2 + 0.145 X GA 0.93 18.9 20.1 21.3 P 10 = 17.4 + 0.163 X GA 0.96 19.4 20.7 22.0 P 50 = 20.2 + 0.167 X GA 0.93 22.2 23.5 24.9 P 85 = 22.1 + 0.178 X GA 0.94 24.2 25.7 27.1 Excessive Gain P 90 = 22.3 + 0.190 X GA 0.95 24.6 26.1 27.6 P 95 = 22.6 + 0.207 X GA 0.95 25.1 26.7 28.4
Overweight (25pInitial BMIo30 kg/m2)
Adequate Gain P 5 = 23.8 + 0.090 X GA 0.85 24.9 25.6 26.3 P 10 = 24.0 + 0.106 X GA 0.92 25.3 26.1 27.0 P 50 = 24.9 + 0.159 X GA 0.94 26.8 28.1 29.4 P 85 = 26.6 + 0.183 X GA 0.93 28.8 30.3 31.7 Excessive Gain P 90 = 27.0 + 0.186 X GA 0.94 29.2 30.7 32.2 P 95 = 27.0 + 0.214 X GA 0.93 29.6 31.3 33.0
Obese (Initial BMIX30 kg/m2)
Adequate Gain P 5 = 30.0 + 0.040 X GA 0.35 30.5 30.8 31.1 P 10 = 30.3 + 0.070 X GA 0.55 31.1 31.7 32.3 P 50 = 32.8 + 0.115 X GA 0.72 34.2 35.1 36.0 P 85 = 37.9 + 0.070 X GA 0.14 38.7 39.3 39.9 Excessive Gain P 90 = 39.0 + 0.061 X GA 0.09 39.7 40.2 40.7 P 95 = 40.6 + 0.079 X GA 0.12 41.5 42.2 42.8
GA = gestational age, BMI = body mass index. P = percentile, R2= determination coefficient.
Weight gain: underweight = any BMI value lower than P5; Obesity = any BMI value greater than P95.
702
body
mass
index
reference
range
SS
et
al.
CLINICS
2017;72
Table 4-Reference values of BMI according to initial BMI classification: low-weight and adequate-weight pregnant women.
Low Weight (Initial BMIo18.5 kg/m2) Adequate Weight (18.5pInitial BMIo25 kg/m2) Overweight (25pInitial BMIo30 kg/m2) Obese (Initial BMIX30 kg/m2)
GA n Mean SD P5% P95% n Mean SD P5% P95% n Mean SD P5% P95% n Mean SD P5% P95%
o8 9 17.7 0.53 15.9 17.8 88 22.1 1.77 18.3 24.0 55 26.3 2.18 24.4 28.5 26 35.2 4.14 30.3 41.2 8 7 17.7 0.96 16.0 18.0 56 22.0 1.90 18.4 24.2 42 27.1 1.37 24.5 28.7 11 35.4 3.86 30.4 41.3 9 5 17.5 1.02 16.1 18.2 41 21.8 2.07 18.5 24.4 27 27.4 1.66 24.6 28.9 21 34.1 3.37 30.4 41.4 10 8 17.2 1.15 16.2 18.5 55 22.1 1.88 18.7 24.6 35 26.7 1.51 24.7 29.1 23 35.0 3.42 30.4 41.4 11 6 18.1 0.68 16.3 18.7 55 22.0 1.91 18.8 24.8 28 27.1 1.68 24.8 29.3 18 34.3 3.38 30.5 41.5 12 7 17.8 1.31 16.4 19.0 58 22.2 1.97 19.0 25.0 46 26.9 1.58 24.9 29.6 19 35.0 4.98 30.5 41.6 13 5 17.8 1.05 16.5 19.2 58 21.8 1.76 19.1 25.2 45 27.3 1.59 25.0 29.8 18 35.3 2.83 30.6 41.7 14 7 18.7 1.77 16.7 19.4 53 22.2 2.16 19.3 25.4 50 27.0 1.58 25.1 30.0 26 34.1 3.49 30.6 41.8 15 14 17.7 1.13 16.8 19.7 76 22.1 1.93 19.4 25.6 49 26.9 1.82 25.2 30.2 33 34.8 3.51 30.7 41.8 16 6 18.5 0.37 16.9 19.9 47 22.4 2.31 19.6 25.9 37 27.2 1.73 25.3 30.4 22 34.1 2.94 30.7 41.9 17 4 18.1 0.97 17.0 20.2 67 22.6 1.67 19.7 26.1 37 27.4 1.46 25.4 30.6 21 35.2 4.63 30.8 42.0 18 6 19.0 1.36 17.1 20.4 56 23.0 1.87 19.9 26.3 43 28.0 1.76 25.5 30.8 14 35.5 2.61 30.8 42.1 19 7 19.0 0.65 17.2 20.6 62 23.1 1.93 20.0 26.5 54 27.6 1.78 25.6 31.1 21 35.8 3.97 30.8 42.1 20 11 18.6 1.12 17.3 20.9 61 23.0 2.23 20.1 26.7 34 27.9 1.61 25.7 31.3 27 34.7 2.90 30.9 42.2 21 7 18.6 1.50 17.4 21.1 74 23.4 2.11 20.3 26.9 38 28.7 2.01 25.8 31.5 25 34.4 2.55 30.9 42.3 22 8 19.6 1.28 17.5 21.4 55 23.9 2.08 20.4 27.1 48 28.4 1.81 25.8 31.7 18 37.9 4.48 31.0 42.4 23 4 18.8 1.44 17.6 21.6 53 23.2 2.00 20.6 27.3 43 28.6 1.86 25.9 31.9 22 36.7 4.25 31.0 42.5 24 10 19.5 1.29 17.8 21.8 69 24.1 2.11 20.7 27.5 49 28.8 1.45 26.0 32.1 25 35.6 2.45 31.1 42.5 25 6 20.6 0.73 17.9 22.1 70 24.2 2.08 20.9 27.7 35 28.7 2.00 26.1 32.3 21 34.8 4.19 31.1 42.6 26 6 20.8 1.30 18.0 22.3 62 24.4 1.96 21.0 27.9 48 29.4 1.81 26.2 32.5 29 35.5 3.25 31.2 42.7 27 7 20.6 1.59 18.1 22.6 58 24.1 1.85 21.2 28.1 52 29.2 2.19 26.3 32.8 18 36.3 3.08 31.2 42.8 28 6 19.6 1.00 18.2 22.8 66 25.0 2.10 21.3 28.3 45 29.3 3.21 26.4 33.0 19 36.2 3.59 31.2 42.9 29 11 20.0 1.64 18.3 23.0 65 24.9 2.29 21.5 28.5 32 29.1 1.68 26.5 33.2 29 36.0 3.32 31.3 42.9 30 10 20.9 1.34 18.4 23.3 81 25.1 2.04 21.6 28.7 53 29.8 2.27 26.6 33.4 31 36.1 3.44 31.3 43.0 31 8 21.9 1.69 18.5 23.5 74 24.9 2.28 21.7 29.0 52 30.1 2.03 26.7 33.6 31 36.7 3.47 31.4 43.1 32 10 20.4 2.31 18.6 23.8 92 25.6 2.28 21.9 29.2 62 30.0 1.98 26.8 33.8 33 36.1 2.57 31.4 43.2 33 12 20.8 2.08 18.8 24.0 81 25.6 2.28 22.0 29.4 68 30.1 2.18 26.9 34.0 32 36.9 3.42 31.5 43.2 34 13 21.3 1.40 18.9 24.2 104 26.0 2.17 22.2 29.6 62 30.2 2.24 27.0 34.3 32 36.4 2.96 31.5 43.3 35 13 22.4 1.70 19.0 24.5 122 26.0 2.16 22.3 29.8 79 30.7 2.30 27.1 34.5 38 37.4 3.51 31.6 43.4 36 15 21.7 1.63 19.1 24.7 137 26.4 2.50 22.5 30.0 107 30.7 2.22 27.2 34.7 54 37.5 3.69 31.6 43.5 37 28 22.1 1.86 19.2 25.0 165 26.6 2.33 22.6 30.2 125 31.2 3.01 27.3 34.9 57 37.5 3.45 31.6 43.6 38 25 22.3 2.00 19.3 25.2 172 26.6 2.24 22.8 30.4 99 31.1 2.48 27.4 35.1 53 37.4 3.21 31.7 43.6 39 11 23.2 2.17 19.4 25.4 119 26.6 2.18 22.9 30.6 86 31.2 2.75 27.5 35.3 49 36.1 3.30 31.7 43.7 40 5 23.1 2.35 19.5 25.7 45 27.2 2.43 23.1 30.8 38 31.0 2.52 27.6 35.5 17 36.6 3.79 31.8 43.8
P5% - 5th Percentile - Inferior Limit; P95% - 95th Percentile - Superior Limit.
703
CLINICS
2017;72(
11):698-707
A
novel
body
mass
index
reference
range
Morais
SS
et
and is likely due to ethnic and cultural differences between Atalah’s original population and the Brazilian sample (21,22). Although it is the standard and recommended by the Ministry of Health in Brazil, Atalah’s curve has limitations, such as a lack of upper limits for pregnant women classified as obese and lower limits for pregnant women classified as under-weight (9,12). Atalah’s curve was developed in the 1990s; since
then, there have been changes in behavior and gestational weight recommendations, as well as cultural and racial influ-ences that might impact the results in different countries (16,23). The results were based on a specific population with cer-tain socio-demographic and cultural characteristics, which could be considered a standard low-risk population of pre-gnant women. These women had the expected nutritional
Figure 1 -Percentiles and smoothed curves of BMI by gestational age – total sample (any initial BMI).
Figure 2 -Percentiles and smoothed curves of BMI by gestational age for women classified as low weight at the first prenatal visit.
status for a middle-income setting, a low rate of anemia and a proportion of overweight women similar to those pre-viously described. To be applied at a national or higher level,
these results would need to be validated with data from larger samples and from different populations. This method could minimize the influence of factors such as ethnicity,
Figure 4 -Percentiles and smoothed curves of BMI by gestational age for women classified as overweight at the first prenatal visit.
Figure 5 -Percentiles and smoothed curves of BMI by gestational age for women classified as obese at the first prenatal visit.
Table 5-Concordance between BMI classifications during pregnancy by Atalah’s curve and the proposed new curve (for all women).
Curves Beginning of
prenatal period
Middle (19 - 23 weeks)
Last prenatal visit
Atalah’s / Proposed Curve n % n % n %
Concordant
Low Weight 26 4.2 37 5.6 30 4.5
Adequate Weight 252 40.6 267 40.3 233 35.2
Overweight 0 0.0 0 0.0 0 0.0
Obesity 22 3.5 29 4.4 57 8.6
TOTAL of concordant 300 48.3 333 50.2 320 48.3
Discordant
Adequate / Low Weight 3 0.5 9 1.4 50 7.6
Overweight / Adequate 172 27.7 171 25.8 177 26.7
Overweight / Obesity 71 11.4 67 10.1 45 6.8
Obesity / Overweight 75 12.1 83 12.5 70 10.6
Adequate / Overweight 0 0.0 0 0.0 0 0.0
Low Weight / Adequate 0 0.0 0 0.0 0 0.0
TOTAL of discordant 321 51.7 330 49.8 342 51.7
McNemar’s p-value o0.0001 o0.0001 o0.0001
kappa (CI) 0.36 (0.32-0.41) 0.39 (0.35-0.44) 0.37 (0.33-0.42)
CI = confidence interval.
705
nutritional status or educational level. Hopefully, the present study population could be considered a representative sam-ple of Brazilian pregnant women providing results that should be considered for public health purposes (12,24).
The sample size was estimated for the total sample, not for a stratified sample (using the initial BMI such as presented in this article). In this case, an increase in the variability of the small stratum occurs, such as the women classified as low weight at the beginning of prenatal care. At most gestational ages, there were fewer than 10 observations, and in these cases, the rank statistics (such as percentiles) were strongly affected by the sample size (25). These results must be used and evaluated with some restrictions, since a limitation of this study is the altered precision due to the reduced strati-fied sample size.
Another limitation of this study can be considered the statistical method. The approach that was applied was an empirical method followed by a regression analysis to smooth the curves. The absence of dependency of the data between measurements may have resulted in a loss of variance (total and specific models) because we did not consider correlations. However, the number of samples that could be analyzed with dependency was very small due to the lack of data, and the global variance tended to be larger because of the small sample size. Additionally, Atalah’s curve (actual reference curve) was not generated using dependent data (9,25).
The curves displayed approximately similar shapes with different levels that were identified when the data were stratified according to the four possible categories of BMI during early prenatal care. Women with low weight early in pregnancy gained weight faster in late pregnancy, as eviden-ced by the small range of the smoothed percentiles. Women with an adequate initial weight exhibited a uniform BMI increase throughout pregnancy, as demonstrated by the straight and parallel lines with a small range between perc-entiles at different gestational ages. Other studies have also shown that the differentiation of BMI categories provides important insights into neonatal and maternal outcomes (26,27). The evaluation of curves for overweight women suggests that this group requires special attention because they have a greater range of percentiles during late pregnancy and a steeper slope (sharper increase), which was also observed for underweight women. Overweight women displayed a similar WG to that of women with an adequate WG and a greater WG than that of obese women. Obesity is a known risk factor for adverse outcomes during pregnancy, often representing a bias because obesity may induce clinicians to underestimate the WG problem in overweight and/or adequate-weight women (27).
When the IOM guidelines are considered, excessive WG is again highlighted in the overweight group; similar data have also been described in other studies (28,29). These results demonstrate the need for special attention in over-weight women.
It is natural to anticipate that a standard curve according to the nutritional profile of each woman at the beginning of pregnancy would be feasible and useful. The current pro-posed model presents BMI percentile curves for women in general and according to BMI at early prenatal care. The results suggest a need for important changes in how BMI and WG are recommended and monitored during pregnancy (26,27). It would be possible and easier to follow the increase in percentiles of BMI similarly as for weight and height increases in children.
Guidelines are extremely important to support health care professionals in treating pregnant women and newborns, but we must consider the difficulties inherent in personal care, such as personal motivations and psychological support, that mathematical curves do not reflect. Thus, using curves is a simple method to professionally assess gestational WG in an individualized way. In Brazil specifically, this practice has been part of the prenatal routine for many years; our suggestion is that the currently used curve be replaced by the new proposed curve because it was created for Brazilian women.
Therefore, a BMI classification of a pregnant woman can be provided according to gestational age, and assessments of the changes in her BMI can be compared to standard percentiles. These new curves seem to be useful and provide another tool for health professionals to monitor maternal health. In addi-tion, depending on the provider’s decision, they can follow only women who are in the upper or lower limits for WG (11,23,30). The new curves developed in this work showed weak agreement with Atalah’s curve and provided additional information regarding BMI growth percentiles for general and specific body compositions. Women classified as over-weight at the first prenatal visit had higher than recom-mended WG and an upward trend of BMI throughout pregnancy that was sharper than for the majority of pregnant women, indicating the need for a special focus on over-weight women beginning in early prenatal care.
’ ACKNOWLEDGMENTS
We thank the São Paulo Research Foundation (FAPESP) for providing
financial support for the current study, grant number 2014/01770-7.
’ AUTHOR CONTRIBUTIONS
The idea for the study and this specific analytical approach were developed by Morais SS and Surita FG. Analyses were planned and performed by Morais and Surita FG. Thefirst version of the manuscript was drafted by Morais SS and Surita FG and then complemented with suggestions by Ide M and Morgan AM. Morais SS, Surita FG, Ide M and Morgan AM contributed to the development of the study protocol and approved the
final version of the manuscript.
’ REFERENCES
1. Biesmans K, Franck E, Ceulemans C, Jacquemyn Y, Van Bogaert P. Weight during the postpartum period: what can health care workers do? Matern Child Health J. 2013;17(6):996-1004, http://dx.doi.org/10.1007/s10995-012-1077-9.
2. National Institute for Health and Care Excellence (NICE). Dietary inter-vention and physical activiy internvetions for weight managemennt before, during and after pregnancy; 2005 [cited 2015]. Available from: http://guidance.nice.org.uk/CG/Published.
3. Dennedy MC, Dunne F. The maternal and fetal impacts of obesity and gestational diabetes on pregnancy outcome. Best Pract Res Clin Endo-crinol Metab. 2010;24(4):573-89, http://dx.doi.org/10.1016/j.beem.2010. 06.001.
4. Stothard KJ, Tennant PW, Bell R, Rankin J. Maternal overweight and obesity and the risk of congenital anomalies: a systematic review and meta-analysis. JAMA. 2009;301(6):636-50, http://dx.doi.org/10.1001/jama. 2009.113.
5. Li C, Liu Y, Zhang W. Joint and independent associations of gestational weight gain and pre-pregnancy body mass index with outcomes of pregnancy in Chinese women: a retrospective cohort study. PLoS One. 2015;10(8):e0136850, http://dx.doi.org/10.1371/journal.pone.0136850. 6. Gudnadóttir TA, Bateman BT, Hernádez-Díaz S, Luque-Fernandez MA,
Valdimarsdottir U, Zoega H. Body mass index, smoking and hypertensive disorders during pregnancy: a population based case-control study. PLoS One. 2016;11(3):e0152187, http://dx.doi.org/10.1371/journal.pone. 0152187.
Obes Rev. 2013;14(1):68-85, http://dx.doi.org/10.1111/j.1467-789X.2012. 01059.x.
8. Vinter CA, Frederiksen-Møller B, Weile LK, Lamont RF, Kristensen BR, Jørgensen JS. Second Nordic Congress on Obesity in Gynecology and Obstetrics (NOCOGO). Acta Obstet Gynecol Scand. 2016;95(1):121-8, http://dx.doi.org/10.1111/aogs.12822.
9. Atalah E, Castillo C, Castro R, Aldea A. [Proposal of a new standard for the nutritional assessment of pregnant women]. Rev Med Chil. 1997; 125(12):1429-36.
10. Ministério da Saúde. Pré-Natal e Puerpério atenc¸ão qualificada e
huma-nizada. Brasília (DF); 2005 [cited 2013]. Available from: http://bvsms. saude.gov.br/bvs/publicacoes/caderno5_saude_mulher.pdf.
11. Kac G, Nucci LB, Spyrides MH, Duncan BB, Schmidt MI. Evaluation of the ability of a Latin-American gestational weight curve to predict adverse pregnancy outcomes. Int J Gynaecol Obstet. 2009;106(3):223-6, http://dx. doi.org/10.1016/j.ijgo.2009.04.010.
12. Instituto Brasileiro de Geografia e Estatística (IBGE). CENSO demográfico 2010: características da populac¸ão e dos domicílios. Resultados do
uni-verso; 2010 [cited 2013 01/05]. Available from: http://biblioteca.ibge.gov.
br/visualizacao/periodicos/93/cd_2010_caracter-isticas_populacao_domicilios.pdf.
13. Fundac¸ão Sistema Estadual de Análise de Dados (SEADE). Perfil do
Estado de São Paulo; 2013 [cited 2013 01/06]. Available from: http:// www.seade.gov.br/produtos/perfil_estado/.
14. Grandi C, Luchtenberg G, Sola H. [Nutrition assessment during preg-nancy. A new weight chart]. Medicina (B Aires). 2007;67(6 Pt 2):677-84. 15. Hospital Estadual de Sumaré. HES em números. Dados Estatísticos 2009;
2009 [cited 2013 06/01]. Available from: http://www.hes.unicamp.br/ numeros/indicadores_site_2009.pdf.
16. World Health Organization (WHO). Resolution WHA57.17. Global strategy on diet, physical activity and health 57th World Health Assembly resolutions and decisions, annexes. Geneva, 17–22 May 2004: WHO; 2004.
17. Center for Disease Control and Prevention (CDC). Body mass index: considerations for practitioners; 2015 [cited 2015]. Available from: http:// www.cdc.gov/healthyweight/assessing/bmi/index.html.
18. von Elm E, Altman DG, Egger M, Pocock SJ, Gøtzsche PC, Vanden-broucke JP, et al. The Strengthening the Reporting of Observational Stu-dies in Epidemiology (STROBE) statement: guidelines for reporting observational studies. Int J Surg. 2014;12(12):1495-9, http://dx.doi.org/ 10.1016/j.ijsu.2014.07.013.
19. Forouzanfar MH, Alexander L, Anderson HR, Bachman VF, Biryukov S, Brauer M, et al. Global, regional, and national comparative risk assess-ment of 79 behavioural, environassess-mental and occupational, and metabolic
risks or clusters of risks in 188 countries, 1990-2013: a systematic analysis for the Global Burden of Disease Study 2013. Lancet. 2015;386(10010): 2287-323, http://dx.doi.org/10.1016/S0140-6736(15)00128-2.
20. Gilmore LA, Klempel-Donchenko M, Redman LM. Pregnancy as a win-dow to future health: Excessive gestational weight gain and obesity. Semin Perinatol. 2015;39(4):296-303, http://dx.doi.org/10.1053/j.semperi. 2015.05.009.
21. Benjumea MV. [Diagnostic accuracy of five gestational references to pre-dict insufficient birth weight]. Biomedica. 2007;27(1):42-55, http://dx.doi. org/10.7705/biomedica.v27i1.232.
22. Rached-Paoli I, Henriquez-Pérez G, Azuaje-Sánchez A. [Effectiveness of body mass index in the nutritional diagnosis of pregnant women]. Arch Latinoam Nutr. 2005;55(1):42-6.
23. Manyanga T, da Silva DF, Ferraro ZM, Harvey AL, Wilson S, Ockenden HN, et al. The effects of culture on guideline discordant gestational weight gain: a systematic review protocol. Syst Rev. 2015;4:145, http:// dx.doi.org/10.1186/s13643-015-0132-1.
24. Marchi J, Berg M, Dencker A, Olander EK, Begley C. Risks associated with obesity in pregnancy, for the mother and baby: a systematic review of reviews. Obes Rev. 2015;16(8):621-38, http://dx.doi.org/10.1111/obr. 12288.
25. Hair J, Anderson R, Tatham R, Black W. Multivariate data analysis. 5 ed. Upper Saddle River, NJ: Prentice Hall; 1998.
26. Ay L, Kruithof CJ, Bakker R, Steegers EA, Witteman JC, Moll HA, et al. Maternal anthropometrics are associated with fetal size in different peri-ods of pregnancy and at birth. The Generation R Study. BJOG. 2009; 116(7):953-63, http://dx.doi.org/10.1111/j.1471-0528.2009.02143.x. 27. Scott-Pillai R, Spence D, Cardwell CR, Hunter A, Holmes VA. The impact
of body mass index on maternal and neonatal outcomes: a retrospective study in a UK obstetric population, 2004-2011. BJOG. 2013;120(8):932-9, http://dx.doi.org/10.1111/1471-0528.12193.
28. Godoy AC, Nascimento SL, Surita FG. A systematic review and meta-analysis of gestational weight gain recommendations and related out-comes in Brazil. Clinics. 2015;70(11):758-64, http://dx.doi.org/10.6061/ clinics/2015(11)08.
29. Paulino DS, Surita FG, Peres GB, do Nascimento SL, Morais SS. Asso-ciation between parity, pre-pregnancy body mass index and gestational weight gain. J Matern Fetal Neonatal Med. 2016;29(6):880-4, http://dx. doi.org/10.3109/14767058.2015.1021674.
30. Opray N, Grivell RM, Deussen AR, Dodd JM. Directed preconception health programs and interventions for improving pregnancy outcomes for women who are overweight or obese. Cochrane Database Syst Rev. 2015;(7): CD010932, http://dx.doi.org/10.1002/14651858.CD010932.pub2.
707