www.rpped.com.br
REVISTA
PAULISTA
DE
PEDIATRIA
ORIGINAL
ARTICLE
Changes
in
physical
fitness
and
nutritional
status
of
schoolchildren
in
a
period
of
30
years
(1980---2010)
Gerson
Luis
de
Moraes
Ferrari
a,b,∗,
Victor
Keihan
Rodrigues
Matsudo
a,
Mauro
Fisberg
baCentrodeEstudosdoLaboratóriodeAptidãoFísicadeSãoCaetanodoSul(CELAFISCS),SãoCaetanodoSul,SP,Brazil
bAdolescentMedicineSection(CentrodeAtendimentoeApoioaoAdolescente---CAAA)oftheDepartmentofPediatrics,
UniversidadeFederaldeSãoPaulo---EscolaPaulistadeMedicina(Unifesp/EPM),SãoPaulo,SP,Brazil
Received16December2014;accepted27March2015 Availableonline28August2015
KEYWORDS
Child;
Physicalfitness; Nutritionalstatus
Abstract
Objective: Toanalyzeandcomparethechangesinphysicalfitnessaccordingtothenutritional statusandgenderofschoolchildrenduringaperiodof30years(1980---2010).
Methods: Four cross-sectionalevaluationswere performedevery 10years inaperiod of30 yearsfrom1978to1980(baseline),1988---1990(10years),1998---2000(20years)and2008---2010 (30years).Thesampleconsistedof1291schoolchildren(188inbaseline,307in10years;375in 20years;421in30years)of10and11yearsold.Thevariablesassessedwere:bodyweight(kg), height(cm),upperlimbstrength(ULS;kg),lowerlimbstrength(LLS;cm),agility(seconds)and velocity(seconds).Schoolchildrenwereclassifiedasnormalweightandoverweightaccording toWorldHealthOrganizationreference ofbodymassindexforageandgender.Comparisons amongperiodsappliedANOVAfollowedbyBonferronitest,withasignificancelevelsetatof
p<0.01.Variationbetweenbaselineand30yearswasassessedbythepercentagedelta.Seven differentpercentilevalueswerepresentedforeachvariable.
Results: In eutrophic boys and girls, mean values ofULS (−16.7%;−3.2%), agility (−1.5%;
−1.6%)decreasedsignificantlyafter30years(p<0.001).Intheoverweightboysandgirls,only theaverageULS(−15.5%;−12.5%)decreasedsignificantlyovertime(p<0.001).After30years, theULSpercentilechangedinboys.
Conclusions: Thedeclineinphysicalfitnesswasgreaterinschoolchildrenwithnormalweight thaninthosewithoverweight.
©2015SociedadedePediatriadeS˜aoPaulo.PublishedbyElsevierEditoraLtda.Thisisanopen accessarticleundertheCCBY-license(https://creativecommons.org/licenses/by/4.0/).
DOIoforiginalarticle:http://dx.doi.org/10.1016/j.rpped.2015.03.008
∗Correspondingauthor.
E-mail:[email protected](G.L.M.Ferrari).
2359-3482/©2015SociedadedePediatriadeS˜aoPaulo.PublishedbyElsevierEditoraLtda.ThisisanopenaccessarticleundertheCC
PALAVRAS-CHAVE
Crianc¸a; Aptidãofísica; Estadonutricional
Modificac¸õesdaaptidãofísicaeestadonutricionaldeescolaresemumperíodode30 anos(1980---2010)
Resumo
Objetivo: Analisarecompararasmudanc¸asdaaptidãofísicadeacordocomoestadonutricional esexodeescolaresdurante30anos(1980---2010).
Métodos: Quatroavaliac¸õestransversaisforamfeitasacada10anosem30anos:1978---1980 (linhadebase),1988---1990(10anos),1998---2000(20anos)e2008---2010(30anos).Aamostra consistiude1.291escolares(188nalinhadebase;307em10anos;375em20anos;421em30 anos)de10e11anos.Foramanalisados:pesocorporal(kg),estatura(cm),forc¸ademembros superiores(FMS;kg)einferiores(FMI;cm),agilidade(segundos)evelocidade(segundos).Os escolaresforamclassificadoscomoeutróficoseexcessodepesomedianteascurvaspropostas pelaOrganizac¸ãoMundialdaSaúdedeíndicedemassacorporal.FoiusadoAnovaseguidapelo métododeBonferroniparacompararosperíodoseadotadop<0,01.Variac¸ãoentrealinhade basee30anosfoiavaliadapelodeltapercentual.Foramapresentadossetedistintosvaloresde percentisparacadavariávelanalisada.
Resultados: Nos meninose nasmeninas eutróficos,as médiasdos valores daFMS (−16,7%;
−3,2%)eagilidade(−1,5%;−1,6%)diminuíramsignificativamenteem30anos(p<0,001).Nos meninosenasmeninascomexcessodepeso,somenteasmédias daFMS(−15,5%;−12,5%) diminuíramsignificativamente(p<0,001). Após30 anos,osvalores dospercentisdaFMSdos meninosapresentaramdiminuic¸ão.
Conclusões: Em30anos,odeclíniodaaptidãofísicafoimaiornosescolareseutróficosdoque naquelescomexcessodepeso.
©2015SociedadedePediatriadeS˜aoPaulo.PublicadoporElsevierEditoraLtda.Esteéumartigo OpenAccesssobalicençaCCBY(https://creativecommons.org/licenses/by/4.0/deed.pt).
Introduction
Physical fitness can be represented by several variables, andamongthemarebodycompositionmeasurements(body weightand bodymass index --- BMI), aswell as neuromo-tor (muscle strength, agility and velocity) and metabolic variables(cardiorespiratoryfitness).1,2If,ontheonehand, theprevalenceofoverweightschoolchildrenhasincreased alarmingly worldwide,3 onthe other hand, some physical fitnessvariables --- for instance, muscle strength and car-diorespiratoryfitness--- havedecreased in recent yearsin severalcountries.4,5 Somestudieshaveshownthatmuscle strengthandcardiorespiratoryfitness arenegatively asso-ciatedwithriskfactorsforcardiovasculardisease(CVD).6---8 Forinstance, overweightschoolchildren withlow physical fitnesshaveahigherriskof developingcardiovascular dis-eases,suchasobesity,diabetesandarterialhypertension.6,8 AccordingtoTomkinson,9 studiesanalyzing physical fit-ness variables over the years, available in developing countries,donotallowfirmconclusionstobedrawnabout themagnitudeofpossibletrends,andtemporalstudiescan provideinformationonhealthindicators(suchasoverweight andphysicalfitnessvariables),aswellasanunderstanding ofsocial,economicandculturalchangesofagivenregion. Ofallthestudiesthatanalyzedthebehaviorofphysical fit-nessvariablesovertheyearsinBrazil,onlythreeconsidered the body size,10---12 asoverweight or obese schoolchildren havelowerlevelsofphysicalfitnesswhencomparedtothose withnormalweight.13 Werecentlyshowedagreater reduc-tionincardiorespiratoryfitnessinschoolchildrenclassified ashavingnormalweight(25.8%)thaninthoseclassifiedas
overweight(16.2%)ina30-yearperiod.10Forthisreason,it issuggestedthatthelevelsofphysicalfitnessvariablesmay have decreasedinrecentyearsat differentmagnitudes in schoolchildren withdifferent nutritionalstatuses.14 There hasbeennostudyintheliteraturethatassessedchangesin physical fitnessvariablesinvolving musclestrength,agility andvelocityinschoolchildrenofdifferentbodysizesovera 30-yearperiod.
Inthisstudy,thehypothesisisthatthedecreasein phys-icalfitnessvariables(upperandlower-limbstrength,agility andvelocity),analyzedduringa30-yearperiod,isoccurring inboth schoolchildrenwithnormalweightandoverweight ones. Therefore,theaimof thestudywastoanalyzeand comparethechangesinphysicalfitnessvariablesaccording tothenutritionalstatusandgender inschoolchildrenover a30-yearperiod(1980---2010).
Method
haveundergoneacompletephysicalexaminationinoneof theanalyzed periods;tobebetween 10and11yearsold; with noclinical or functional limitations; to be classified asprepubertal,andparents/guardianssigningtheinformed consentform)werepublishedpreviously.10Todeterminethe biologicalmaturationstage,theself-assessmenttechnique ofsecondarysexualcharacteristicsaccordingtogenderwas used,whichhadalreadybeenvalidated(from0.60to0.71) for theIlhabela Projectitself.2 The project wasapproved by theInstitutional Review Boardof UniversidadeFederal deSãoPaulo(protocoln.0056/10).
Adatabasecontainingphysicalassessmentsfrom1978to 2011 was analyzed, consisting of 1291 students (Table 1) aged 10 and 11 years who participated in the study. Schoolchildren inthis agegroup wereselected ineach of thefourperiodswithcross-sectionalanalyses, carriedout every10yearsandoveraperiodof30years,from1978to 1980(baseline),1988---1990(10years),1998---2000(20years) and2008---2010(30years).
Allvariablesincludedinthisstudywereevaluatedinthe fourperiods,accordingtotheCELAFISCSstandardization.2 Of the anthropometric variables, body weight and height were measured.2 Three consecutive measurements were obtained,andthearithmeticmeanwasusedforthe analy-sis.BMI(kg/m2)wasusedfortheclassificationofnutritional
status.Tomeettheobjectiveofthepresentstudy,children wereclassifiedintotwogroups:normalweight,whenthez -scorewasbetween−2and1,andoverweight,whenzscore was>1,accordingtotheBMIcurvesproposedbytheWorld Health Organization (WHO).15 Schoolchildren withz-score <−2wereexcludedfromthestudy.
Physical fitness variables that were analyzed included upper (ULS) and lower-limb strength (LLS), agility and velocity.2 ULS was measured by a handgripdynamometer (Takei TK005, Tokyo, Japan) in kg. The students gripped thedynamometerwiththegreatestpossiblestrengthwith therighthand,withthearmextendedalongthebody.The bestresultoftwoattempts,performedatleasttwominutes apart,wasconsideredthefinalresult.LLSmeasurementwas obtained bythe verticaljump test without helpfrom the upper limbs, measured in cm. The tests were performed threetimes,andthebestresultwasconsideredforthe anal-ysis.Agilitywasmeasuredbytheshuttleruntest,andthe bestresult of twoattempts wasconsidered. Velocity was
evaluatedusingthe50-mruntestinasingleattempt.Before eachtest,thetestobjectivesandprocedureswerebriefly explainedtofacilitatetheirunderstandingbythe schoolchil-dren.
The reproducibility and objectivity of each test were calculatedina sub-sampleof 40studentsin each evalua-tion.Thereproducibilityvaluesrangedfrom0.95to0.97for bodyweight,0.97---0.99forheight,0.74to0.77for upper-limb strength, from0.77 to0.81 for lower-limb strength, from0.76 to 0.79 for agility, and 0.77 to 0.81 for veloc-ity.Regardingtheobjectivity,thevalueswere0.94---0.98for bodyweight,0.96to0.99forheight,0.75to0.79for upper-limbstrength,0.78to0.82forlower-limbstrength,0.77to 0.80foragility,and0.79to0.83forvelocity.
Data distribution was analyzed using the Kolmogorov---Smirnovtest,andthevariableswereexpressed as mean and standard deviation for numerical variables. The variationbetween baselineand 30 years wascarried out using the delta percentage (%). The comparison of thefourassessmentswasperformedbyanalysisofvariance (ANOVA) with three factors (gender, nutritional status anddecade), followed by Bonferroni multiple comparison test.16Sevendifferentpercentilevalues(5,10,25,50,75, 90and95) werecalculated for each decade,analyzed by genderforeachofthevariablesanalyzed.Thecalculations were performed using the Statistical Package for the SocialSciencessoftware(SPSS)version18.0,andstatistical significancewassetatp<0.01.16
Results
The proportionof male schoolchildrenclassified by nutri-tionalstatusaccordingtothedecadewas:1978---1980:27.2% normal weight and 22.3% overweight; 1988---1990: 35.8% normal weight and 20.5% overweight; 1998---2000: 41.6% normalweightand14.9%overweight;2008---2010:43.8% nor-mal weight and 15.2% overweight. The number of male schoolchildren withnormal weight washigher than those withoverweightinallevaluations.Asforfemales,the pro-portionwas:1978---1980,baseline:22.8%withnormalweight and27.7%overweight;1988---1990:20.2%withnormalweight and23.5%overweight;1998---2000:24.6%normalweightand 18.9% overweight; 2008---2010: 21.6% normal weight and
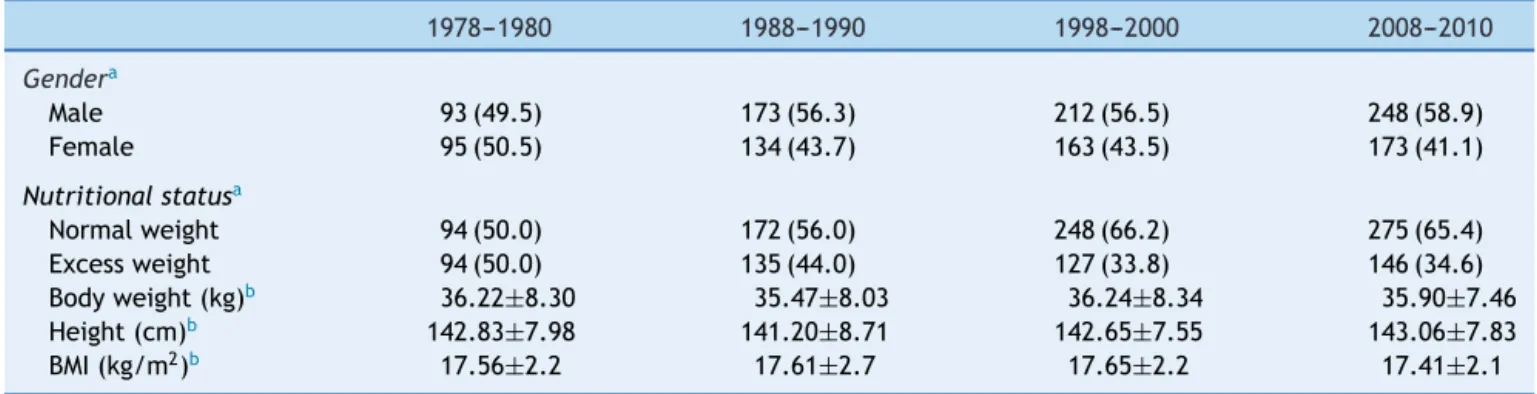
Table1 DescriptiveanalysisofanthropometricvariablesofschoolchildrenfromIlhabelaovera30-yearperiod.
1978---1980 1988---1990 1998---2000 2008---2010
Gendera
Male 93(49.5) 173(56.3) 212(56.5) 248(58.9)
Female 95(50.5) 134(43.7) 163(43.5) 173(41.1)
Nutritionalstatusa
Normalweight 94(50.0) 172(56.0) 248(66.2) 275(65.4)
Excessweight 94(50.0) 135(44.0) 127(33.8) 146(34.6)
Bodyweight(kg)b 36.22±8.30 35.47±8.03 36.24±8.34 35.90±7.46
Height(cm)b 142.83±7.98 141.20±8.71 142.65±7.55 143.06±7.83
BMI(kg/m2)b 17.56±2.2 17.61±2.7 17.65±2.2 17.41±2.1
BMI,bodymassindex.
19.4% overweight. The number of female schoolchildren withnormalweightwashigheronlyinthe 20and30-year evaluations.10 Table1shows the characterization(gender, nutritionalstatusandanthropometry)ofthesample accord-ingtothefourevaluationperiods.
In boyswithnormal weight,meanupper-limb strength valuesdecreasedsignificantlyafter30years.Asforagility, theaveragemeanswhencomparingthe2008---2010andthe 1978---1980periodsincreased.Therewerenosignificant dif-ferencesbetweentheperiodsregardinglower-limbstrength and velocity (Table 2). In overweight boys, upper-limb strengthshowedastatisticallyhighermeanin1978---1980, whencomparedwith2008---2010.Therewerenosignificant
differences between theevaluation periods of lower-limb strength,agilityandvelocity(Table2).
In normal weight girls, upper-limb strength showed higher means when comparing the 1998---2000 and the 2008---2010 periods. The means of agility times increased whencomparing2008---2010vs.1978---1980.Bothlower-limb strength and velocity did not differ between evaluation periods (Table 2). In overweight girls, only the mean upper-limb strength decreased statistically when compar-ingtheperiods1988---1990vs.2008---2010and1998---2000vs. 2008---2010(Table2).
Regarding upper-limb strength, overweight boys had a better performance than the ones with normal weight in
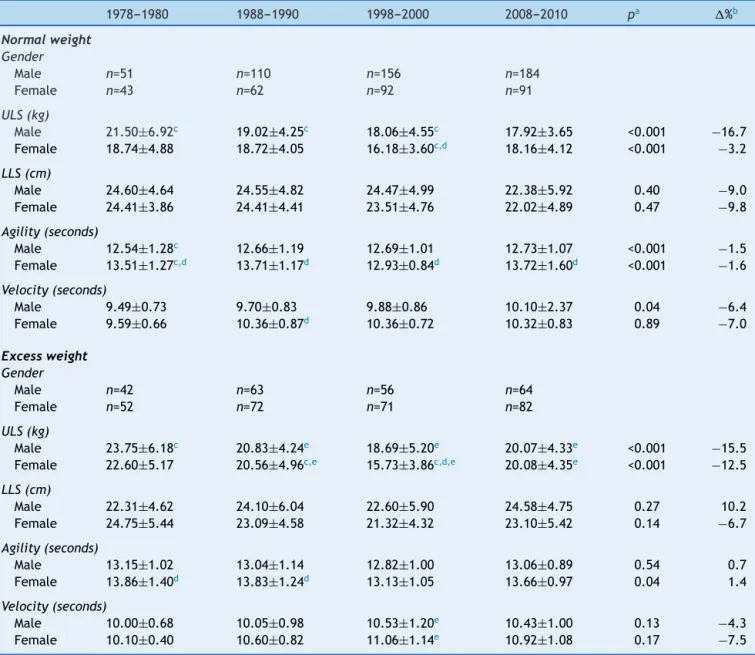
Table2 Comparisonofphysicalfitnessvariablesaccordingtogenderandnutritional statusofschoolchildrenfromIlhabela overa30-yearperiod.
1978---1980 1988---1990 1998---2000 2008---2010 pa %b
Normalweight Gender
Male n=51 n=110 n=156 n=184
Female n=43 n=62 n=92 n=91
ULS(kg)
Male 21.50±6.92c 19.02±4.25c 18.06±4.55c 17.92±3.65 <0.001 −16.7 Female 18.74±4.88 18.72±4.05 16.18±3.60c,d 18.16
±4.12 <0.001 −3.2
LLS(cm)
Male 24.60±4.64 24.55±4.82 24.47±4.99 22.38±5.92 0.40 −9.0
Female 24.41±3.86 24.41±4.41 23.51±4.76 22.02±4.89 0.47 −9.8
Agility(seconds)
Male 12.54±1.28c 12.66±1.19 12.69±1.01 12.73±1.07 <0.001 −1.5
Female 13.51±1.27c,d 13.71±1.17d 12.93±0.84d 13.72±1.60d <0.001 −1.6
Velocity(seconds)
Male 9.49±0.73 9.70±0.83 9.88±0.86 10.10±2.37 0.04 −6.4
Female 9.59±0.66 10.36±0.87d 10.36±0.72 10.32±0.83 0.89 −7.0
Excessweight Gender
Male n=42 n=63 n=56 n=64
Female n=52 n=72 n=71 n=82
ULS(kg)
Male 23.75±6.18c 20.83±4.24e 18.69±5.20e 20.07±4.33e <0.001 −15.5 Female 22.60±5.17 20.56±4.96c,e 15.73±3.86c,d,e 20.08±4.35e <0.001 −12.5
LLS(cm)
Male 22.31±4.62 24.10±6.04 22.60±5.90 24.58±4.75 0.27 10.2
Female 24.75±5.44 23.09±4.58 21.32±4.32 23.10±5.42 0.14 −6.7
Agility(seconds)
Male 13.15±1.02 13.04±1.14 12.82±1.00 13.06±0.89 0.54 0.7
Female 13.86±1.40d 13.83±1.24d 13.13±1.05 13.66±0.97 0.04 1.4
Velocity(seconds)
Male 10.00±0.68 10.05±0.98 10.53±1.20e 10.43±1.00 0.13 −4.3
Female 10.10±0.40 10.60±0.82 11.06±1.14e 10.92±1.08 0.17 −7.5
ULS,upper-limbstrength;LLS,lower-limbstrength;datadescribedasmean±standarddeviation.
aANOVAwiththreefactors(gender,nutritionalstatusanddecade). b
%(deltapercentile):variationbetweenthebaselineand30years.
c p<0.01:forcomparisonbetweenbaseline,10,20,and30years. d p<0.01:forcomparisonbetweenboysandgirls.
theperiods 1988---1990, 1998---2000 and2008---2010. As for velocity,boyswithnormalweighthadasignificantlybetter performance thanoverweight ones only in the1998---2000 periods. Normal-weight and overweight boys had similar resultsregardinglower-limbstrengthandagilityinall ana-lyzedperiods(Table2).
Overweight girls had a better performance regarding upper-limbstrength,whencomparedtonormalweightones, inthe1988---1990,1998---2000and2008---2010periods.Asfor velocity,normalweightgirlshadasignificantlybetter per-formancethanoverweightonesonlyinthe1998---2000period (Table2).
In terms ofcomparisonbetween thegenders regarding upper-limb strength, normal weight and overweight girls performed worse than normal-weight and overweight boys only in the period of 1998---2000. Regarding agility,
normal-weight girls performed worse than normal-weight boysinallevaluatedperiods.When overweightgirlswere comparedtooverweightboys,thedifferencebetweenthe meansoccurredonlyinthe1978---1980 andthe1988---1990 periods. Regarding the lower-limb strength and velocity means,therewasnostatisticaldifferencebetweenthe gen-ders(Table2).
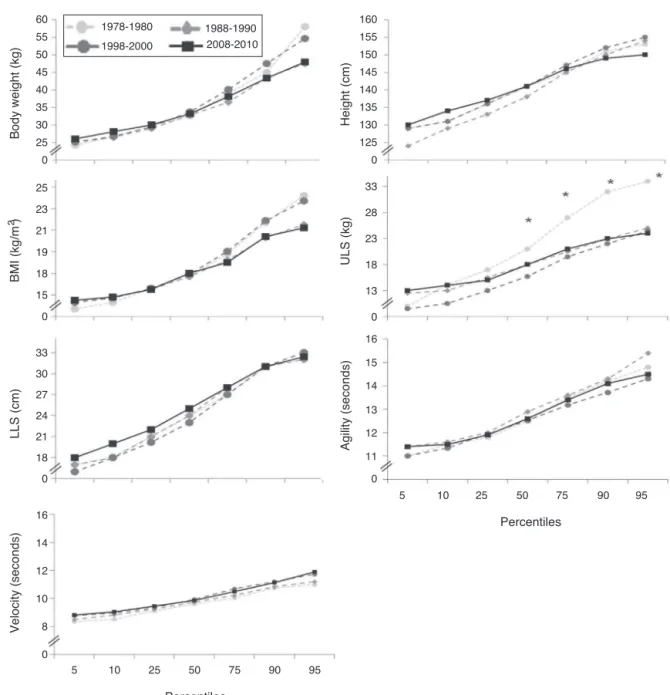
Regardlessofthenutritionalstatus,Figs.1(males)and2 (females) illustrate the percentile values for each physi-calfitnessvariable andtheir respectivechanges over the years.Inmales,themeanvaluesofthepercentiles(50,75, 90 and95) of upper-limb strength decreased significantly whencomparing1978---1980with1988---1990,1998---2000and 2008---2010(Fig.1).Infemales,therewerenosignificant dif-ferencesinpercentilesbetweentheassessmentperiodsfor allanalyzedvariables(Fig.2).
60 160
155
150
145
140
135
130
125
0 1978-1980
1998-2000 2008-2010 1988-1990 55
50
45
40
Body weight (kg)
Height (cm)
35
30
25
0
25 33
28
23
18
13
0
0
5 10 25 50 75 90 95
11 12 13 14 15 16 23
21
19
18
BMI (kg/m
)
2
ULS (kg)
15
0
33
30
27
24
21
LLS (cm)
18
0
16
14
12
10
8
Velocity (seconds)
Agility (seconds)
Percentiles
0
5 10 25 50 75
Percentiles
95 90
60
160 155
150 145
140 135
130 125
0 1978-1980
2008-2010 1998-2000
1988-1990 55
50
45
40
Body weight (kg)
Height (cm)
35
30
25
0
25 30
25
20
15
10
0
0
5 10 25 50 75 90 95
10
8 12 14 16 18 23
21
19
17
BMI (kg/m
)
2
ULS (kg)
15
0
33
30
27
24
21
LLS (cm)
18
0
16
14
12
10
8
Velocity (seconds)
Agility (seconds)
Percentis
0
5 10 25 50 75
Percentiles
95 90
Figure2 Percentilevaluesforeachphysicalfitnessvariableregardlessofnutritionalstatusovera30-year-periodinfemales. ULS,upper-limbstrength;LLS,lower-limbstrength.
Discussion
In normal children of both genders, there was a signifi-cantdecreaseinthemeanupper-limbstrengthandagility time. In overweight children of both genders, there was asignificant decreaseonly inupper-limb strengthover 30 years. These results seem to indicate that physical fit-nessindicatorsofschoolchildrenfromIlhabelaworsenedin recentyears,althoughtherewasnoevidenceofanincrease in childhood obesity in this specific population over the years,unlikethenutritionalchange, frommalnutrition to overweight,whichhasaffectedtheBrazilianpopulationin the same periodduring which ourdata were collected.17 Although Ilhabela has shown remarkable economic devel-opmentinrecent decades,withan increase inpopulation and urbanization rates, it is important to note that the
nutritionalstatusremainedunchangedamongthechildren studiedinthisagegroup.Therefore,itseemsprobablethat theschoolchildrenobservedinthisstudydidnotfollowthe nutritiontransitionprofileofBrazilianschoolchildreninthe samestudiedperiod.TheHouseholdBudgetSurvey17showed amorethanthree-foldincrease,from9.8%to33.4%,inthe proportionofBrazilianchildrenwithexcessweightbetween 1975and2009.
et al.20 analyzed schoolchildren in the United States and observed worse physical fitness results in obese children thaninthenormalweightonesinrunningtests.Inboth gen-ders,ourresultsdidnotfindchangesinlower-limbstrength andagility,when comparingnormal-weightschoolchildren withoverweightones.Forinstance,Dollmanetal.18found an increasein the50-meter runningtimeof 0.1---0.2% per yearfor12years.Ourresultsfoundareductioninvelocity of0.24%and0.20%peryearinnormalweightandoverweight schoolchildren,respectively.
Changes in physical fitness over the years have been attributedlargelytochangesinphysicalactivity.21 Astudy carriedoutbyArteroetal.22indicatedthatoverweight chil-drencanperformphysicalfitnesstestsaswellorevenbetter thanthosewithnormalweight,andinthisstudythistrend wasfoundintheupper-limbstrengthtest,especiallyamong boys.
Other results showed that schoolchildren with better physicalfitnessarelesslikelytobeoverweightthanthose withpoorerphysicalfitnessperformance.13,23 Forinstance, Shangetal.23disclosedthatoverweightchildrenhadaworse physical fitness performance when compared to normal-weight ones. These results are comparable tothose of a cross-sectionalstudycarriedoutwithadolescentsfromthe Republic of Seychelles by Bovet et al.,13 which reported an inverse association between physical fitness and body weight.
Overweight schoolchildren are more sedentary and perform less moderate-to-vigorous physical activity than normal-weight ones.24 A systematic review established a highcorrelationbetweenlackofphysicalactivityand unfa-vorablebodycompositionandlow physicalfitness.All232 reviewedstudiesassociateda sedentarylifestylewithrisk factorsforCVDandincreasedhealthrisks.25
According to the model established by Tomkinson and Olds,5 factorsassociated withsecular changesarecaused by a set of social, behavioral, physical, psychosocial and physiological factors. These patternscan beexplainedby highercalorieintakeratesandreducedenergyconsumption, associatedwithbetteraccesstotechnology.
Analyzing thedataaccordingtothepercentile,decade afterdecade,therewereconsiderablevariationsand reduc-tionsinphysicalfitnessvalues,especiallyintheupper-limb strengthofschoolchildren.Forinstance,observingthe95th percentile for the male gender, upper-limb strength was 33kgin 1978---1980and 24kg30yearslater. Suchchanges havealsobeenreportedinanotherstudy.26
Regarding gender, the data show that the girls had a worseperformancethanboys.Researchcarriedoutoverthe yearsin developed countries(Spain andThe Netherlands) showedresultssimilartothosefoundhere regardingboth physicalfitnessandactivity.27,28
Bodycomposition,physical fitnessandphysicalactivity levels arestrongly associated with cardiovascular disease and mortality.25,29 Therefore, the identification of risk groupsiscrucialforthedevelopmentofintervention strate-gies.Changesinlifestyleandtheregularpracticeofphysical activitythroughparentalinitiativesandsocialsupport inter-ventionsareimportantstrategiestofightagainstchildhood obesity and physical inactivity.30 However,other prospec-tivestudiesareneededtodeterminethecause-and-effect relation between physical activity, physical fitness and
bodyweight,assomeauthorsfoundaninverseassociation betweenbodyweightandphysicalfitness.13
The cross-sectional analyses of thisstudy donot allow ustoestablish acause-and-effect association.The conve-niencesamplemayhaveselectedchildrenwhoweremore interestedinperformingthephysicalfitnesstests,limiting thegeneralizationofresults.Nevertheless,theselimitations donotconcealatrendofdecreasedphysicalfitnessvariables thataffectschoolchildrenindevelopingcountries,andthe resultsmayapplytoBrazilianchildrenwiththesame char-acteristics.However,theymustbeinterpretedwithcaution, eveniftheinternationalliteraturefounddecreasedphysical fitnessvariablesover theyearsinrepresentativesamples, afactthatdiffersfromthecurrentstudy.18,21Ontheother hand,thisisthefirstBrazilianstudytoshowthebehaviorof neuromotorvariablesaccordingtothenutritionalstatusof schoolchildrenovera30-yearperiod.
The present study showed that the physical fitness of schoolchildrenagedbetween10and11years,ofboth gen-ders,showedasignificantreductionovera30-yearperiod. Thedeclinein physicalfitnesspatternswashigherin nor-malweightchildren(upper-limbstrengthandagility)than in overweight ones. This study emphasizes the complex-ityofphysical fitnesspatternsofschoolchildren andtheir developmentovertime,asthenutritionalstatusmayhave a distinct impact on this outcome over the years. Other research strategies should be explored to better explain physical fitness and itsassociation withnutritional status inchildrenovertheyears.
Funding
Fundac¸ão de Amparo à Pesquisa do Estado de São Paulo (FAPESP---2010/20749-8),Coordenac¸ãodeAperfeic¸oamento dePessoaldeNívelSuperior(CAPES)andConselhoNacional de Desenvolvimento Científico e Tecnológico (CNPq ---47.807/2011-8).
Conflicts
of
interest
Theauthorsdeclarenoconflictsofinterest.
Acknowledgments
The authors would like to thank Fundac¸ão de Amparo à Pesquisa do Estado de São Paulo (FAPESP---2010/20749-8), Coordenac¸ãodeAperfeic¸oamentodePessoaldeNível Supe-rior (CAPES) and Conselho Nacional de Desenvolvimento CientíficoeTecnológico(CNPq---47.807/2011-8);also,the participants,parentsandguardians;theteachers,principal andadministrative staff of EscolaMunicipal José Antônio Verzegnassi and Escola Municipal Eva Esperanc¸a; and the PrefectureoftheMunicipalityofIlhabela.
References
1.InstituteofMedicine(IOM).Fitnessmeasuresandhealth out-comesinyouth.Washington:InstituteofMedicine(IOM);2012.
3.World Health Organization. Global status report on non-communicable diseases 2014: attaining the nine global noncommunicable diseases targets; a shared responsibility. Geneva:WHO;2015.
4.CohenDD,VossC,TaylorMJ,DelextratA,OgunleyeAA, Sander-cockGR.Ten-yearsecularchangesinmuscularfitnessinEnglish children.ActaPaediatr.2011;100:175---7.
5.TomkinsonGR, OldsTS.Secular changesinpediatricaerobic fitness test performance: theglobal picture.Med Sport Sci. 2007;50:46---66.
6.Ervin RB, FryarCD, Wang CY, Miller IM, OgdenCL. Strenght and body weightin US childrenand adolescents.Pediatrics. 2014;134:782---9.
7.Gonc¸alvesR,SzmuchrowskiLA,DamascenoVO,deMedeirosML, CoutoBP,LamounierJA.Associationofbodymassindexand aer-obicphysicalfitnesswithcardiovascularriskfactorsinchildren. RevPaulPediatr.2014;32:208---14.
8.Dencker M, Thorsson O, Karlsson MK, Lindén C, Wollmer P, AndersenLB.Aerobicfitnessrelatedtocardiovascularrisk fac-torsinyoungchildren.EurJPediatr.2012;171:705---10.
9.TomkinsonGR.Globalchangesinanaerobicfitnesstest perfor-manceofchildrenandadolescents(1958---2003).ScandJMed SciSports.2007;17:497---507.
10.FerrariGLM,BraccoMM,MatsudoVR,FisbergM. Cardiorespira-toryfitnessandnutritionalstatusofschoolchildren:evolution of30years.JPediatr(RioJ).2013;89:366---73.
11.Ferrari TK, Ferrari GL, Silva Júnior JP, Silva LJ, Oliveira L, MatsudoVK.Modificationsofadiposity inschool-agechildren accordingtonutritionalstatus:a20-yearanalysis.JPediatr(Rio J).2012;88:239---45.
12.FerrariGL,BraccoMM,MatsudoVR,FisbergM.Changesin adi-positylevelsinschoolchildrenaccordingtonutritionalstatus: analysisovera30-yearperiod.RevBrasCineantropom Desem-penhoHum.2013;15:405---16.
13.Bovet P, Auguste R, Burdette H. Strong inverse association between physical fitness and overweight in adolescents: a largeschool-basedsurvey.IntJBehavNutrPhysAct.2007;4: 24.
14.MakK,HoA,LoW,ThomasGN,McNausAM,DayLTJr.Health relatedphysicalfitnessandweightstatusinHongKong adoles-cents.BMCPublicHealth.2010;10:1---5.
15.deOnisM,OnyangoAW,BorghiE,SiyamA,NishidaC,Siekmann J.DevelopmentofaWHOgrowthreferenceforschool-aged chil-drenandadolescents.BullWorldHealthOrgan.2007;85:660.
16.NorusisMJ.SPSSforwindows:advancedstatistics,release6.0. Chicago,IL:SPSSInc.;1993.
17.Pesquisa de Orc¸amentos Familiares, 2008---2009. Antropome-triaeestado nutricionalde crianc¸as,adolescenteseadultos
noBrasil. Riode Janeiro:Instituto Brasileiro de Geografiae Estatística;2010.
18.DollmanJ, OldsT, Norton K, Stuart D.The evolutionof fit-nessand fatness in10-11-year-old Australianschoolchildren: changes in distributional characteristics between 1985 and 1997.PedExercSci.1999;11:108---21.
19.Monyeki MA, Koppes LL, Monyeki KD, Kemper HC, Twisk JW. Longitudinal relationships between nutritional status, body composition, and physical fitness in rural children of SouthAfrica: theellisraslongitudinalstudy.AmJ HumBiol. 2007;19:551---8.
20.KimJ,MustA, Fitzmaurice GM,et al.Relationship of physi-calfitness toprevalenceand incidenceofoverweightamong schoolchildren.ObesRes.2005;13:1246---54.
21.TremblayMS,ShieldsM,LavioletteM,CraigCL,JanssenI, Gor-berSC.FitnessofCanadian childrenand youth: resultsfrom the2007---2009CanadianHealthMeasuresSurvey.HealthRep. 2010;21:7---20.
22.ArteroEG,Espana-RomeroV,OrtegaFB,etal.Health-related fitnessinadolescents:underweight,andnotonlyoverweight,as aninfluencingfactorTheAVENAstudy.ScandJMedSciSports. 2010;20:418---27.
23.ShangX, LiuA, Li Y, etal. Theassociation ofweight status withphysicalfitnessamongChinesechildren.IndianJPediatr. 2010:1---6.
24.HermanKM,SabistonCM,MathieuME,TremblayA,ParadisG. Sedentarybehaviorinacohortof8-to10-year-oldchildrenat elevatedriskofobesity.PrevMed.2014;60:115---20.
25.TremblayMS,LeBlanc AG,KhoME, et al.Systematic review ofsedentary behaviourand health indicatorsin schoolaged children.IntJBehavNutandPhysAct.2011;8:1---22.
26.AlbonHM,HamlinMJ,RossJJ.Seculartrendsanddistributional changesinhealthandfitnessperformancevariablesof 10-14-year-oldchildreninNewZealandbetween1991and2003.BrJ SportsMed.2010;44:263---9.
27.RunhaarJ,CollardDC,SinghAS,KemperHC,VanMechelenW, ChinapawM.MotorfitnessinDutchyouth:differencesover a 26-yearperiod(1980---2006).JSciMedSport.2010;13:323---8.
28.UrdialesDM,RuizJR,OrtegaFB,etal.Seculartrendsin health-relatedphysicalfitnessinSpanishadolescents:theAVENAand HELENAstudies.JSciMedSport.2010;13:584---8.
29.TimpkaS,PeterssonIF,ZhouC,EnglundM.Musclestrengthin adolescentmenandriskofcardiovasculardiseaseeventsand mortalityinmiddleage.BMCMed.2014;12:62.