COMPARATIVE STUDY OF ACOUSTIC IMMITTANCE
IN SMOKERS AND NON-SMOKERS
Estudo comparativo das medidas de imitância acústicas
em tabagistas e não tabagistas
Maria Cecília Carvalho Mourão(1), Heidi Elisabeth Baeck(2)
exclusivity. About 20 % of adults in the United States
are smokers3. A global estimate points out that
100,000 youngsters start smoking every day4.
The ambition to reduce igures of such propor
-tions has been motivating groups of researchers who have smoking as their object of study. While it may be a global trend to do research in the line of “factors associated with the rates of interruption of the smoking habit”1,5,6 and the effect of public policies
on tobacco control 1,7,8, base research focusing on
the knowledge of associations between smoking and its users’ health impairments remains relevant and current.
Various diseases and chronic conditions are systematically associated with smoking and the dysfunctions of the auditory system are part of these
diseases9,10. Based on the indings that over 4.720
toxic components are blended to tobacco nicotine, the ototoxic power of cigarettes has supported the hypothesis of the correlation between smoking and
INTRODUCTION
In the past, advertising campaigns associated the habit of smoking with entertainment or status symbols, inducing a considerable number of people to the consumption of cigarettes, without due concern for their personal health. The reverse path has been taken for at least two decades, with government strategies that divulge the harm caused by smoking explicitly and broadly, within a global scope. Efforts towards provoking relective thinking and the adoption of a preventive approach has
resulted in more awareness in new generations,
which still does not prevent that the smoking habit be considered one of the biggest challenges in public health, just like diabetes and arterial hypertension.
Brazil is a successful case in the ight against smoking, revealing a 50% drop in the rate of smoking in the past twenty years1. However, in the
country, there are 25 million smokers starting at the
ABSTRACT
Purpose: to conduct a comparative study of the acoustic impedance measurements in smokers
and nonsmokers, in order to identify the occurrence of speciic behavior in the smoking population.
Methods: in a sample of 80 individuals, namely 40 smokers and 40 nonsmokers, we obtained
the outer acoustic meatus volume, the admittance, the peak pressure and the gradient. Results:
the results showed that the peak pressure presented a signiicant difference between the groups, revealing itself more negative in the group of smokers, both for the right ear (p=0.004) and for the left
ear (p=0.011). Conclusion: This study concludes that the peak pressure of the tympanogram is an
immittance measure able to differentiate smokers and nonsmokers, where smokers show signiicantly more negative pressures.
After following ethical procedures, partici
-pants underwent previous procedures: interview, otoscopy, pure tone threshold audiometry and speech audiometry. Exclusion criteria were applied to obtain a sample exempt from auditory impairment of other types.
Interview: An interview was conducted individ
-ually by a speech pathologist. It is a structured interview aiming to collect registration data and data on smoking and history of alterations in acute or chronic ear and respiratory system. Participants who answered yes to any item of the interview which referred to previous problems of middle ear diseases were excluded.
Otoscopy: The exam was done at the
Otorhinolaryngology, in order to check the integrity of the anatomical structures of the external and middle ear. In case of excessive earwax, a removal was performed and the participant was kept in the research. Participants with medical record showing alterations were excluded.
Pure tone threshold audiometry: This test was
performed by the speech pathologist, in a sound
-proof booth SIMBELMED AC75D audiometer and TDH - 50 phones. Pure tone air-conduction thresholds were assessed at frequencies 250, 500, 1000, 2000, 3000 and 4000 kHz. Participants who had one or more thresholds > 25 dB HL were excluded.
Speech Recognition Threshold (SRT): This exam
sought conirmation of air conduction thresholds. Participants who had incompatible SRT were excluded, having been accepted as compatible participants with values equal to with deviation of up to 10 dB HL average tritone (500, 1000 and 2000 Hz).
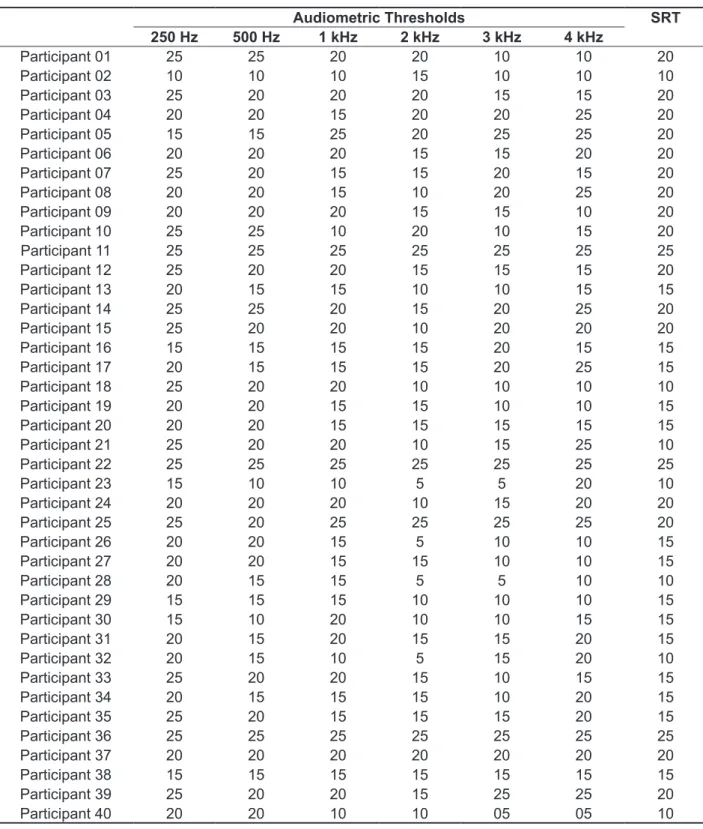
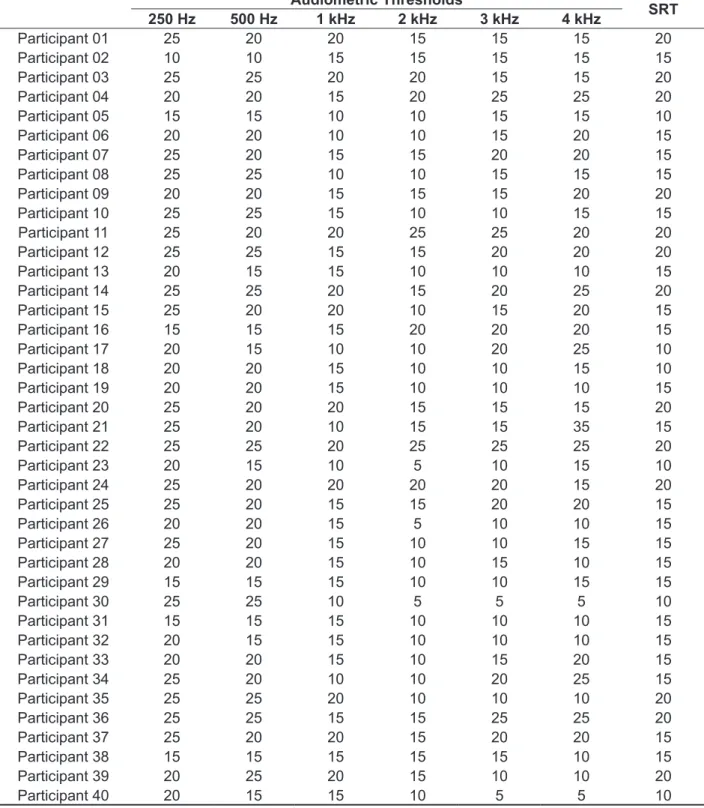
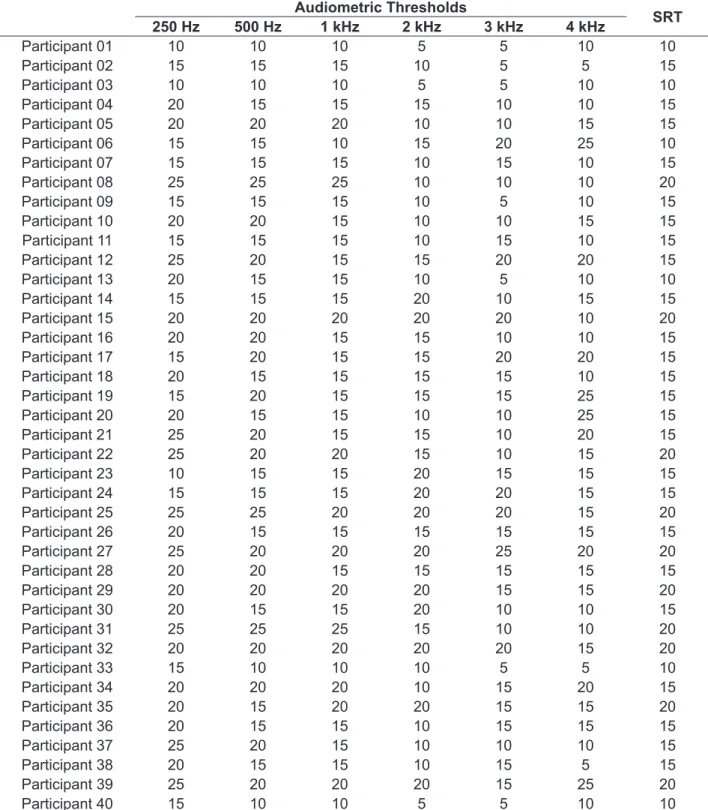
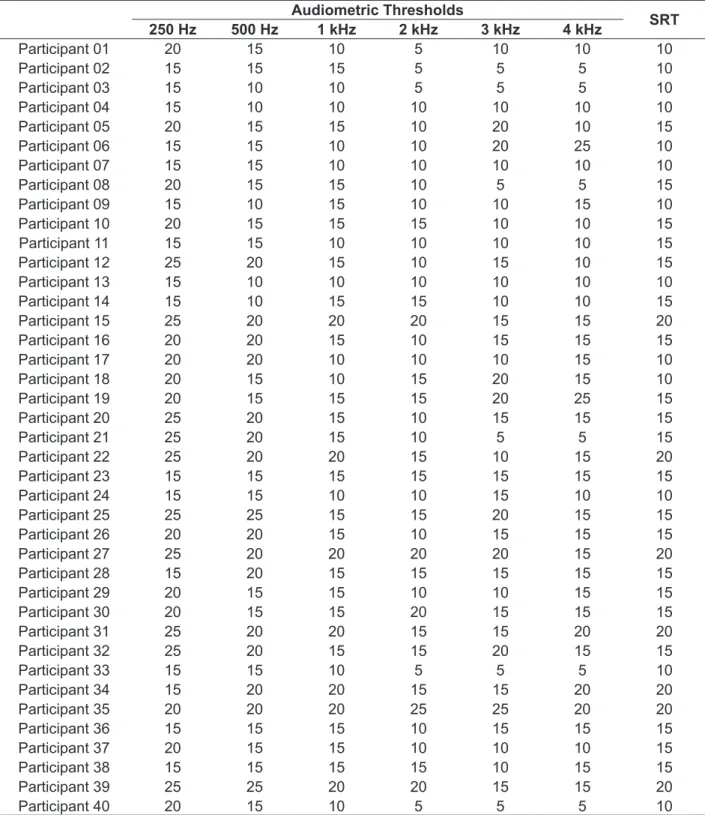
Audiometric data and SRT of participants who were not excluded are described in both the smoking group (Tables 1 and 2) and the non-smoking group (Tables 3 and 4).
in related literature, studies indicate the evidence that nicotine and other toxic substances contained in cigarettes cause histopathological changes in the respiratory lining tract14. Given that the mucosa
lining the middle ear has the same characteristics of the respiratory tract15 , the hypothesized relationship
between smoking and middle ear impairment deserves to be investigated.
It is widely known that in audiology practice, the investigation of the middle ear is accomplished by obtaining the acoustic immittance measurements and, despite the simplicity of this procedure, such measurements are of great importance in the evalu
-ation of hearing disorders16. As the effect of tobacco
in the middle ear is the focus of this paper, the present study conducted a comparative study of the acoustic impedance measurements in smokers and nonsmokers in order to identify the occurrence of a speciic pattern in the smoking population.
METHODS
The current research was conducted in the Department of Audiology, at the University Hospital Antônio Pedro ( HUAP ) afiliated to the Fluminense Federal University (UFF) in Niterói - RJ. The research is a cross-sectional, observational and descriptive exploratory study, approved by the Ethics Committee of the University Veiga de Almeida / Platform Brazil (No.01492312.3000.529).
The sample consisted of 80 participants, being
40 smokers and 40 nonsmokers. Smokers were
Table 1 – Audiometric thresholds and speech recognition in right ear of the smoking group (n=40)
Audiometric Thresholds SRT
250 Hz 500 Hz 1 kHz 2 kHz 3 kHz 4 kHz
Participant 01 25 25 20 20 10 10 20
Participant 02 10 10 10 15 10 10 10
Participant 03 25 20 20 20 15 15 20
Participant 04 20 20 15 20 20 25 20
Participant 05 15 15 25 20 25 25 20
Participant 06 20 20 20 15 15 20 20
Participant 07 25 20 15 15 20 15 20
Participant 08 20 20 15 10 20 25 20
Participant 09 20 20 20 15 15 10 20
Participant 10 25 25 10 20 10 15 20
Participant 11 25 25 25 25 25 25 25
Participant 12 25 20 20 15 15 15 20
Participant 13 20 15 15 10 10 15 15
Participant 14 25 25 20 15 20 25 20
Participant 15 25 20 20 10 20 20 20
Participant 16 15 15 15 15 20 15 15
Participant 17 20 15 15 15 20 25 15
Participant 18 25 20 20 10 10 10 10
Participant 19 20 20 15 15 10 10 15
Participant 20 20 20 15 15 15 15 15
Participant 21 25 20 20 10 15 25 10
Participant 22 25 25 25 25 25 25 25
Participant 23 15 10 10 5 5 20 10
Participant 24 20 20 20 10 15 20 20
Participant 25 25 20 25 25 25 25 20
Participant 26 20 20 15 5 10 10 15
Participant 27 20 20 15 15 10 10 15
Participant 28 20 15 15 5 5 10 10
Participant 29 15 15 15 10 10 10 15
Participant 30 15 10 20 10 10 15 15
Participant 31 20 15 20 15 15 20 15
Participant 32 20 15 10 5 15 20 10
Participant 33 25 20 20 15 10 15 15
Participant 34 20 15 15 15 10 20 15
Participant 35 25 20 15 15 15 20 15
Participant 36 25 25 25 25 25 25 25
Participant 37 20 20 20 20 20 20 20
Participant 38 15 15 15 15 15 15 15
Participant 39 25 20 20 15 25 25 20
Participant 40 20 20 10 10 05 05 10
Table 2 – Audiometric thresholds and speech recognition in left ear of the smoking group (n=40)
Audiometric Thresholds
SRT
250 Hz 500 Hz 1 kHz 2 kHz 3 kHz 4 kHz
Participant 01 25 20 20 15 15 15 20
Participant 02 10 10 15 15 15 15 15
Participant 03 25 25 20 20 15 15 20
Participant 04 20 20 15 20 25 25 20
Participant 05 15 15 10 10 15 15 10
Participant 06 20 20 10 10 15 20 15
Participant 07 25 20 15 15 20 20 15
Participant 08 25 25 10 10 15 15 15
Participant 09 20 20 15 15 15 20 20
Participant 10 25 25 15 10 10 15 15
Participant 11 25 20 20 25 25 20 20
Participant 12 25 25 15 15 20 20 20
Participant 13 20 15 15 10 10 10 15
Participant 14 25 25 20 15 20 25 20
Participant 15 25 20 20 10 15 20 15
Participant 16 15 15 15 20 20 20 15
Participant 17 20 15 10 10 20 25 10
Participant 18 20 20 15 10 10 15 10
Participant 19 20 20 15 10 10 10 15
Participant 20 25 20 20 15 15 15 20
Participant 21 25 20 10 15 15 35 15
Participant 22 25 25 20 25 25 25 20
Participant 23 20 15 10 5 10 15 10
Participant 24 25 20 20 20 20 15 20
Participant 25 25 20 15 15 20 20 15
Participant 26 20 20 15 5 10 10 15
Participant 27 25 20 15 10 10 15 15
Participant 28 20 20 15 10 15 10 15
Participant 29 15 15 15 10 10 15 15
Participant 30 25 25 10 5 5 5 10
Participant 31 15 15 15 10 10 10 15
Participant 32 20 15 15 10 10 10 15
Participant 33 20 20 15 10 15 20 15
Participant 34 25 20 10 10 20 25 15
Participant 35 25 25 20 10 10 10 20
Participant 36 25 25 15 15 25 25 20
Participant 37 25 20 20 15 20 20 15
Participant 38 15 15 15 15 15 10 15
Participant 39 20 25 20 15 10 10 20
Participant 40 20 15 15 10 5 5 10
Table 3 – Audiometric thresholds and speech recognition in right ear of the non-smoking group (n=40)
Audiometric Thresholds
SRT
250 Hz 500 Hz 1 kHz 2 kHz 3 kHz 4 kHz
Participant 01 10 10 10 5 5 10 10
Participant 02 15 15 15 10 5 5 15
Participant 03 10 10 10 5 5 10 10
Participant 04 20 15 15 15 10 10 15
Participant 05 20 20 20 10 10 15 15
Participant 06 15 15 10 15 20 25 10
Participant 07 15 15 15 10 15 10 15
Participant 08 25 25 25 10 10 10 20
Participant 09 15 15 15 10 5 10 15
Participant 10 20 20 15 10 10 15 15
Participant 11 15 15 15 10 15 10 15
Participant 12 25 20 15 15 20 20 15
Participant 13 20 15 15 10 5 10 10
Participant 14 15 15 15 20 10 15 15
Participant 15 20 20 20 20 20 10 20
Participant 16 20 20 15 15 10 10 15
Participant 17 15 20 15 15 20 20 15
Participant 18 20 15 15 15 15 10 15
Participant 19 15 20 15 15 15 25 15
Participant 20 20 15 15 10 10 25 15
Participant 21 25 20 15 15 10 20 15
Participant 22 25 20 20 15 10 15 20
Participant 23 10 15 15 20 15 15 15
Participant 24 15 15 15 20 20 15 15
Participant 25 25 25 20 20 20 15 20
Participant 26 20 15 15 15 15 15 15
Participant 27 25 20 20 20 25 20 20
Participant 28 20 20 15 15 15 15 15
Participant 29 20 20 20 20 15 15 20
Participant 30 20 15 15 20 10 10 15
Participant 31 25 25 25 15 10 10 20
Participant 32 20 20 20 20 20 15 20
Participant 33 15 10 10 10 5 5 10
Participant 34 20 20 20 10 15 20 15
Participant 35 20 15 20 20 15 15 20
Participant 36 20 15 15 10 15 15 15
Participant 37 25 20 15 10 10 10 15
Participant 38 20 15 15 10 15 5 15
Participant 39 25 20 20 20 15 25 20
Participant 40 15 10 10 5 5 10 10
Table 4 – Audiometric thresholds and speech recognition in left ear of the non-smoking group (n=40)
Audiometric Thresholds
SRT
250 Hz 500 Hz 1 kHz 2 kHz 3 kHz 4 kHz
Participant 01 20 15 10 5 10 10 10
Participant 02 15 15 15 5 5 5 10
Participant 03 15 10 10 5 5 5 10
Participant 04 15 10 10 10 10 10 10
Participant 05 20 15 15 10 20 10 15
Participant 06 15 15 10 10 20 25 10
Participant 07 15 15 10 10 10 10 10
Participant 08 20 15 15 10 5 5 15
Participant 09 15 10 15 10 10 15 10
Participant 10 20 15 15 15 10 10 15
Participant 11 15 15 10 10 10 10 15
Participant 12 25 20 15 10 15 10 15
Participant 13 15 10 10 10 10 10 10
Participant 14 15 10 15 15 10 10 15
Participant 15 25 20 20 20 15 15 20
Participant 16 20 20 15 10 15 15 15
Participant 17 20 20 10 10 10 15 10
Participant 18 20 15 10 15 20 15 10
Participant 19 20 15 15 15 20 25 15
Participant 20 25 20 15 10 15 15 15
Participant 21 25 20 15 10 5 5 15
Participant 22 25 20 20 15 10 15 20
Participant 23 15 15 15 15 15 15 15
Participant 24 15 15 10 10 15 10 10
Participant 25 25 25 15 15 20 15 15
Participant 26 20 20 15 10 15 15 15
Participant 27 25 20 20 20 20 15 20
Participant 28 15 20 15 15 15 15 15
Participant 29 20 15 15 10 10 15 15
Participant 30 20 15 15 20 15 15 15
Participant 31 25 20 20 15 15 20 20
Participant 32 25 20 15 15 20 15 15
Participant 33 15 15 10 5 5 5 10
Participant 34 15 20 20 15 15 20 20
Participant 35 20 20 20 25 25 20 20
Participant 36 15 15 15 10 15 15 15
Participant 37 20 15 15 10 10 10 15
Participant 38 15 15 15 15 10 15 15
Participant 39 25 25 20 20 15 15 20
Participant 40 20 15 10 5 5 5 10
RESULTS
The group of smokers had an average age of 45.7 years (± 10.5), with a higher prevalence of females (75 %) than males (25 %). The participants’ length of smoking time averaged 23.7 years (± 10.3), with an average of 20.8 ( ± 7.5) cigarettes / day. The non-smoker group average age was 40 years (± 11.9) and, like the group of smokers, it had a higher prevalence of females (72.5%) than males (27.5%).
Below, there is a the description of the indings related to immittance measurements for smokers (Table 5) and nonsmokers (Table 6). Once the comparison between right and left ears showed a statistically signiicant difference in the ‘equivalent volume’ (Table 7), the comparative analysis between the smoking and non-smoking groups (Table 8) was performed separately for each ear.
Insert Tables 5,6,7 and 8.
The results showed that smokers had a signii
-cantly higher peak pressure than the non-smoking group, both for the right and the left ear. For the other variables investigated, test indicated no statis
-tical differences (Table 8) The research procedures themselves, refer
to obtaining the quantitative acoustic immittance measures: equivalent volume of the external acoustic meatus; static admittance peak; pressure peak of the tympanogram, and tympanometric gradient. (With the aid of immittanciometer AMPLAID A 750 and a 226 Hz probe).
The statistical analysis was conducted in order to describe the sample, compare right and left ears and inally compare the smoking and non-smoking groups.
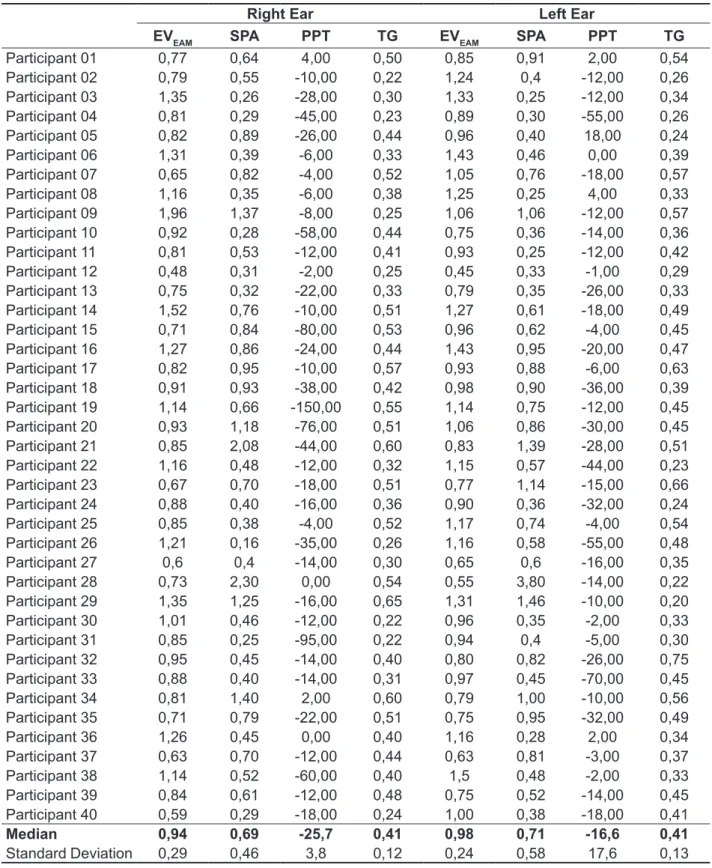
Table 5 – Acoustic Immittance Measurements in the smoking group (n=40)
Right Ear Left Ear
EVEAM SPA PPT TG EVEAM SPA PPT TG
Participant 01 0,77 0,64 4,00 0,50 0,85 0,91 2,00 0,54
Participant 02 0,79 0,55 -10,00 0,22 1,24 0,4 -12,00 0,26
Participant 03 1,35 0,26 -28,00 0,30 1,33 0,25 -12,00 0,34
Participant 04 0,81 0,29 -45,00 0,23 0,89 0,30 -55,00 0,26
Participant 05 0,82 0,89 -26,00 0,44 0,96 0,40 18,00 0,24
Participant 06 1,31 0,39 -6,00 0,33 1,43 0,46 0,00 0,39
Participant 07 0,65 0,82 -4,00 0,52 1,05 0,76 -18,00 0,57
Participant 08 1,16 0,35 -6,00 0,38 1,25 0,25 4,00 0,33
Participant 09 1,96 1,37 -8,00 0,25 1,06 1,06 -12,00 0,57
Participant 10 0,92 0,28 -58,00 0,44 0,75 0,36 -14,00 0,36
Participant 11 0,81 0,53 -12,00 0,41 0,93 0,25 -12,00 0,42
Participant 12 0,48 0,31 -2,00 0,25 0,45 0,33 -1,00 0,29
Participant 13 0,75 0,32 -22,00 0,33 0,79 0,35 -26,00 0,33
Participant 14 1,52 0,76 -10,00 0,51 1,27 0,61 -18,00 0,49
Participant 15 0,71 0,84 -80,00 0,53 0,96 0,62 -4,00 0,45
Participant 16 1,27 0,86 -24,00 0,44 1,43 0,95 -20,00 0,47
Participant 17 0,82 0,95 -10,00 0,57 0,93 0,88 -6,00 0,63
Participant 18 0,91 0,93 -38,00 0,42 0,98 0,90 -36,00 0,39
Participant 19 1,14 0,66 -150,00 0,55 1,14 0,75 -12,00 0,45
Participant 20 0,93 1,18 -76,00 0,51 1,06 0,86 -30,00 0,45
Participant 21 0,85 2,08 -44,00 0,60 0,83 1,39 -28,00 0,51
Participant 22 1,16 0,48 -12,00 0,32 1,15 0,57 -44,00 0,23
Participant 23 0,67 0,70 -18,00 0,51 0,77 1,14 -15,00 0,66
Participant 24 0,88 0,40 -16,00 0,36 0,90 0,36 -32,00 0,24
Participant 25 0,85 0,38 -4,00 0,52 1,17 0,74 -4,00 0,54
Participant 26 1,21 0,16 -35,00 0,26 1,16 0,58 -55,00 0,48
Participant 27 0,6 0,4 -14,00 0,30 0,65 0,6 -16,00 0,35
Participant 28 0,73 2,30 0,00 0,54 0,55 3,80 -14,00 0,22
Participant 29 1,35 1,25 -16,00 0,65 1,31 1,46 -10,00 0,20
Participant 30 1,01 0,46 -12,00 0,22 0,96 0,35 -2,00 0,33
Participant 31 0,85 0,25 -95,00 0,22 0,94 0,4 -5,00 0,30
Participant 32 0,95 0,45 -14,00 0,40 0,80 0,82 -26,00 0,75
Participant 33 0,88 0,40 -14,00 0,31 0,97 0,45 -70,00 0,45
Participant 34 0,81 1,40 2,00 0,60 0,79 1,00 -10,00 0,56
Participant 35 0,71 0,79 -22,00 0,51 0,75 0,95 -32,00 0,49
Participant 36 1,26 0,45 0,00 0,40 1,16 0,28 2,00 0,34
Participant 37 0,63 0,70 -12,00 0,44 0,63 0,81 -3,00 0,37
Participant 38 1,14 0,52 -60,00 0,40 1,5 0,48 -2,00 0,33
Participant 39 0,84 0,61 -12,00 0,48 0,75 0,52 -14,00 0,45
Participant 40 0,59 0,29 -18,00 0,24 1,00 0,38 -18,00 0,41
Median 0,94 0,69 -25,7 0,41 0,98 0,71 -16,6 0,41
Standard Deviation 0,29 0,46 3,8 0,12 0,24 0,58 17,6 0,13
EVEAM: equivalente volume of external acoustic meatus; SPA: static peak admittance;
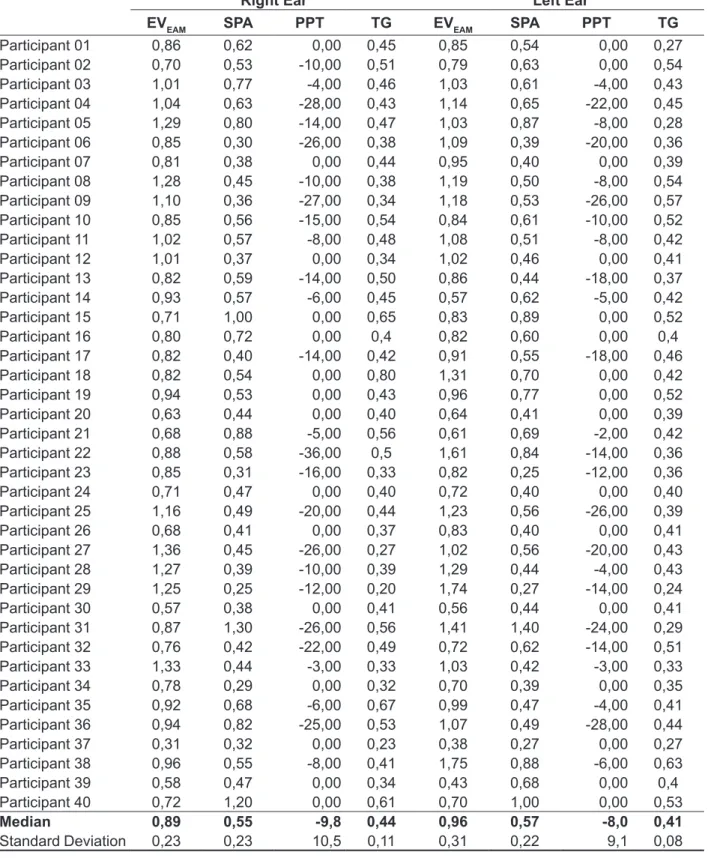
Table 6 – Acoustic Immittance Measurements in the non-smoking group (n=40)
Right Ear Left Ear
EVEAM SPA PPT TG EVEAM SPA PPT TG
Participant 01 0,86 0,62 0,00 0,45 0,85 0,54 0,00 0,27
Participant 02 0,70 0,53 -10,00 0,51 0,79 0,63 0,00 0,54
Participant 03 1,01 0,77 -4,00 0,46 1,03 0,61 -4,00 0,43
Participant 04 1,04 0,63 -28,00 0,43 1,14 0,65 -22,00 0,45
Participant 05 1,29 0,80 -14,00 0,47 1,03 0,87 -8,00 0,28
Participant 06 0,85 0,30 -26,00 0,38 1,09 0,39 -20,00 0,36
Participant 07 0,81 0,38 0,00 0,44 0,95 0,40 0,00 0,39
Participant 08 1,28 0,45 -10,00 0,38 1,19 0,50 -8,00 0,54
Participant 09 1,10 0,36 -27,00 0,34 1,18 0,53 -26,00 0,57
Participant 10 0,85 0,56 -15,00 0,54 0,84 0,61 -10,00 0,52
Participant 11 1,02 0,57 -8,00 0,48 1,08 0,51 -8,00 0,42
Participant 12 1,01 0,37 0,00 0,34 1,02 0,46 0,00 0,41
Participant 13 0,82 0,59 -14,00 0,50 0,86 0,44 -18,00 0,37
Participant 14 0,93 0,57 -6,00 0,45 0,57 0,62 -5,00 0,42
Participant 15 0,71 1,00 0,00 0,65 0,83 0,89 0,00 0,52
Participant 16 0,80 0,72 0,00 0,4 0,82 0,60 0,00 0,4
Participant 17 0,82 0,40 -14,00 0,42 0,91 0,55 -18,00 0,46
Participant 18 0,82 0,54 0,00 0,80 1,31 0,70 0,00 0,42
Participant 19 0,94 0,53 0,00 0,43 0,96 0,77 0,00 0,52
Participant 20 0,63 0,44 0,00 0,40 0,64 0,41 0,00 0,39
Participant 21 0,68 0,88 -5,00 0,56 0,61 0,69 -2,00 0,42
Participant 22 0,88 0,58 -36,00 0,5 1,61 0,84 -14,00 0,36
Participant 23 0,85 0,31 -16,00 0,33 0,82 0,25 -12,00 0,36
Participant 24 0,71 0,47 0,00 0,40 0,72 0,40 0,00 0,40
Participant 25 1,16 0,49 -20,00 0,44 1,23 0,56 -26,00 0,39
Participant 26 0,68 0,41 0,00 0,37 0,83 0,40 0,00 0,41
Participant 27 1,36 0,45 -26,00 0,27 1,02 0,56 -20,00 0,43
Participant 28 1,27 0,39 -10,00 0,39 1,29 0,44 -4,00 0,43
Participant 29 1,25 0,25 -12,00 0,20 1,74 0,27 -14,00 0,24
Participant 30 0,57 0,38 0,00 0,41 0,56 0,44 0,00 0,41
Participant 31 0,87 1,30 -26,00 0,56 1,41 1,40 -24,00 0,29
Participant 32 0,76 0,42 -22,00 0,49 0,72 0,62 -14,00 0,51
Participant 33 1,33 0,44 -3,00 0,33 1,03 0,42 -3,00 0,33
Participant 34 0,78 0,29 0,00 0,32 0,70 0,39 0,00 0,35
Participant 35 0,92 0,68 -6,00 0,67 0,99 0,47 -4,00 0,41
Participant 36 0,94 0,82 -25,00 0,53 1,07 0,49 -28,00 0,44
Participant 37 0,31 0,32 0,00 0,23 0,38 0,27 0,00 0,27
Participant 38 0,96 0,55 -8,00 0,41 1,75 0,88 -6,00 0,63
Participant 39 0,58 0,47 0,00 0,34 0,43 0,68 0,00 0,4
Participant 40 0,72 1,20 0,00 0,61 0,70 1,00 0,00 0,53
Median 0,89 0,55 -9,8 0,44 0,96 0,57 -8,0 0,41
Standard Deviation 0,23 0,23 10,5 0,11 0,31 0,22 9,1 0,08
indicating an interval of 35 years. With regard to the ‘number of cigarettes/day’, a minimum of four and a maximum of 40 cigarettes were obtained, showing a variation of 36 cigarettes per day.
Literature reports that regular smoking for more than a year is already enough to cause hearing
damage11; therefore, all participants in this study
are potentially harmed, having a methodologically appropriate sample. However, it is also mentioned that the toxicity of cigarettes is directly proportional to its consumption10, showing that less expressive
variables in the characteristics of smoking may prove to be interesting in future studies which inves
-tigate the smoking population .
In the current research, there was no concern to subdivide the sample according to age or gender, since the literature that involves patterns of audiology testing indicate that the variation of acoustic immit
-tance measurements are not dependent on the participants’ age variation or gender. A study with 91 participants, which investigated the equivalent volume of the external acoustic meatus, showed absolute values slightly higher for males (2.04 ml to 2.01 ml left ear and right ear) in comparison to females (1.81 ml in the left ear and right ear to 1.79 ml ), but the statistical analysis comparing age groups
DISCUSSION
The convenience sample showed a prevalence of the female gender. This inding does not corrob
-orate national epidemiological research pointing to the smoking population as being predominantly male, in most of the Brazilian territory17. However,
it is in accordance with the predominantly female characterization (73 %) of an on-demand research, in which the investigated population consisted not only of smokers, but also of smokers seeking help to quit smoking18, which is similar to the population
analyzed in the current study. The female predomi
-nance (70 %) in the group of smokers treated at University Hospital Antônio Pedro (HUAP) had already been identiied in a previous study that inves
-tigated the Auditory Evoked Potential in smokers13.
The discrepancy in the characterization of the gender of smokers among the population surveys and on-demand (developed in recovery programs) would suggest that, despite being minor tobacco consumers, women have greater health concerns, which conirms the overall clinical practice at HUAP empirically showing a more frequent presence of
women.
As for the variables directly associated with
Table 7 - p-Value of comparative analysis between right and left ears
Variable p-value
Equivalent Volume (ml) 0,008*
Static Admittance (ml) 0,36
Pressure Peak (daPa) 0,09
Gradient 0,53
* statistical signiicance (p>0,05); Wilcoxonsigned-ranktest
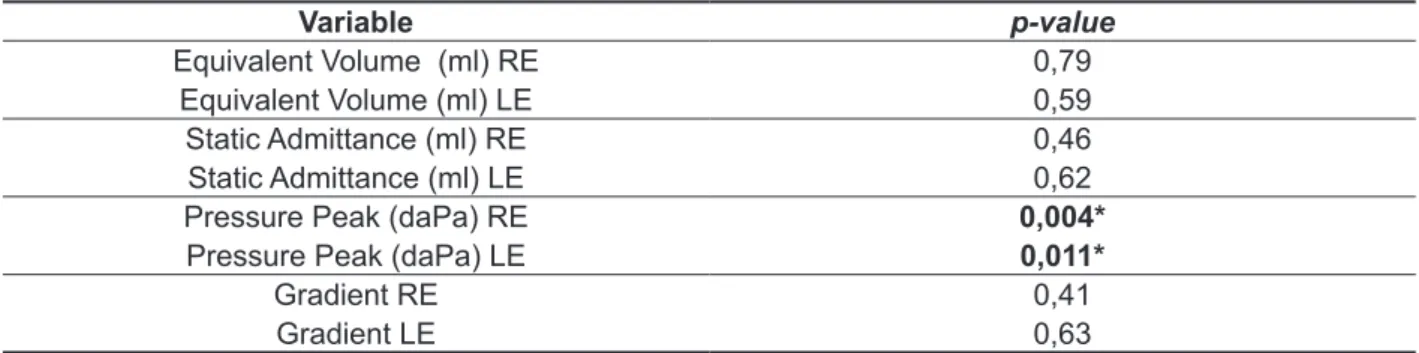
Table 8 - p-Value of comparative analysis between smoking and non-smoking groups
Variable p-value
Equivalent Volume (ml) RE 0,79
Equivalent Volume (ml) LE 0,59
Static Admittance (ml) RE 0,46
Static Admittance (ml) LE 0,62
Pressure Peak (daPa) RE 0,004*
Pressure Peak (daPa) LE 0,011*
Gradient RE 0,41
Gradient LE 0,63
presented in the literature15. Observing both ears in
both groups, the indings showed averages ranging from 0.89 to 0.98 ml for the equivalent volume of the external acoustic meatus, converging the normal pattern described in literature 0.6 to 1.5 ml, between 0.55 and 0.71 ml for peak static admittance converging the normal standard literature from 0.25 to 1.4 ml, between 0.41 and 0.44 for the tympa
-nometric gradient, according to literature which suggests values equal or above 0.2 and inally between -25.7 and -8 daPa for pressure peak, corroborating the literature which considers values within the range -100 to +50 daPa as normal.
It was expected that the indings would agree with the literature, as the sample was composed of individuals with normal audiometric curves. The hypothesis of identifying a behavior of variables speciic to smokers was about possible variations within the pattern of normality.
In the comparative analysis between smokers and nonsmokers, the pressure peak proved to be a variable that provides information. Differences were identiied between the groups investigated both veriied both for the right ear (p = 0.004) and left ear (p = 0.001). It can be observed that in smokers the peak shifts for negative pressure was higher ( -25.7 daPa to the right and -16.6 daPa to the left), in relation to non-smokers ( -9.8 daPa to the right ear and -8.0 daPa to the left). With regards to the altera
-tions in the tympanogram, the type C curve refers to the curve that presents the maximum compliance peak shifted to negative pressure and it is said to be compatible with tubal dysfunction18, therefore, the
highest negative pressure observed in the group of smokers could be attributed to a tubal issue.
In a way, it would be an anticipation to afirm that the tobacco toxin would be responsible for tubal dysfunctions of participants in this study, since the etiology of tubal problems is diverse and not all the possible causes of it could be controlled. Furthermore, it would be considered inappropriate to consider suggestive tubal dysfunction pressures that have moved on average only -25.7 to the right and -16.6 daPa to the left. However, it is intriguing, to say the least, that despite excluding allergic reactions and infections of the upper airways, which reportedly refer to the most common causes of tubal dysfunction, the pressure peak has been shown to be statistically more negative for smokers speciically.
genders male and female did not conirm statistically signiicant differences for any of these two measure
-ments of acoustic immittance19.
In the previous procedures, the exclusion criteria were carefully determined. This study intended to observe the toxic effect of tobacco in the middle ear, and therefore, it somehow needed to neutralize other potentially harmful factors to that structure. If the exclusion criteria were not so strict, it could jeopardize the sample with individuals with conductive otological diseases, imposing a bias to the research. There are at least two developments regarding this issue that deserve comments: the requirement of normal audiometric thresholds and tonal restriction in the audiometry (250-4000 Hz).
Literature indicates that the habit of smoking is a risk factor for hearing. In methodologically diversiied research, otoacoustic emissions20,
evoked otoacoustic potentials12,13 or audiometric
thresholds9,10 smokers showed signiicant worse
results compared to nonsmokers. This is, selecting, only patients with normal audiological evaluation for this study may seem to be a methodological incon
-sistency, at the risk of the population of interest ( smokers with damage of the middle ear as a result of tobacco use) not being represented in the sample . The choice for selection criteria favoring auditory patterns of normality is justiied by the pursuit to control the origin of the middle ear impairment occasionally observed in participants. If , with the requirement of normal thresholds we took the risk of not having the population of interest represented in the sample, the exemption of such criteria might generate a sample contaminated by conductive alterations of sources other than smoking, imposing a bias that we, authors of this study, considered more severe than those imposed by the “less repre
-sentative” sample. In the comparative analysis of immittance measurements between smokers and nonsmokers, the insuficient sample could result in inadequate acceptance of the null hypothesis (not signaling differences when in fact they do exist); however, a contaminated sample could result in improper rejection of the null hypothesis (signaling differences when in fact they do not exist).
on guinea pigs, which showed that tobacco smoke exposure alters the Eustachian tube, contributing to the development of otitis media22,23 corroborate
the indings, as well as research in humans which indicated passive smoking as a predominant risk factor for recurrent otitis in children 24-26.
No signiicant differences were found in the comparative analysis of the other variables inves
-tigated: equivalent volume of external acoustic meatus, static admittance of peak and gradient, indicating that they do not provide information about the habit of smoking.
The results of this research are still seminal; however, the conservative criteria in the sample composition provide relative consistency to the
indings. Future studies with larger samples and with longitudinal follow- up of the pressure peak of the tympanogram may deepen the knowledge about the toxic effect of tobacco on the functioning of the Eustachian tube.
CONCLUSION
Based on the indings, the present study ascertained that, among the acoustic immittance measurements, the pressure peak of the tympa
-nogram is the only parameter able to differentiate smokers from nonsmokers, and for smokers the pressure is shifted to negative.
REFERENCES
1. Levy D, Almeida LM, Szlo A. The Brazil SimSmoke policy simulation model: the effect of strong tobacco control policies on smoking prevalence and smoking-attributable deaths in a middle income nation. PLoS Med. 2012;9(11):e1001-336.
2. Instituto Nacional de Câncer/Ministério da Saúde (Brasil). Brazil global adult tobacco survey report. Rio de Janeiro: Instituto Nacional de Câncer, 2010. 3. Jess D. Lifestyle Choices can affect hearing. Disponível em: <htpp:www.advanceweb.com> Acesso em: 24 mai. 2013.
4. Barreto SB, Giatti L, Casado LM, Moura L, Crespo C, Malta DC. Exposição ao tabagismo
cessation interventions physicians. Intern Med.
2006;45(18):1027-32.
6. Szklo AS, Coutinho ES. The inluence of smokers degree of dependence on the effectiveness of message framing for capturing smokers for a quitline. Addict Beh. 2010;35(6):620-4.
7. Nagelhout GE, Levy DT, Blackman K, Currie L, Clancy L, Willemsen MC. The effect of tobacco control policies on smoking prevalence and smoking-attributable deaths: indings from the Netherlands SimSmoke tobacco control policy simulation model. Addiction. 2012;107(2):407-16.
8. Currie LM, Blackman K, Clancy L, Levy DT. The effect of tobacco control policies on smoking prevalence and smoking-attributable deaths in Ireland using the IrelandSS simulation model. Tob
RESUMO
Objetivo: realizar um estudo comparativo das medidas de imitância acústica em tabagistas e não
tabagistas, visando identiicar a ocorrência de um comportamento especíico na população taba -gista. Métodos: em uma amostra 80 indivíduos, 40 tabagistas e 40 não tabagistas, foram obtidos o
volume do meato acústico externo, a admitância, a pressão de pico e o gradiente. Resultados: os
resultados mostraram que pressão de pico apresentou diferença signiicante entre os grupos, reve
-lando-se mais negativa no grupo dos tabagistas, tanto para a orelha direita (p=0,004) quanto para a
esquerda (p=0,011). Nas demais medidas investigadas não foram veriicadas diferenças estatísticas.
Conclusão: Desta forma, o presente estudo conclui que a pressão do pico do timpanograma é uma
medida imitanciométrica capaz de diferenciar tabagistas e não tabagistas, sendo que nos tabagistas a pressão mostra-se signiicantemente mais negativa.
atendidos em um centro de referência na cessão do tabagismo. Medicina. 2012;45(3):337-42.
19. Bezerra EL, Costa JC, Souza S. Medidas de imitância acústica em idosos. CEFAC.
2003;5(2):157-64.
20. Fronza, AB, Barreto, DCM, Tochetto TM. Associação entre funções da via auditiva eferente e genotoxicidade em adultos jovens. Braz J Otorhinolaryngol. 2011;77(1):107-14.
21. Rodrigues J, Malatesta R. Células ciliadas da mucosa da orelha média: microscopia eletrônica de varredura. Acta Medica Misericordiae.
1998;1(1):26-8.
22. Dubin MG, Pollock HW, Ebert CS, Berg E, Buenting JE, Prazma JP. Eustachian tube dysfunction after tabaco smoke exposure. Otolaryngol Head Neck Surg. 2002;126(1):14-9.
23. Lee IW, Chung BJ, Roh HJ, Lee, CH, Chung BJ, Chon KM. Histologic changes in the Eustachian tube mucosa of rats after short-term exposure to cigarette smoker. Otol Neurotol. 2006;27(3):433-40. 24. Sih TM. Acute otitis media in Brazilian children: analysis of microbiology and antimicrobial susceptibility. Ann Otol Rhinol Laryngol. 2001;110(7 Pt 1):662-6.
25. Saes SO, Goldberg TB, Montovani JC. Secreção na orelha média em lactentes: ocorrência, recorrência e aspectos relacionados. Rev Child Pediat. 2007;78(3):330-1.
26. Gultekin E, Develioğlu ON, Yener M., Ozdemir I, Külekci M. Prevalence and risk factors for persistent otitis media with effusion in primary school children in Istanbul, Turkey. Auris Nasus Larynx. 2010;37(2):145-9.
masculino, tabagistas e não-tabagistas. Braz J Otorhinolaryngol. 2009;75(5):738-44.
10. Paschoal CP, Azevedo MF. O cigarro como fator de risco para alterações auditivas. Braz J Otorhinolaryngol. 2009;75(6):893-902.
11. Fransen E, Topsakal V, Hendrickx JJ, Laer L, Huyghe JR, Eyken E et al. Occupational noise, smoking, and a high body mass index are risk factors for age-related hearing impairment and moderate alcohol consumption is protective: a European population-based multicenter study. J Assoc Res Otolaryngol. 2008;9(3):261-3.
12. Angrisani RMG, Matas CG, Furtado JRB. Análise dos potenciais evocados auditivos em fumantes. ACTA ORL. 2010;26(3):140-208.
13. Martins DMT. Potenciais evocados auditivos do tronco encefálicos em fumantes [dissertação].
Rio de Janeiro (RJ): Uversidade Veiga de Almeida; 2012.
14. Cotran RS, Kumar V, Robbins SL. Patologia Estrutural e Funcional. 5a.ed. Rio de Janeiro:
Guanabara-Koogan, 1994.
15. Carvallo RMM. Timpanometria. In: Bevilacqua MC. Tratado de Audiologia. São Paulo: Santos; 2011. p.123-34.
16. Garcia MV, Azevedo MF, Testa JR. Medidas de imitância acústica em lactentes com 226Hz e 1000Hz: correlação com as emissões otoacústicas e o exame otoscópico. Rev Bras Otorrinolaringol.
2009;75(1):80-9.
17. Instituto Nacional do Câncer (Brasil). Programa Nacional de Controle do Tabagismo e Outros Fatores de Risco de Câncer. Disponível em: <htpp://www. inca.gov.br/tabagismo> Acesso em: 30 mai. 2013. 18. Karen SKK, Oliveira ML, Pádua AI, Vieira F, Martinez JAB. Características clínicas de fumantes