1. GEPEM ENE – Group of Study and Research in M etabolism, Nutrition and Exercise – CEFD/UEL.
2. Group of Studies on Physiological Adaptations to the Training – CEFD UEL.
3. Center of Physical Education and Sports – CEFD – Londrina State Uni-versity – UEL.
4. School of Physical Education, Campinas State University – Unicamp. 5. Department of Physical Education, Brasilia Catholic University. 6. Center of M etabolism in Exercise and Nutrition, FM .UNESP/Botucatu. Received in 3/8/04. Final version received in 25/7/05. Approved in 5/9/05.
Correspondence to: Alexandre Hideki Okano, Unicamp – Campinas State University, School of Physical Education – Department of Sport Science, Av. Érico Veríssimo, 701, Caixa Postal 6134 – 13083-851 – Campinas, SP, Brazil. E-mail: ahokano@fef.unicamp.br
Comparison betw een anaerobic threshold determined by
ventilatory variables and blood lactate response in cyclists
Alexandre Hideki Okano1,2,4, Leandro Ricardo Altimari1,4, Herbert Gustavo Simões5, Antonio Carlos
de M oraes1,4, Fábio Yuzo Nakamura1,2,3, Edilson Serpeloni Cyrino1,2,3 and Roberto Carlos Burini6
O
RIGINALA
RTICLEKeyw ords: Anaerobic threshold. Blood lactate response. Cyclists.
ENGLISH VERSION
ABSTRACT
M any investigations have show n that the coincidence betw een the ventilatory thresholds and those thresholds using the lactate response does not happen all of the time, suggesting that there is no relationship betw een the cause-effect betw een these phenom-ena. Thus, the present study had as main purpose to compare and
correlate the Oxygen consumption (VO2), the pow er (W), and the
heart rate (HR) values attained using protocols to determine the Ventilatory Threshold (VT) and the Individual Anaerobic Threshold (IAT). The sampling w as constituted by eight State and National level cyclists (age: 27.88 ± 8.77 years; body mass: 65.19 ± 4.40 kg; height: 169.31 ± 5,77 cm). The IAT w as determined starting from a three minutes 50 W w arm up w ith progressive increases
of 50 W.3min-1 up to achieving the voluntary exhaustion, w hen the
blood w as collected in the last 20 seconds of each phase, and during the recovering period. In order to determine the VT, it w as used the same protocol used to determine the IAT, but w ithout performing the blood collection. The VT w as identified through the changes in the pulmonary ventilation, as w ell as of the
ventila-tory equivalent of the O2 and CO2. The t-Student test show ed no
significant statistical difference in any of the attained variables. The associations found w ere high and significant. The VO2 (ml.kg
-1.min.-1), P (W), and HR (bpm) corresponding to the VT and IAT, as
w ell as the associations betw een variables w ere respectively: 48.00 ± 3.82 vs. 48.08 ± 3.71 (r = 0.90); 256.25 ± 32.04 vs. 246.88 ± 33.91 (r = 0.84); 173.75 ± 9.18 vs. 171.25 ± 12.02 (r = 0.97). Ac-cording to the results attained, it can be concluded that the IAT
and the VT produce similar VO2, W, and HR values, favoring the
adoption of the VT because it is a non-invasive method to deter-mine the anaerobic threshold in cyclists.
INTRODUCTION
In the last decades, the metabolic thresholds have been the target of several investigations w ithin the exercise physiology, and they are considered extremely relevant parameters, more impor-tant than the maximal oxygen consumption to prescribe the train-ing intensity(1-3), to control the effects of the training(4,5), and to
predict the physical performance(6-8).
The term Anaerobic Threshold (AnT) w as introduced by Wasser-man and M cIlroy(9), and it is defined as the strength intensity
ante-rior to the exponential increase factor of the blood lactate com-pared to the resting levels. Later, it w as verified that there are tw o thresholds, and this has originated the term “ aerobic-anaerobic transition” introduced by Kindermann et al.(2). The first transition
point is identified as Aerobic Threshold (AeT) that reflects the ex-ercise intensity corresponding to the beginning of the blood lac-tate accumulation. The second transition point w ould be called the AnT, and it represents the exercise intensity corresponding to
the maximal steady state of the blood lactate (M SSL)(10). The
au-thors suggest that the fist transition corresponds to the AnT
pro-posed by Wasserman and M cIlroy(9), or the Ventilatory Threshold
(VT1)(11). The second transition point is considered the breathing
compensatory point(9), or the Ventilatory Threshold 2 (VT
2)
(11). These
different terminologies for correlate phenomena have been caused some confusion in the area of the exercise physiology. In order to determine the intensities corresponding to the AeT and the AnT,
Kinderman et al.(2) adopted fixed concentrations of 2 and 4 mmol.1
-1 of the blood lactate, respectively, in an incremental exercise
pro-tocol.
The majority of the researchers use fixed 4 mmol.1-1 blood
lac-tate concentrations to determine the M SSL, and they have
pro-posed several terminologies to identify such phenomenon(2,12-15).
Heck et al.(10) justify the option for that fixed blood lactate
con-centration (4 mmol.1-1) as the majority of individuals presents such
exercise intensity, the maximal ability to remove the produced lac-tate. Nevertheless, in that same study, it w as verified that the M SSL can occur in blood lactate concentrations w ithin a 3.1 and
5.54 mmol.1-1 range.
Similar results have been verified by Stegmann et al.(16), w ho
found different individual values of the blood lactate upon the iden-tification of the M SSL in an incremental test in w hich they varied
betw een 1.4 and 7.5 mmol.1-1. Having in mind the high
inter-indi-vidual variability found in the results, the authors introduced the term Individual Anaerobic Threshold (IAT), w hich is an identifying method for the M SSL that does not respect the fixed lactate con-centration, and it may be employed on running, cycle ergometer, row gonometer, as w ell as for performance assessment, training prescription and control(3,4,17-25).
Several researchers have investigated the relationship betw een the IAT and other protocols aiming to identify the M SSL, but in those studies, the blood lactate response w as determined using the direct method(20,22,23,26). The determination of the blood lactate
response by means of the direct method requires a scheduled blood collection, thus, it is necessary to use non-invasive meth-ods to identify that phenomenon.
Some studies involving non-invasive methods to determine the IAT have been developed. Nevertheless, it w as found no coinci-dence in the exercise intensity attained by the IAT compared to the critic pow er(19) and the deflection point of the heart rate
The non-invasive method that allow s identify the M SSL during the incremental load exercise, involves the VT estimate. Never-theless, the VT and the thresholds coincidence using lactate does not occur all the time, suggesting that there is no cause-effect relationship betw een these phenomena. The findings from stud-ies that have analyzed the relationship betw een the IAT and the VT are quite controversal(11,28,29).
Based on these facts, the purposes of the present study w ere:
to set comparisons betw een the Oxygen consumption (VO2), the
intensity (W), and the heart rate (HR) values during the accom-plishment of the protocols to determine the IAT and the VT in cy-cling athletes, and later, to verify the possible associations be-tw een parameters attained by both methods.
M ETHODS
Subjects
It participated in this study eight male cycling athletes at the state and national levels competing in the Bike Speed (n = 4) and M ountain Bike (n = 4) categories. The general characteristics of the sampling are presented on table 1. As pre-requirements to be admitted in the trial, athletes should have at least tw o years expe-rience in regional or state competitions. After being examined by a physician, every individual received information on the goals of the study and the procedures w hich they w ould be submitted to, and they signed a free clarified consent. The study w as developed at the CeM ENutri (Center of M etabolism in Exercise and Nutri-tion), and it w as approved by the Ethics Committee in Research of the Botucatu School of M edicine/UNESP, SP.
Dietetic control
Aiming to avoid the trial w ould suffer any kind of interference in the test results as to the energetic substrate availability(30,31),
ath-letes had a nutritional follow -up along the w hole study.
From the application of a food questionnaire (recalling 24 hours of their food habits), the nutritionists team elaborated ordinary diet schedules as to the food habits of the assessed individuals. They w ere instructed to follow such diet along the w hole period of the trial. Furthermore, it w as elaborated a standard breakfast to be consumed tw o hours before the test accomplishment. Also, all individuals w ere instructed to avoid the intake of caffeinated prod-ucts 24 hours before the tests, as those substances could
influ-ence the results(32). The information on the quantity and quality of
the consumed foods w as processed by means of the Virtual Nutri version 1.0 nutritional analysis softw are.
Experimental outlining
In the first step of the trial, individuals came to the laboratory to have their m edical exam ination and anthropom etric m easure-ments, in order to characterize the sampling, and to have an inter-view w ith the nutritionists, w hen they received the food intake guidelines to be follow ed along the w hole period of the trial. Fur-thermore, it w as scheduled a timetable for each athlete to come to the laboratory in the next phase of the trial. Later, all individuals performed a pre-trial test w ith the purpose to familiarize them to the equipment and the protocol.
From the second step of the trial on, the individuals came to the laboratory in predefined hours, w hen they w ere submitted to the
test to determine the IAT and the VT2, w hich w ere randomly
per-formed. All the tests (pre-trial, IAT, and VT2) w ere applied w ith a 72 hours interval betw een them. Individuals w ere instructed not to perform their physical activities 24 hours prior to the accomplish-ment of each test, in order to avoid any interference.
Ergospirometry
The incremental tests w ere performed in an electromagnetic
ergonometric cycle (Corival 400, Quinton®, USA). The ventilatory
variables w ere continuously measured in an open circuit
ergo-spiro-metric system (QM CTM 90 M etabolic Cart, Quinton®, Bothell, USA)
using the breath-by-breath technique. At the beginning of each test, the gauging w as performed through a Hans Rudolf 5530
3-liters calibration syringe and a mix of 26% O2 gas w ith a N2 and
4% CO2 and 16% O2 balance (White M artins Praxair, Inc. São
Pau-lo, Brazil).
The analysis w as processed on an IBM computer through the
calculations of the minute ventilation (VE), the VO2, the carbon
dioxide production (VCO2), and the relationship betw een the
car-bon dioxide production and the oxygen consumption (R). The HR w as measured through a cardiofrequencymeter (Van-tage NV, Polar Electro OY, Finland) w ith an every 5 seconds record,
uploading on a softw are (Polar Precision PerformanceTM, Finland)
for later analysis. The HR corresponding to different loads w as determined from the recorded values of the last five seconds of each phase. The variables of the environmental temperature and
the relative air humidity w ere kept betw een 21 and 24oC, and 40
and 60% , respectively.
IAT
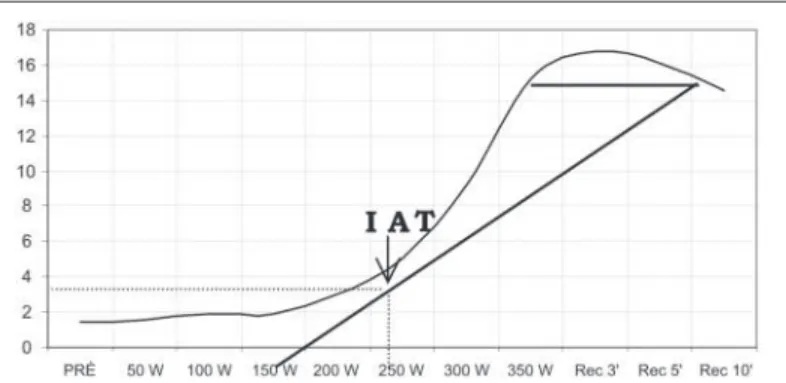
To determine the IAT, initially, the individuals performed a three minute w arm up at a 50 W load, and next, the incremental test started w ith a 50 W increase to the load every three minutes, keeping the 70 revolution per minute cadency. During the incre-mental test, the individuals w ere verbally encouraged to go on up to the voluntary exhaustion. The blood collection w as performed in the ear lobule on a resting condition (pre-strength) in the final 20 seconds of each load up to the exhaustion, and at three, five and ten minutes after the test finished.
From the construction of a graphic representing the blood lac-tate values in each phase of the incremental test and during the passive recovering (figure 1), the IAT w as determined follow ing
the procedures proposed by Stegmann et al.(16).
Fig. 2– Identification of the VT and VT2 according to the VE/VO2 and VE/
VCO2
VT2
The VT w as identified through the application of the same pro-tocol used to determine the IAT, but in this situation, the blood
collection w as not performed. The VT2, or breathing
compensato-ry point, had a double identification through the use of the
ventila-tory equivalent of the Oxygen (VE/VO2), the ventilatory equivalent
of the carbon dioxide (VE/VCO2) considering the sudden increase
in the VE/VCO2 according to the criteria proposed by M cLellan(11).
Figure 2 illustrates the identification of the thresholds; neverthe-less, it w as performed in this study only the VT2.
Biochemical analysis
It w as collected 25 µl of the ear lobule blood through a previ-ously gauged heparinized glass capillary, and they w ere immedi-ately transferred to a 1.5 ml “ Ependorf” type polyethylene micro-tubules containing 50 µl of a 1% sodium fluoride solution. Next,
the samples w ere stored at –70oC. The lactate analysis w as
per-formed using an electroenzimatic analyzer (YSL 2300 STAT Yellow
Spring Co., USA), and the values w ere expressed in mmol.l-1.
Statistical treatment
The results w ere gathered according to the mean values and
standard deviation using the statistical package Statistica 6.0®
(STATSOFT INC., USA). Upon the application of the Shapiro Wilk test, it w as verified that the data distribution w ere normal. Thus, the variables attained in the protocols contrasted from the t-Stu-dent test for depent-Stu-dent sampling. The linear Pearson correlation coefficient w as employed to verify the associations betw een the variables attained in the protocols, in order to determine the IAT
and the VT2. The significance level adopted for every analysis w as
1% .
RESULTS
Table 1 presents the general features of the sampling.
Table 2 presents the values for the VO2max, the intensity at the
moment of the exhaustion (WVO2max), and the FCmax attained
in both protocols used in this study (IAT and VT2). It w as found no
significant differences compared to the above described variables
at the exhaustion moment for the IAT and VT2 tests. On that same
table, it can be observed the blood lactate values at the intensity corresponding to the IAT and the maximal load.
The results of the VO2, W and HR corresponding to the VT2 and
the IAT are presented on table 3. The t-Student test did not
identi-fy significant differences betw een the VO2, W and HR values
at-tained in the VT2 and IAT protocols.
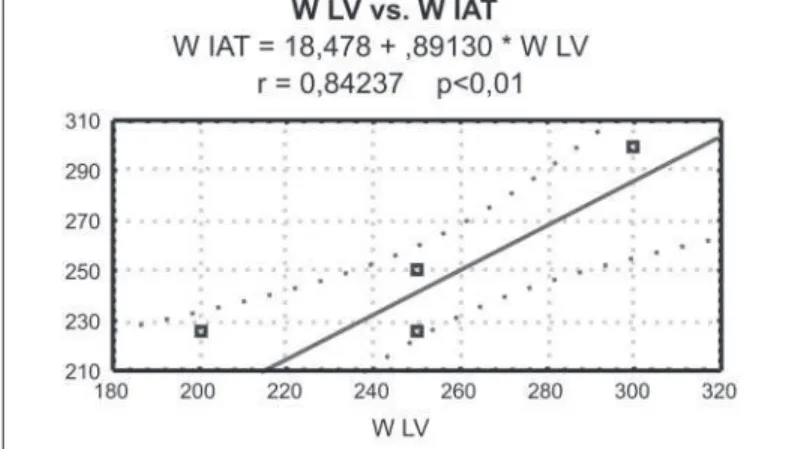
The linear regression betw een the VO2, the HR and W attained
in both methods are presented in figures 3, 4 and 5, respectively. The associations w ere high and significant in every analyzed vari-able.
TABLE 1
General features of the sampling expressed in mean and standard deviation (SD)
Variables M ean SD
Age (years) 027.88 8.97
Body mass (kg) 065.19 4.40
Height (cm) 169.31 5.77
Time of practice (years) 006.17 4.70
Weekly training volume (km) 146.70 34.5 Weekly training frequency (days) 005.00 0,
TABLE 2
M ean and standard deviation of the variables attained at the moment of the exhaustion in protocols to set the individual anaerobic threshold (IAT) and the ventilatory threshold (VT) Variables M ean SD IAT test
VO2max (l.min-1) 003.73 00.29
VO2max (ml.kg-1.min-1) 057.50 04.22
WVO2max (W) 331.25 45.81
HRmax (bpm) 186.00 11.59
BL IAT (mmol.l-1) 003.44 01.23
BLmax (mmol.l-1) 011.56 03.06
VT test
VO2max (l.min-1) 003.78 00.41
VO2max (ml.kg-1.min-1) 058.01 04.66
WVO2max (W) 331.25 45.81
HRmax (bpm) 186.63 10.35
VO2max = maximal Oxygen consumption; WVO2max = intensity corresponding to the maximal Oxygen consumption; HRmax = maximal heart rate; BL IAT = blood lactate corresponding to the individual anaerobic threshold; BLmax = blood lactate corresponding to the maximal load. * Significant difference (p < 0.01).
TABLE 3
M ean and standard deviation of the variables attained in protocols to set the individual anaerobic threshold (IAT) and the ventilatory threshold (VT)
Variables VT IAT
VO2Threshold (ml.kg-1.min-1) 048.00 ± 01.35 048.08 ± 01.31 WVO2max (W) 256.25 ± 11.32 246.88 ± 11.98 HRThreshold (bpm) 173.75 ± 03.20 171.25 ± 04.25
VT = ventilatory threshold; IAT = individual anaerobic threshold; VO2Threshold = Oxygen con-sum pt ion at t he t hresholds; WVO2Threshold = Int ensit y corresponding t o t he t hresholds; HRThreshold = heart rate corresponding to the thresholds.
* Significant difference (p < 0.01).
Fig. 3 – Linear regression betw een the VO2 at the individual anaerobic threshold (IAT) and the ventilatory threshold 2 (VT)
Fig. 4 – Linear regression betw een the heart rate (HR) at the individual
DISCUSSION
The IAT is defined as the higher metabolic rate w here the blood lactate concentration is kept in a balanced state during prolonged exercises, and the elimination of the blood lactate is maximal, be-ing equivalent to the diffusion rate of the muscular compartment to the blood(16). Therefore, it might be considered that the IAT
pro-tocol is capable to determine the intensity corresponding to the M SSL.
In such sense, several studies have found the M SSL during the long endurance rectangular test at the intensity corresponding to the IAT, making such relationship evident(4,20,23,26,33).
Unlike the fixed concentration threshold of 4 mmol.1-1 of the
blood lactate, the IAT protocol considers the behavior of the indi-vidual lactate upon the occurrence of the second aerobic-anaero-bic transition point during a progressive load test. In the present study, the blood lactate concentration corresponding to the IAT
w as a mean of 3.44 mmol.1-1, presenting a 1.9 to 5.04 mmol.1-1
inter-individual variation. These results confirm w hat w as found
by Stegmann et al.(16) and Stegmann and Kindermann(26), w ho found
a 1.4-7.5 and 1.8-6.1 mmol.1-1 variation in the blood lactate,
re-spectively.
Related to the VT2, the literature has pointed out that the
vari-able, as w ell as the IAT can be considered a M SSL indicator(34-36).
Thus, theoretically, the intensities attained in the protocols to
de-termine the IAT and the VT2 should be coincident. The findings of
the present study confirm this hypothesis. Although the VT2’s
in-tensity is 3.8% higher compared to the IAT, that difference w as not statistically significant. Furthermore, the coefficients of the correlation betw een the variables attained by both methods w ere r = 0.84 to r = 0.97. These results suggest that w henever the aim is to classify the individuals as to their aerobic ability, it seems there is no interference from the protocol used.
Several studies have evidenced the close relationship betw een the AnT determined by fixed concentrations of the blood lactate
and by the ventilatory method(35,37-39). How ever, few studies have
analyzed the direct relationship betw een the IAT and the ventilato-ry thresholds(11,28,29).
In a sampling w ith non-trained individuals, M cLellan(11) compared
the VT2, the IAT and the AnT corresponding to 4 mmol.1-1 attained
in the protocols ministered at the cycle ergometer. The criterion adopted to identify the VT w as the change in the response pattern
of the VE/VCO2 response above the VR1. The author verified that
the IAT values w ere statistically low er than those observed in the other methods.
Dickhuth et al.(28), employing incremental tests on the treadmill
have analyzed the relationship betw een the reproducibility of the IAT intensities and the VT determined through the V-Slope
meth-od (VTV-Slope). The authors found a high correlation (r = 0.97; p <
0.01), and the IAT w as 7-8% higher than the VT values.
M cNaughton et al.(29) compared several methods to determine
the AnT, and after that, they submitted the individuals to a contin-uous test up to achieving the voluntary exhaustion at the intensity
attained by each method. The VTV-Slope intensity surpassed in 13%
the values found in the IAT. How ever, these differences w ere not statistically significant. Using the VT intensity, the individuals suc-ceeded in remaining 14 minutes at the submaximal test. When they w orked out at the IAT intensity, the time spent in the test practically doubled, attaining around 28 minutes. These findings indicate it is required a judicious analysis of the meaning of each threshold, mainly w hen the purpose is to prescribe the training.
Added to the fact there is a reduced amount of studies devel-oped aiming to compare the IAT and the ventilatory thresholds, the results are quite conflicting. Possibly, the discrepancy in the findings can be related to the criteria adopted to determine the ventilatory thresholds, the characteristics of the individuals as-sessed, or even to the use of different kinds of exercises and/or protocols (load increment intensity and endurance of the phases). Initially, the criteria adopted to identify the ventilatory thresh-olds w ere the breaking points of the VE related to the VO2. Later, besides the previously mentioned criterion, it w as suggested the use of other variables, such as VE/VO2, VE/VCO2, and R(40,41).
Basi-cally, the aim w as to identify an incremental load protocol w hen
there is an increase in the VE/VO2, and the O2 pressure w ith no
alterations on the VE/VCO2 and on the CO2 pressure. To some
authors, such intensity corresponds to the VT1(11). From this point
on, the increase in the exercise intensity w ill cause a metabolic acidosis, resulting in a decrease in the pH, and consequently an
increase on the VE/VCO2 and on the CO2. That second point is
considered the VT2(11), or the respiratory compensatory point.
Related to the individual’s physical condition, the mechanisms involved in the occurrence of the AnT seem to be the same both in athletes and in non-trained individuals. How ever, the point w here the phenomenon occurs is different among them (Wyatt, 1999).
This can be explained in function of the variation in the diffusion ability and/or removal of the lactate produced betw een different portions(42).
Another important aspect that cannot be disregarded is the pro-tocol adopted to determine the ventilatory thresholds. The opti-mum protocol is the one that allow s the researcher to observe the inflexion point of the EV/VO2 and the region of the isocapneic
tam-ponage (increase in the EV/VO2 w ith no modifications in the EV/
CVO2). Thus, Davis(43) suggests the use of incremental protocols
constituted by one minute endurance phases. In this study, the protocol employed to determine the VT w as similar to that adopt-ed to identify the IAT, that means, three minutes endurance each
phase. According to M cLellan(11), that second threshold seems not
to suffer any influence on the endurance of the phases (1, 3, or 5 minutes).
As it can be seen, there is a great amount of criteria and termi-nologies used to identify the metabolic thresholds. Thus, it is fun-damental to make judicious observation of the protocol adopted to determine the blood lactate response, mainly aiming to pre-scribe the training intensity.
It is important to point out that one of the limitations of this study is related to the reduced sampling. In such sense, Stone et al.(44) recently pointed out that it is required to make a distinction
betw een the concepts of Exercise Science and Sports Science. Generally, the literature has several publications related to the Exercise Science. Nevertheless, there is a scarcity of publications related to the sports itself, that means, the Sport Science, under-stood as the one developed w ith the purpose to propitiate the sportive performance increment through the application of meth-ods and scientific principles to the training assessment, control-ling, and prescription(44).
Fig. 5 – Linear regression betw een intensity (W) of the individual
CONCLUSION
Based on the results found in this study, it can be concluded
that the protocols to determine the IAT and VT give similar VO2,
intensity and HR values, even presenting high correlations betw een these variables, favoring the adoption of the VT as this is a non-invasive method to determine the anaerobic threshold in cyclists.
All the authors declared there is not any potential conflict of inter-ests regarding this article.
REFERENCES
1. Jacobs I. Blood lactate. Implications for training and sports performance. Sports M ed 1986;3:10-25.
2. Kindermann W, Simon G, Keul J. The significance of the aerobic-anaerobic transi-tion for the determinatransi-tion of w ork load intensities during endurance training. Eur J Appl Physiol Occup Physiol 1979;42:25-34.
3. M eyer T, Gabriel HH, Kindermann W. Is determination of exercise intensities as percentages of VO2max or HRmax adequate? M ed Sci Sports Exerc 1999;31: 1342-5.
4. Keith SP, Jacobs I, M cLellan TM . Adaptations to training at the individual anaero-bic threshold. Eur J Appl Physiol Occup Physiol 1992;65:316-23.
5. Gaskill SE, Walker AJ, Serfass RA, Bouchard C, Gagnon J, Rao DC, et al. Chang-es in ventilatory thrChang-eshold w ith exercise training in a sedentary population: the Heritage Family Study. Int J Sports M ed 2001;22:586-92.
6. Coyle EF. Integration of the physiological factors determining endurance perfor-mance ability. Exerc Sport Sci Rev 1995;23:25-63.
7. Coyle EF, Feltner M E, Kautz SA, Hamilton M T, M ontain SJ, Baylor AM , et al. Physiological and biomechanical factors associated w ith elite endurance cycling performance. M ed Sci Sports Exerc 1991;23:93-107.
8. Roecker K, Schotte O, Niess AM , Horstmann T, Dickhuth HH. Predicting compe-tition performance in long-distance running by means of a treadmill test. M ed Sci Sports Exerc 1998;30:1552-7.
9. Wasserman K, M cIlroy M B. Detecting the threshold of anaerobic metabolism in cardiac patients during exercise. Am J Cardiol 1964;14:844-52.
10. Heck H, M ader A, Hess G, M ucke S, M uller R, Hollmann W. Justification of the 4-mmol/l lactate threshold. Int J Sports M ed 1985;6:117-30.
11. M cLellan TM . Ventilatory and plasma lactate response w ith different exercise protocols: a comparison of methods. Int J Sports M ed 1985;6:30-5.
12. M ader A, Liesen H, Heck H, Philippi H, Schürch PM , Hollmann W. Zur beurteilung der sportartspezifischen Ausdauerleinstungsfähigkeit im Labor. Sportarzt Sport-med 1976;26:109-12.
13. M ader A, Liesen H, Heck H, Philippi H, Schürch PM , Hollmann W. Zur beurteilung der sportartspezifischen Ausdauerleinstungsfähigkeit im Labor. Sportarzt Sport-med 1976;24:80-8.
14. Sjodin B, Jacobs I. Onset of blood lactate accumulation and marathon running performance. Int J Sports M ed 1981;2:23-6.
15. Hollmann W. Historical remarks on the development of the aerobic-anaerobic threshold up to 1966. Int J Sports M ed 1985;6:109-16.
16. Stegmann H, Kindermann W, Schnabel A. Lactate kinetics and individual anaero-bic threshold. Int J Sports M ed 1981;2:160-5.
17. Coen B, Schw arz L, Urhausen A, Kindermann W. Control of training in middle-and long-distance running by means of the individual anaerobic threshold. Int J Sports M ed 1991;12:519-24.
18. M cLellan TM , Cheung KS, Jacobs I. Incremental test protocol, recovery mode and the individual anaerobic threshold. Int J Sports M ed 1991;12:190-5.
19. M cLellan TM , Cheung KS. A comparative evaluation of the individual anaerobic threshold and the critical pow er. M ed Sci Sports Exerc 1992;24:543-50.
20. Urhausen A, Coen B, Weiler B, Kindermann W. Individual anaerobic threshold and maximum lactate steady state. Int J Sports M ed 1993;14:134-9.
21. Urhausen A, Weiler B, Coen B, Kindermann W. Plasma catecholamines during endurance exercise of different intensities as related to the individual anaerobic threshold. Eur J Appl Physiol Occup Physiol 1994;69:16-20.
22. Beneke R. Anaerobic threshold, individual anaerobic threshold, and maximal lac-tate steady slac-tate in row ing. M ed Sci Sports Exerc 1995;27:863-7.
23. Bourgois J, Vrijens J. M etabolic and cardiorespiratory responses in young oars-men during prolonged exercise tests on a row ing ergometer at pow er outputs corresponding to tw o concepts of anaerobic threshold. Eur J Appl Physiol Occup Physiol 1998;77:164-9.
24. Baldari C, Guidetti L. A simple method for individual anaerobic threshold as pre-dictor of max lactate steady state. M ed Sci Sports Exerc 2000;32:1798-802.
25. Guidetti L, M usulin A, Baldari C. Physiological factors in middlew eight boxing performance. J Sports M ed Phys Fitness 2002;42:309-14.
26. Stegmann H, Kindermann W. Comparison of prolonged exercise tests at the indi-vidual anaerobic threshold and the fixed anaerobic threshold of 4 mmol.l(-1) lac-tate. Int J Sports M ed 1982;3:105-10.
27. Bourgois J, Vrijens J. The Conconi test: a controversial concept for the determi-nation of the anaerobic threshold in young row ers. Int J Sports M ed 1998;19: 553-9.
28. Dickhuth HH, Yin L, Niess A, Rocker K, M ayer F, Heitkamp HC, et al. Ventilatory, lactate-derived and catecholamine thresholds during incremental treadmill run-ning: relationship and reproducibility. Int J Sports M ed 1999;20:122-7.
29. M cNaughton L, Wakefield G, Fasset R, Bentley D. A comparison of lactate kinet-ics, minute ventilation and acid-base balance as measure of the anaerobic thresh-old. Journal of Human M oviment Studies 2001;41:247-61.
30. Hughes EF, Turner SC, Brooks GA. Effects of glycogen depletion and pedaling speed on “ anaerobic threshold” . J Appl Physiol 1982;52:1598-607.
31. Yoshida T. Effect of dietary modifications on lactate threshold and onset of blood lactate accumulation during incremental exercise. Eur J Appl Physiol Occup Physiol 1984;53:200-5.
32. Berry M J, Stoneman JV, Weyrich AS, Burney B. Dissociation of the ventilatory and lactate thresholds follow ing caffeine ingestion. M ed Sci Sports Exerc 1991; 23:463-9.
33. M cLellan TM , Jacobs I. Active recovery, endurance training, and the calculation of the individual anaerobic threshold. M ed Sci Sports Exerc 1989;21:586-92.
34. Aunola S, Rusko H. Does anaerobic threshold correlate w ith maximal lactate steady-state? J Sports Sci 1992;10:309-23.
35. Ribeiro JP, Hughes V, Fielding RA, Holden W, Evans W, Knuttgen HG. M etabolic and ventilatory responses to steady state exercise relative to lactate thresholds. Eur J Appl Physiol Occup Physiol 1986;55:215-21.
36. Yamamoto Y, M iyashita M , Hughson RL, Tamura S, Shinohara M , M utoh Y. The ventilatory threshold gives maximal lactate steady state. Eur J Appl Physiol Oc-cup Physiol 1991;63:55-9.
37. Wyatt FB. Comparison of lactate and ventilatory threshold to maximal oxygen consumption: a meta analysis. Journal of Strength and Conditioning Research 1999;13:67-71.
38. Ahmaidi S, Hardy JM , Varray A, Collomp K, M ercier J, Prefaut C. Respiratory gas exchange indices used to detect the blood lactate accumulation threshold during an incremental exercise test in young athletes. Eur J Appl Physiol Occup Physiol 1993;66:31-6.
39. Dickstein K, Barvik S, Aarsland T, Snapinn S, Karlsson J. A comparison of meth-odologies in detection of the anaerobic threshold. Circulation 1990;81:II38-46.
40. Davis JA, Frank M H, Whipp BJ, Wasserman K. Anaerobic threshold alterations caused by endurance training in middle-aged men. J Appl Physiol 1979;46:1039-46.
41. Beaver WL, Wasserman K, Whipp BJ. A new method for detecting anaerobic threshold by gas exchange. J Appl Physiol 1986;60:2020-7.
42. Simon J, Young JL, Blood DK, Segal KR, Case RB, Gutin B. Plasma lactate and ventilation thresholds in trained and untrained cyclists. J Appl Physiol 1986;60: 777-81.
43. Davis JA. Anaerobic threshold: review of the concept and directions for future research. M ed Sci Sports Exerc 1985;17:6-21.