Functional Diversity of Plant–Pollinator
Interaction Webs Enhances the Persistence
of Plant Communities
Colin Fontaine1,2*, Isabelle Dajoz1,2, Jacques Meriguet1,2, Michel Loreau2,3
1UMR 7618: Bioge´ochimie et Ecologie des Milieux Continentaux (BIOEMCO), Ecole Normale Supe´rieure, Paris, France,2UMR 7625: Fonctionnement et E´volution des Syste`mes E´cologiques, Ecole Normale Supe´rieure, Paris, France,3Department of Biology, McGill University, Montre´al, Que´bec, Canada
Pollination is exclusively or mainly animal mediated for 70% to 90% of angiosperm species. Thus, pollinators provide an essential ecosystem service to humankind. However, the impact of human-induced biodiversity loss on the functioning of plant–pollinator interactions has not been tested experimentally. To understand how plant communities respond to diversity changes in their pollinating fauna, we manipulated the functional diversity of both plants and pollinators under natural conditions. Increasing the functional diversity of both plants and pollinators led to the recruitment of more diverse plant communities. After two years the plant communities pollinated by the most functionally diverse pollinator assemblage contained about 50% more plant species than did plant communities pollinated by less-diverse pollinator assemblages. Moreover, the positive effect of functional diversity was explained by a complementarity between functional groups of pollinators and plants. Thus, the functional diversity of pollination networks may be critical to ecosystem sustainability.
Citation: Fontaine C, Dajoz I, Meriguet J, Loreau M (2006) Functional diversity of plant–pollinator interaction webs enhances the persistence of plant communities. PLoS Biol 4(1): e1.
Introduction
Understanding the consequences of biodiversity loss for ecosystem functioning and services is currently a major aim of ecology [1,2]. Animal-mediated pollination is one of the essential ecosystem services provided to humankind [3,4]. The negative impact of pollinator decline on the reproductive success of flowering plants has been documented at the species level [5–7], but little information is available at the community level [8]. Increasing the scale of study to the community level is essential to account for potential competitive or facilitative effects among species that belong to the plant–pollinator network. Such effects, which are often linked to diversity [9,10], are known to have large influences on ecological processes such as community productivity and stability [11,12].
Experimental evidence for diversity effects on the func-tioning of terrestrial ecosystems is mainly available for plants. As primary producers, plants play a central role in the flow of energy within ecosystems [13,14]. Animal-pollinated angio-sperms represent up to 70% of plant species in numerous communities and ecosystems [15]. Mutualistic interactions between animals and plants form several intricate interaction webs [16]. Recent analysis of plant–pollinator and plant– frugivore interaction webs demonstrates that these contain a continuum from fully specialist to fully generalist species [17,18]. However, these networks are structured in a nested way [19,20], with specialists mainly interacting with general-ists. Such a pattern might have important consequences for ecosystem functioning, because it might confer resilience to perturbations such as the extinction of species [21] if, for example, generalist pollinators buffer the loss of specialist pollinators [18,22–24]. Furthermore, this hypothesis does not take into account the dynamical properties of these networks.
In a plant–pollinator community, variations in species diversity at different trophic levels may lead to an adaptation of interaction strengths [25], which may in turn affect the total effectiveness of pollination. We conclude that more information is urgently needed concerning the impacts of biodiversity loss on multispecies and multitrophic interac-tions.
To experimentally test the effect of functional diversity on the functioning and persistence of plant–pollinator com-munities, we defined functional groups of plants and pollinators based on morphological traits. For plants, two functional groups with three species each were defined according to accessibility of floral rewards (pollen and nectar; see Figure 1). The first group (group 1) included Matricaria officinalis, Erodium cicutarium,andRaphanus raphanistrum,which have easily accessible floral rewards and will be called‘‘open flowers.’’ The second group (group 2), called ‘‘tubular flowers,’’includedMimulus guttatus, Medicago sativa,andLotus corniculatus,all of which present floral rewards hidden at the bottom of a tubular corolla. For pollinators, two functional
Received May 23, 2005; Accepted October 11, 2005; Published December 13, 2005 DOI: 10.1371/journal.pbio.0040001
Copyright:Ó2006 Fontaine et al. This is an open-access article distributed under the terms of the Creative Commons Attribution License, which permits unrestricted use, distribution, and reproduction in any medium, provided the original author and source are credited.
Abbreviations: A, syrphid group; ANOVA, analysis of variance; B, bumble bee group; C, combined (syrphid and bumble bee) group; df, degrees of freedom; group 1, open flower; group 2, tubular flower; group 3, combined (open and tubular) flower; SE, standard error
Academic Editor: Nick Waser, University of California at Riverside, United States of America
groups were defined according to mouthparts length (Figure 1). The first group (group A) included three species of syrphid flies (Diptera) with short mouthparts:Saephoriasp.,Episyrphus balteatus, and Eristalis tenax. The second group (group B) included three species of bumble bees with longer mouth-parts:Bombus terrestris, B, pascuorum,andB, lapidarius. Note that in this case a functional trait (long mouthparts) and a phylogenetic group are confounded. Preliminary observa-tions showed that these six insect species contribute up to 70% of all pollinating visits to flowers in our study area in France. Constructing a plant–pollinator network with these four functional groups leads to a nested structure with specialists interacting with generalists (Figure 1, third column). In principle, syrphid flies cannot efficiently polli-nate tubular flowers because their mouthparts are too short. At the beginning of spring 2003, we set up 36 4-m2caged experimental plant communities. There were three plant treatments following a ‘‘substitutive’’ design [26]. Two of them contained one of the two plant functional groups alone (group 1 or 2), whereas the third contained both plant functional groups in combination (group 3). We applied three different pollination treatments to each plant treatment, by introducing each pollinator functional group alone (group A or B), or both groups together (group C). This full factorial design led to nine experimental treatments, which were replicated four times each, making a total of 36 experimental units. The pollination treatments were applied in two consecutive years (June–July 2003 and 2004). We controlled for the total number of pollinator visits received by each plot during the two pollination seasons (1,000 visits in 2003 and 1,200 visits in 2004) to allow an unbiased comparison of pollination efficiency among the various experimental treat-ments.
In August and September 2003, we counted the number of fruits on each plant in every plot. We also counted the number of seeds per fruit on five collected fruits per plant. Lastly, in April 2004 and 2005, we measured both the number of plant species present at the seedling stage (recruitment richness) and the total number of seedlings (recruitment density) to determine the effects of the experimental treat-ments on the natural recruitment of the next plant generation.
Results
Effects on Plant Reproductive Success
The reproductive success of the two plant functional groups after the first season is analysed in Table 1. There
was a significant effect of pollination treatment on the number of fruits per plant (Table 1, left; standardized means
6 standard error [SE]: syrphid0.2786 0.061, bumble bee 0.22160.065, and both 0.06360.068). Orthogonal contrasts on pollination treatment indicate that the identity of the pollinator guild (syrphid [A] versus bumble bee [B]) had a significant effect. There was a higher fruit production in bumble bee–pollinated communities than in those pollinated by syrphids. Moreover, the breakdown of the interaction of pollination and plant treatments into the orthogonal contrasts A1 versus B1 and A2 versus B2 indicates that the two plant functional groups responded differently to the identity of the pollinator functional group. Tubular 3 flowers (group 2) produced significantly fewer fruits in the syrphid treatment, whereas open flowers (group 1) produced the same amount of fruits whatever the identity of the pollinator functional group (Figure 2A). This supports our hypothesis that bumble bees were able to pollinate both plant functional groups whereas syrphids could only efficiently pollinate open flowers. Although the functional diversity of plant or pollinator treatment alone had no significant effect, fruit production tended to increase with both plant and pollinator functional diversity (contrast [A1þA2þB1þB2] versus C3; Figure 2B).
With respect to seed set per fruit, the interaction between plant and pollination treatment was marginally significant (Table 1, right). As with fruit production, the contrasts A1 versus B1 and A2 versus B2 indicate that the two plant functional groups responded differently to pollinator func-tional group identity. The pattern, however, was different: Open flowers produced significantly fewer seeds per fruit in the bumble bee treatment than in the syrphid treatment (Figure 2C). This means that bumblebees were less-efficient pollinators than syrphids for open flowers. This could be due to the higher rate of geitonogamous visits (i.e., consecutive visits to different flowers of the same plant, resulting in self-fertilization) by bumblebees. Indeed, preliminary observa-tions using a similar experimental design showed that bumble bees perform a higher percentage of geitonogamous visits than do syrphids (I. Dajoz, unpublished data). Finally, the mean number of seeds per fruit in the plant communities tended to increase with functional diversity of pollination treatments (contrast [AþB] versus C; Figure 2D).
Effects on Natural Recruitment
We analysed the long-term effects of our pollination treatments on the natural recruitment of our experimental plant treatments after the first and second pollination Figure 1.Experimental Pollination Web
Summary of the characteristics upon which functional groups of pollinators (left) and plants (right) were based. In the middle, the arrows linking insect heads to flower types show the theoretical pollination network when all functional groups are present.
seasons. The results are presented in Table 2. There was a significant effect of year on recruitment richness with a higher richness after the second pollination season (mean6
SE: 1.916 6 0.075 in 2004, and 2.291 6 0.0856 in 2005). Among the possible causes was a severe drought in 2003 [27], which likely affected both plant and insect populations. Such a drought did not occur in 2004. This difference in climate between years may account for a large part of the year effect. Recruitment richness was significantly different among plant treatments, with fewer species recruiting in tubular
communities (Figure 3). This is very likely due to two perennial species (whereas all species are annuals in the other group) which may have different reproductive traits and create differences in competitive intensity among the plant treatments. There was a significant effect of pollination treatment, with a higher recruitment richness when both groups of pollinators were present (means 6 SE: syrphid 1.85460.973, bumble bee 2.0526 0.826, and both 2.4066
1.062). However, as suggested by the significant interaction between plant and pollination treatments, the pattern was more complex (Figure 3A). In fact, pollination treatments had no effect on recruitment richness in open-flower plant treatment (Figure 3A, left). In the tubular-flower plant treatment, recruitment in the syrphid fly treatment tended to be lower than in the other pollination treatments (Figure 3A, centre). But the positive effect of pollinator functional diversity was obvious in the plant treatment that contained both plant functional groups (Figure 3A, right). In the mixed plant treatment, recruitment richness under the most func-tionally diverse pollination treatment was substantially above that in the two other treatments.
Considering recruitment density, there was also a signifi-cant effect of year, with a higher density after the second pollination season (mean6SE: 26.784 62.324 in 2004 and
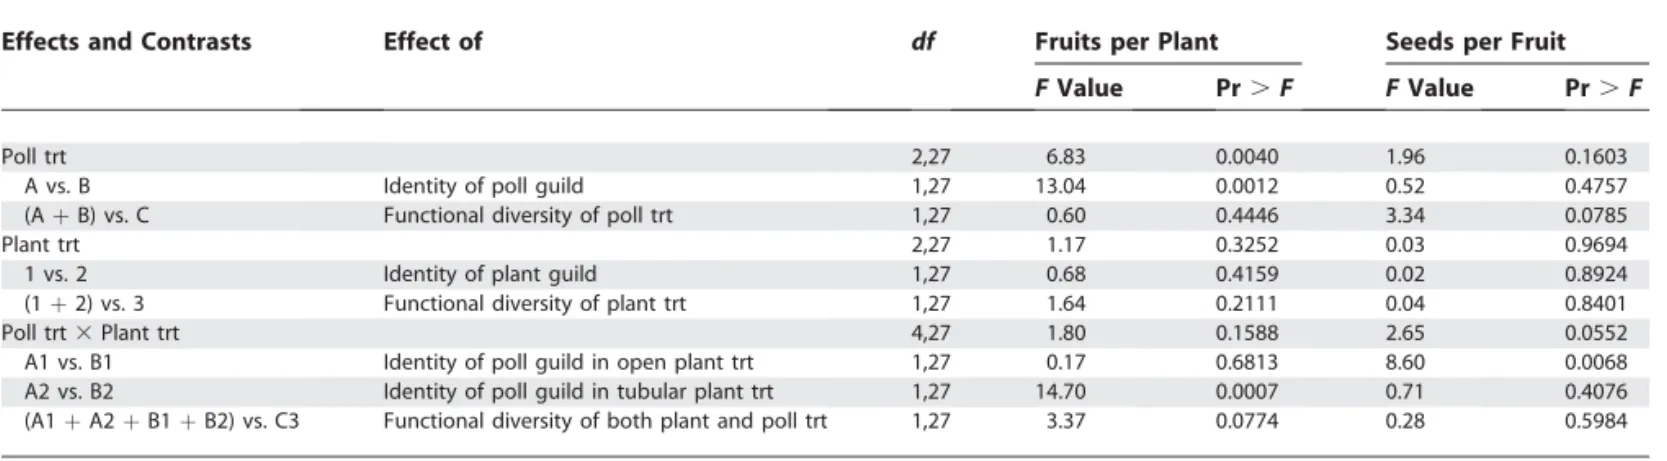
Table 1.Analysis of Plant Reproductive Success
Effects and Contrasts Effect of df Fruits per Plant Seeds per Fruit
FValue Pr.F FValue Pr.F
Poll trt 2,27 6.83 0.0040 1.96 0.1603
A vs. B Identity of poll guild 1,27 13.04 0.0012 0.52 0.4757
(AþB) vs. C Functional diversity of poll trt 1,27 0.60 0.4446 3.34 0.0785
Plant trt 2,27 1.17 0.3252 0.03 0.9694
1 vs. 2 Identity of plant guild 1,27 0.68 0.4159 0.02 0.8924
(1þ2) vs. 3 Functional diversity of plant trt 1,27 1.64 0.2111 0.04 0.8401
Poll trt3Plant trt 4,27 1.80 0.1588 2.65 0.0552
A1 vs. B1 Identity of poll guild in open plant trt 1,27 0.17 0.6813 8.60 0.0068
A2 vs. B2 Identity of poll guild in tubular plant trt 1,27 14.70 0.0007 0.71 0.4076
(A1þA2þB1þB2) vs. C3 Functional diversity of both plant and poll trt 1,27 3.37 0.0774 0.28 0.5984
Results from the ANOVA on the two measures of plant reproductive success (number of fruits per plant and number of seeds per fruit). The overall pollination and treatment effects are subdivided into two orthogonal contrasts testing for their identity and diversity components. The interaction between the pollination and plant treatments is subdivided into three orthogonal contrasts. For contrasts, the upper case letters A, B, and C represent the different pollination treatments, i.e., syrphids, bumble bees, and both groups, respectively, while the numbers 1, 2, and 3 represent the different plant treatments, i.e., open flowers, tubular flowers, and both groups, respectively.
df,degrees of freedom; poll, pollinator; trt, treatment. DOI: 10.1371/journal.pbio.0040001.t001
Figure 2. Effects of Pollinator Identity and Diversity on Plant Reproductive Success
The left panels show the effects of pollinator guild identity (S indicates syrphid flies, B indicates bumble bees) on the reproductive success of the two plant guilds (open circle indicates open-flowers [group 1], closed circle indicates tubular-flowers [group 2]). Reproductive success was measured by (A) the standardized number of fruits per plant and (B) the standardized number of seeds per fruit. The right panels show the effects of the functional diversity of pollination treatments (triangle), plant treatment (inverted triangle) and both (diamond) on the standardized numbers of fruits per plant (C) and seeds per fruit (D). Lines connecting symbols indicate significant effects (solid indicatesp,0.001, dashed indicatesp,0.08). Error bars represent one standard error. See Table 1 for statistical analysis.
DOI: 10.1371/journal.pbio.0040001.g002
Table 2.Analysis of Plant Recruitment Richness and Density
Effects df Recruitment
Richness
Recruitment Density
FValue Pr.F FValue Pr.F
Pollination trt 2,27 6.77 0.0041 3.51 0.0442
Plant trt 2,27 35.88 ,0.0001 6.22 0.0060
Year 1,27 19.97 0.0001 12.69 0.0014
Pollination trt3plant trt 4,27 3.63 0.0171 4.74 0.0050 Pollination trt3year 2,27 0.43 0.6539 0.42 0.6585 Plant trt3year 2,27 0.64 0.5366 2.54 0.0978 Pollination trt3plant trt3year 4,27 0.91 0.4698 1.62 0.1978
Results from the ANOVA on the two measures of plant recruitment (recruitment richness and recruitment density). df,degrees of freedom; trt, treatment.
31.319 6 1.937 in 2005), and a significant effect of plant treatment, with fewer individuals recruiting in tubular communities (Figure 3B, centre). These year and plant-treatment effects can be explained in the same way as for recruitment richness (see above). There was also a significant effect of pollination treatment, with a lower recruitment density when plant communities were pollinated by syrphid flies alone (means6 SE: syrphids: 24.1046 20.464, bumble bees: 34.364 6 32.781, and both 28.688 6 21.459). This is congruent with our results on the number of fruits produced per plant (see Table 1, contrast A versus B). As for recruit-ment richness, there was a significant interaction between plant and pollination treatments (Figure 3B). In the open-flower plant treatment, recruitment density was not signifi-cantly different among pollination treatments (Figure 3B, left). But in the tubular-flower plant treatment, recruitment density was significantly higher in the bumble bee treatment than in the other pollination treatments (Figure 3B, centre). Finally, in the mixed plant treatment, the same pattern as for
recruitment richness was observed: There was a higher density in the mixed pollination treatment than in single-guild pollination treatments (Figure 3B, right).
Note that these results on natural recruitment are not an artefact caused by sampling small quadrats in heterogeneous experimental plots since the same patterns were observed when data from all quadrats in a plot were pooled.
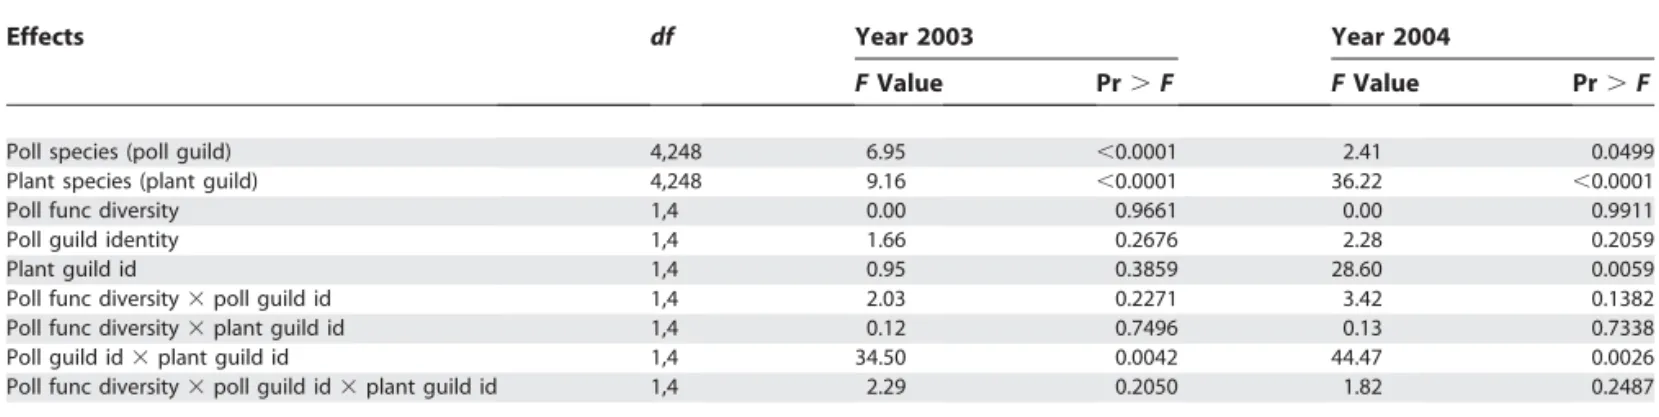
Pollination Visitation Web in the Mixed Plant Treatment To explain the strong effect of pollinator functional diversity on the persistence of mixed plant communities, we carried out a log-linear analysis on the visitation rate of each insect species in a given pollination treatment, for the six plant species of the mixed plant treatment. Data from the year 2003 are illustrated in Figure 4, and the results of the analysis on both years are presented in Table 3. In the second year, there was a significant effect of plant functional group identity: Tubular flowers received a higher number of visits than did open flowers (mean visitation frequency 6SE: for open flowers 0.236 60.097 and for tubular flowers 0.7636
0.097). This is very likely due to the two well-established perennial species, which produced a more attractive floral display during the second year of the experiment. For the two years of the experiment, there was a significant interaction between plant functional group and pollinator functional group. This indicates that the two pollinator functional groups were specialised on different plant functional groups (mean visitation frequency6SE on open flowers and tubular flowers, respectively: in 2003, for bumble bees 0.12860.058 and 0.4336 0.075; for syrphids 0.327 60.043 and 0.113 6
0.052; in 2004, for bumble bees 0.0160.005 and 0.5860.075; for syrphids 0.2360.055 and 0.1860.087). Syrphids mainly visited open flowers whereas bumble bees preferentially visited tubular flowers (Figure 4). Even though bumble bees can pollinate open flowers quite efficiently when this is the only plant functional group present (as shown by the reproductive success, recruitment diversity, and recruitment density of the open-flower plant treatment in the bumble bee treatment, Figures 2 and 3), they focus on the tubular-flower group in the mixed plant treatment. In the mixed pollination treatment, the match between plant and pollinator functional groups leads to a more homogenous distribution of polli-nator visits among plant groups than in the other pollination treatments. Ultimately, this significantly increases the repro-ductive success of plants, most likely through the homoge-nisation of pollinator visits and the minimization of inefficient pollinator visits.
Discussion
Previous studies on the diversity of plant–pollinator interaction webs were either descriptive [16], carried out on a single plant species [6,7,28–30], or based on simulation [21] and theoretical approaches [22,31]. To our knowledge, this is the first experimental evidence that the persistence of a plant community can be affected by a loss of diversity of its pollinating fauna. Of course, our experimental communities differed from natural ones in several respects. Among other things, the interaction networks we studied were much simpler than those occurring in nature; in particular, they contained fewer species in each trophic level. But such Figure 3.Effects of Pollination Treatments on Plant Recruitment
simplifications from natural situations are often necessary to carry out controlled experiments.
In plant communities that contained only open flowers, plants produced fewer seeds per fruit in the bumblebee treatment than in the syrphid treatment (Figure 2C), but this was compensated by a sufficiently high fruit production, leading to a richness and density of natural recruitment that was similar to the other pollination treatments (Figure 3A and 3B left). Thus, in these communities, all pollination treatments were equally effective in the long term.
In plant communities that contained only tubular flowers, syrphids were inefficient pollinators; fruit production was very low (Figure 2A) and insufficient to allow a good natural recruitment. Bumble bees were the most effective pollinators (Figure 3A and 3C, centre). Note that in the bumble bee treatment, the very high value of average recruitment density was due to three measurements in two replicates, in which onlyM. guttatusseedlings were recorded at a very high density (more than 150 seedlings per quadrat). To test the effect of these outliers, we removed them and repeated our analysis. The same significant effects were observed, except for the effect of pollination treatment, which became marginally significant (p¼0.0645). The new mean number of seedlings per quadrat for this experimental treatment was 32.1764.55 (SE), which is still slightly above the value for the pollination treatment with both pollinator groups. For plant commun-ities that contained only tubular flowers, recruitment rich-ness in the two pollination treatments that contained bumblebees was similar.
These results are in agreement with our theoretical pollination network presented in Figure 1. In our exper-imental system, syrphids can be considered as specialist pollinators since they efficiently pollinate only open flowers. Bumble bees were potentially generalists as they induced an important fruit production of the two plant types and a good recruitment in the open- and tubular-flower plant treat-ments. Our results on the reproductive success and recruit-ment of single-guild plant treatrecruit-ments indicate that there are strong functional group identity effects since our plant functional groups responded differently to our pollinator functional groups.
However, the functional diversity of both the plant and pollination treatments was also important. Plant reproduc-tive success tended to increase with pollinator functional diversity when the number of seeds per fruit was considered, and with both plant and pollinator functional diversity when the number of fruits per plant was considered (Figures 2B and 2D). Although recruitment in single-guild plant treat-ments was mainly affected by the identity of functional groups, the effect of functional diversity was dramatic in the mixed plant treatment. Natural recruitment of plant com-munities visited by mixed pollinator guilds was largely above that in other pollination treatments.
Pollination by syrphids alone allowed the reproduction of open flowers but not tubular flowers, as expected from the specialisation of syrphids. More surprisingly, however, bum-ble bees failed to be efficient generalist pollinators. Most of their visits occurred on tubular flowers (Figure 4), resulting in a relatively poor recruitment of open flowers. The only pollination treatment that achieved a high recruitment of both open and tubular flowers when they were mixed, was the one containing the two insect functional groups (Figure 3, right). When syrphids and bumble bees simultaneously pollinated mixed plant communities, they each focused on their target plant functional group, leading to more efficient visits and a better distribution of visits among plant functional groups (Figure 4). Ultimately, it was the pollination treatment with both pollinator functional groups that produced the highest richness and density of natural recruit-ment. Consequently, since most natural plant communities contain both open and tubular flowers, pollinator functional Figure 4.Visitation Web in the Communities with Both Plant Types
Distribution of pollinator visits for the year 2003, among the six plant species in the plant treatment containing the two plant functional groups, (A) for the mixed pollination treatment (SþB) and (B) for the single functional group pollination treatments (S or B). The length of the side of the black squares shows the proportion of visits by a given pollinator species on each plant species. Lower-case letters represent plant species: a,Ma. officinalis;b, E. cicutarium;c,R. raphanistrum;d, Mi.guttatus;e,Me. sativa;f,L. corniculatus. Numbers represent pollinator species: 1,Saephoriasp.; 2,Ep. balteatus;3,Er. tenax;4,B. terrestris;5,B. pascuorum;6,B. lapidarius.
diversity should strongly enhance the persistence of these communities.
Although our experimental system differed from natural communities, and information about the reciprocal effects of the functional diversity of plant communities on the diversity of pollinator communities would be useful, our study indicates that the functional diversity of plant–pollinator interaction webs may be critical for the persistence and functioning of ecosystems and should be carefully monitored and protected. The loss of pollinator functional diversity is likely to trigger plant population decline or extinctions [4], which in turn are likely to affect the structure and composition of natural plant communities and the produc-tivity of many agroecosytems that rely on insect pollination [8]. Ultimately, higher trophic levels may be affected since the diversity and biomass of consumers depend on primary production. Our results strongly suggest that the functional diversity of complex interaction webs plays a crucial role in the sustainability of ecosystems.
Materials and Methods
Experimental plant communities.At the beginning of spring 2003,
plant communities were set up in a meadow that remained almost undisturbed for 10 years at the Station Biologique de Foljuif, France, 80 km southwest of Paris. Prior to the establishment of the communities, soil was sterilized by injecting 1208C steam (30 min) to destroy the seed bank and soil pathogens. In each of the 36 4-m2 plots, a total of 30 adult plants were planted on a grid, spaced 25 cm from each other, to minimize competition and homogenise spatial distribution. Thus, plant density was the same in all experimental plots. We selected a moderate density to maintain within- and among-species competition to a low level, and to allow enough space for future recruitment in the plots. Each of these plant communities was enclosed in a 2-m–high nylon mesh cage in order to eliminate natural pollinator visitation.
Pollination rounds.During the flowering seasons (June–July 2003
and 2004), pollinators were captured around the study area and introduced into the cages. The relative abundance of pollinator species in the various pollination treatments reflects their natural abundances. From preliminary observations, we had noticed that, in order to have no more than three insects active at the same moment in a 4-m2plot, it was necessary to put about eight syrphid flies, or six
bumble bees, or a mixture of six syrphids and four bumble bees in each pollination cage. Each pollination round in a given plot included 200 visits in the year 2003 and 300 in the year 2004. In total, each plot received either four (in 2004) or five (in 2003) pollination rounds, leading to a total of 1,000 visits per plot in 2003 and 1,200 in 2004.
Pollination activity. Bumble bees needed approximately 30 min
after introduction in the cages to calm down and start to pollinate. In the pollination treatment with both pollinator guilds, we then introduced syrphids, which started to pollinate immediately. Mean visitation time was not significantly different between insects in the cages and in nature. This was true both for bumble bees (mean visitation time in cages: 3.2560.92 s, mean visitation time in nature: 2.91 61.33 s,t¼1.51,df¼96,p¼0.133) and for syrphids (mean visitation time in cages: 40.21 6 8.89 s, mean visitation time in nature: 35.38614.75 s,t¼0.77,df¼12,p¼0.45).
Measurement of reproductive success.One month after the first
pollination treatments, we counted the total number of fruits on each plant, except forM. guttatusandM. officinalisin which fruits cannot be counted without collecting them. We randomly took five fruits per plant of each species to estimate the number of seeds per fruit.
Measurement of recruitment richness and density. Recruitment
richness and density were estimated during the second (April 2004) and third (April 2005) year of the experiment by counting the number of seedlings of each species in four 1,600-cm2quadrats in
each plot.
Statistical analysis.Statistical analyses were performed using SAS
8.2 software.
For the analysis of plant reproductive success, we log-transformed the data to ensure normality. We standardized the data by species using the formula:xl/r(wherel¼the mean andr¼the standard deviation of number of fruits or number of seeds per fruit for a given plant species) in order to make the data comparable among the various species and functional groups. We used a mixed analysis of variance (ANOVA) model (SAS proc mixed), in which the fixed effects were plant treatment, pollination treatment, and their interaction term. To investigate the effects of the various plant and pollination treatments, we subdivided a priori each main effect into two components using orthogonal contrasts. The first contrast tested the effect of the identity of the plant or pollinator functional group, i.e. one group versus the other. The second tested the effect of the functional diversity of the plant or pollination treatment, i.e. single-guild versus mixed-single-guild plant or pollination treatments. Similarly, we subdivided the interaction into three orthogonal contrasts testing the effects of pollinator functional group identity on each plant guild, and the effect of the functional diversity of both plant and pollination treatments. See Table 1 for the construction of the contrasts.
For the analysis of plant recruitment, we used a repeated measure ANOVA model (SAS proc mixed). The fixed effects were pollination treatment, plant treatment, year, and all the interaction terms. The repeated effect was year, and the subject effect was replicate. For recruitment density, data were log transformed.
For each year of the experiment, the visitation rate of pollinators on each plant species in the communities with both plant functional groups was analysed using a mixed log-linear model (glimix macro, SAS). We subdivided the pollination treatment into two effects: pollinator functional diversity (one or two pollinator functional groups) and identity of the pollinator functional group (bumble bees or syrphids). The model included pollinator species nested within identity of pollinator functional groups, plant species nested within identity of plant functional group, identity of pollinator functional groups, identity of plant functional groups, pollinator functional diversity, and all interaction terms. The replicate was a random effect. Table 3.Analysis of Visitation Rates
Effects df Year 2003 Year 2004
FValue Pr.F FValue Pr.F
Poll species (poll guild) 4,248 6.95 ,0.0001 2.41 0.0499
Plant species (plant guild) 4,248 9.16 ,0.0001 36.22 ,0.0001
Poll func diversity 1,4 0.00 0.9661 0.00 0.9911
Poll guild identity 1,4 1.66 0.2676 2.28 0.2059
Plant guild id 1,4 0.95 0.3859 28.60 0.0059
Poll func diversity3poll guild id 1,4 2.03 0.2271 3.42 0.1382
Poll func diversity3plant guild id 1,4 0.12 0.7496 0.13 0.7338
Poll guild id3plant guild id 1,4 34.50 0.0042 44.47 0.0026
Poll func diversity3poll guild id3plant guild id 1,4 2.29 0.2050 1.82 0.2487
Results from a log-linear analysis of visitation rates of pollinators on plants (year 2003 and year 2004). df,degrees of freedom; func, functional; id, identity; poll, pollinator.
Acknowledgments
We thank Carine Collin, Romain Gallet, Jean-Francois le Galliard, Jacques Gignoux, Andy Gonzalez, Ge´rard Lacroix, Gaelle Lahoreau, Louis Lambrecht, Manuel Massot, Naoise Nunan, Virginie Tavernier, and Elisa Thebault for useful discussions; and Marco Banchi, Yves Bas, Mathilde Baude, Alix Boulouis, Marion Decoust, Patricia Genet, Alexandra Kabadajic, Mohsen Kayal, Fanny Marlin, and Emilie Patural for great help in the field and in the lab. We also thank Andy Gonzalez, Andy Hector, Marcel van der Heijden, Claire
Kremen, Jane Memmott, Nick Waser, and three anonymous reviewers for constructive and useful comments on the manuscript. We acknowledge the financial support of the Quantitative Ecology Coordinated Incentive Action (ACI Ecologie Quantitative) of the Ministry of Research (France).
Competing interests.The authors have declared that no competing
interests exist.
Author contributions.CF and ID designed the experiment. CF, ID,
and JM performed the experiment. CF analysed the data. CF, ID, and ML conceived the work and wrote the paper. &
References
1. Loreau M, Naeem S, Inchausti P, Bengtsson J, Grime JP, et al. (2001) Biodiversity and ecosystem functioning: Current knowledge and future challenges. Science 294: 804–808.
2. Naeem S, Thompson LJ, Lawler SP, Lawton JH, Woodfin RM (1994) Declining biodiversity can alter the performance of ecosystems. Nature 368: 734–737.
3. Costanza R, Arge R, Groot R, Farber S, Grasso M, et al. (1997) The value of the world’s ecosystem services and natural capital. Nature 387: 253–260. 4. Kearns CA, Inouye DW, Waser NM (1998) Endangered mutualisms: The
conservation of plant-pollinator interactions. Annu Rev Ecol Syst 29: 83–112. 5. Kremen C, Williams NM, Thorp RW (2002) Crop pollination from native bees at risk from agricultural intensification. Proc Natl Acad Sci U S A 99: 16812–16816.
6. Klein AM, Steffan-Dewenter I, Tscharntke T (2003) Fruit set of highland coffee increases with the diversity of pollinating bees. Proc R Soc Lond B Biol Sci 270: 955–961.
7. Herrera CM (1987) Components of pollinator ‘quality’: Comparative analysis of a diverse insect assemblage. Oikos 50: 79–90.
8. Tepedino VJ (1979) The importance of bees and other pollinators in maintaining floral species composition. Great Basin Nat Mem 3: 139–150. 9. Van der Heijden MGA, Klironomos JN, Ursic M, Moutoglis P, Streitwolf-Engel R, et al. (1998) Mycorrhizal fungal diversity determines plant biodiversity, ecosystem variability and productivity. Nature 396: 69–72. 10. Cardinale BJ, Palmer MA, Collins SL (2002) Species diversity enhances
ecosystem functioning through interspecific facilitation. Nature 415: 426– 429.
11. Callaway RM, Brooker RW, Choler P, Kikvidze Z, Lortie CJ, et al. (2002) Positive interactions among alpine plants increase with stress. Nature 417: 844–848.
12. Thebault E, Loreau M (2003) Food-web constraints on biodiversity-ecosystem functioning relationships. Proc Natl Acad Sci U S A 100: 14949–14954.
13. Hector A, Schmid B, Beierkuhnlein C, Caldeira MC, Diemer M, et al. (1999) Plant diversity and productivity experiments in European grasslands. Science 286: 1123–1127.
14. Tilman D, Reich PB, Knops J, Wedin D, Mielke T, et al. (2001) Diversity and productivity in a long-term grassland experiment. Science 294: 843–845. 15. Axelrod DI (1960) The evolution of flowering plants. In: Tax S, editor.
Evolution after Darwin. Volume 1, The evolution of life. Chicago: University of Chicago Press. pp. 227–305.
16. Memmott J (1999) The structure of a plant-pollinator food web. Ecol Lett 2: 276–280.
17. Olesen JM, Jordano P (2002) Geographic patterns in plant-pollinator mutualistic networks. Ecology 83: 2416–2424.
18. Jordano P, Bascompte J, Olesen JM (2003) Invariant properties in coevolutionary networks of plant-animal interactions. Ecol Lett 6: 69–81. 19. Bascompte J, Jordano P, Melian CJ, Olesen JM (2003) The nested assembly
of plant-animal mutualistic networks. Proc Natl Acad Sci U S A 100: 9383– 9387.
20. Va´zquez DP, Aizen MA (2004) Asymmetric specialization: A pervasive feature of plant-pollinator interactions. Ecology 85: 1251–1257. 21. Memmott J, Waser NM, Price MV (2004) Tolerance of pollination networks
to species extinctions. Proc R Soc Lond B Biol Sci 271: 2605–2611. 22. Ashworth L, Aguilar R, Galetto L, Aizen MA (2004) Why do pollination
generalist and specialist plant species show similar reproductive suscept-ibility to habitat fragmentation? J Ecol 92: 717–719.
23. Aizen MA, Feinsinger P (1994) Forest fragmentation, pollination, and plant reproduction in a chaco dry forest, Argentina. Ecology 75: 330–351. 24. Va´zquez DP, Simberloff D (2002) Ecological specialization and
suscepti-bility to disturbance: Conjectures and refutations. Am Nat 159: 606–623. 25. Kondoh M (2003) Foraging adaptation and the relationship between
food-web complexity and stability. Science 299: 1388–1391.
26. Austin MP, Fresco LFM, Nicholls AO, Groves RH, Kaye PE (1998) Competition and relative yield: Estimation and interpretation at different densities and under various nutrient concentrations usingSilybum marianum andCirsium vulgare. J Ecol 76: 157–171.
27. Ciais P, Reichstein M, Viovy N, Granier A, Ogee J, et al. (2005) Europe-wide reduction in primary productivity caused by the heat and drought in 2003. Nature 437: 529–533.
28. Motten AF, Campbell DR, Alexander DE, Miller HL (1981) Pollination effectiveness of specialist and generalist visitors to a North Carolina population ofClaytonia virginica. Ecology 62: 1278–1287.
29. Thostesen AM, Olesen JM (1996) Pollen removal and deposition by specialist and generalist bumblebees inAconitum septentrionale. Oikos 77: 77–84.
30. Kremen C, Williams NM, Bugg RL, Fay JP, Thorp RW (2004) The area requirements of an ecosystem service: Crop pollination by native bee communities in California. Ecol Lett 7: 1109–1119.