Abnormalities in Human Population
Liang Sun1., Yu Yu1., Tao Huang2., Peng An1
, Danxia Yu1, Zhijie Yu1, Huaixing Li1, Hongguang Sheng3, Lu Cai4, Jun Xue5, Miao Jing6, Yixue Li2,7*, Xu Lin1*, Fudi Wang1*
1Key Laboratory of Nutrition and Metabolism, Institute for Nutritional Sciences, Shanghai Institutes for Biological Sciences, Chinese Academy of Sciences and Graduate School of the Chinese Academy of Sciences, Shanghai, China,2Key Laboratory of Systems Biology, Shanghai Institutes for Biological Sciences, Chinese Academy of Sciences and Graduate School of the Chinese Academy of Sciences, Shanghai, China,3Department of Endocrinology, Shanghai Xuhui District Central Hospital, Shanghai, China,4Departments of Pediatrics, University of Louisville, Louisville, Kentucky, United States of America,5Department of Hematology, The First Nanjing People Hospital, Nanjing Medical University, Nanjing, China,6Life Science and Chemical Analysis Group in Agilent Technologies Company Limited, Shanghai, China,7Shanghai Center for Bioinformation Technology, Shanghai, China
Abstract
Background:Few studies assessed effects of individual and multiple ions simultaneously on metabolic outcomes, due to methodological limitation.
Methodology/Principal Findings:By combining advanced ionomics and mutual information, a quantifying measurement for mutual dependence between two random variables, we investigated associations of ion modules/networks with overweight/obesity, metabolic syndrome (MetS) and type 2 diabetes (T2DM) in 976 middle-aged Chinese men and women. Fasting plasma ions were measured by inductively coupled plasma mass spectroscopy. Significant ion modules were selected by mutual information to construct disease related ion networks. Plasma copper and phosphorus always ranked the first two among three specific ion networks associated with overweight/obesity, MetS and T2DM. Comparing the ranking of ion individually and in networks, three patterns were observed (1) ‘‘Individual ion,’’ such as potassium and chrome, which tends to work alone; (2) ‘‘Module ion,’’ such as iron in T2DM, which tends to act in modules/network; and (3) ‘‘Module-individual ion,’’ such as copper in overweight/obesity, which seems to work equivalently in either way.
Conclusions:In conclusion, by using the novel approach of the ionomics strategy and the information theory, we observed potential associations of ions individually or as modules/networks with metabolic disorders. Certainly, these findings need to be confirmed in future biological studies.
Citation:Sun L, Yu Y, Huang T, An P, Yu D, et al. (2012) Associations between Ionomic Profile and Metabolic Abnormalities in Human Population. PLoS ONE 7(6): e38845. doi:10.1371/journal.pone.0038845
Editor:Yiqing Song, Brigham & Women’s Hospital, and Harvard Medical School, United States of America
ReceivedJanuary 17, 2012;AcceptedMay 11, 2012;PublishedJune 13, 2012
Copyright:ß2012 Sun et al. This is an open-access article distributed under the terms of the Creative Commons Attribution License, which permits unrestricted use, distribution, and reproduction in any medium, provided the original author and source are credited.
Funding:This work was supported by research grants from the Ministry of Science and Technology of China (973 Program) (2009CB941400, 2011CB966200 to F.W., 2011CB504002 and 2008DFA31960 to X.L., and 2011CB910200 to Y.L.); the National High Technology Research and Development Program (863 Program) (2009AA022704 to X.L.); the National Natural Science Foundation of China (10979071, 30970665, 31030039 to F.W., 30930081, 81021002 to X.L., 90913009 to Y.L.; 30901193 to Y.Y.); the Knowledge Innovation Program Project of the Chinese Academy of Sciences (KSCX2-EW-R-10 to X.L. and KSCX2-EW-R-04 to Y.L.); Chinese Academy of Sciences Hundred Talents Program (KSCX2-YW-R-141 to F.W.); Science & Technology Commission of Shanghai Municipality grant (10JC1416800 to F.W.); Chief Scientist Program of Shanghai Institutes for Biological Sciences, Chinese Academy of Sciences (SIBS2008006 to X.L.) and Clinical Center of Shanghai Xuhui District Central Hospital grant (CRC2010012 to F.W.), the CAS/SAFEA International Partnership Program for Creative Research Teams and the China Postdoctoral Science Foundation (20110490751 to L.S.; 2012M510902 to Y.Y.) and SIBS-CAS Outstanding Youth fellowship (2010KIP309 to Y.Y.). F.W. is a scholar of the Hundred Talents Program of the Chinese Academy of Sciences. The funders had no role in study design, data collection and analysis, decision to publish, or preparation of the manuscript.
Competing Interests:The authors have the following interests to declare: Miao Jing is an Agilent Technologies Co., Ltd employee and is co-author for the paper. ICP-MS Agilent Technologies Co., Ltd only provided ICP-MS technique supporting and consulting. Agilent only helped with consulting maintenance for our institute ICP-MS equipment and ion measurement. Agilent did not provide any of the financial support. This does not alter the authors’ adherence to all the PLoS ONE policies on sharing data and materials, as detailed online in the guide for authors.
* E-mail: [email protected] (FW); [email protected] (YL); [email protected] (XL)
.These authors contributed equally to this work.
Introduction
Emerging evidence has suggested that ion homeostasis may play important roles in the global epidemic trend of obesity and related metabolic abnormalities, such as insulin resistance, metabolic syndrome, and type 2 diabetes. Higher body iron (Fe) stores were reported to predict hyperglycemia and type 2 diabetes by some prospective studies [1,2,3], whereas higher serum magnesium (Mg) levels were associated with lower risks of metabolic syndrome and
under various physical and pathologic conditions [13,14]. Owing to methodological limitation which could only estimate a few ions at one time, it remains unclear whether a single ion alone or a network of several ions affects metabolic outcomes in a different manner. With recently advanced ionomic technology combining with a mutual information approach which studies multiple ions and their interactions globally as ion modules and/or ion networks, we therefore are able to elucidate complicate associa-tions of ions with metabolic abnormalities systematically.
In recent years, ‘‘omics’’ strategy in the combination with complex multivariate statistical analysis has been extensively applied to discriminate organic bimolecular and reveal biomarkers or patterns in sampled subpopulations in a comparative quanti-fication manner [15]. Introduced by Lahner and colleagues, the term of ionome means the inclusion of all metals, metalloids, and nonmetals presented in an organism [16], and has been extended as metallome that includes biologically significant nonmetals such as phosphorus (P), sulfur (S), selenium (Se) [17,18]. However, little is known regarding to the information of the ionome so far [19,20]. Because ionome involves such a broad range of important biological processes, including electrophysiology (potassium [K], sodium [Na]), signal transduction (Ca, Zn), enzymology (copper [Cu], Zn, Se) and structural integrity (Zn, Fe), understanding of the role(s) of ionomic profile and its association with metabolic abnormality will provide novel mechanistic insights linking ion homeostasis and metabolic consequences.
One of major challenges related with analysis of complicated ion network is that traditional methods like principal component analysis (PCA) which is usually based on linear dependences to construct patterns for data with high dimension [21]. However, the interaction among multiple ions might result in much more complex relationships within ion modules/networks than simply linear dependences [13,14]. To overcome this problem, we applied mutual information in our analysis. Mutual information is a measurement used to quantify the mutual dependence between two random variables [22,23], and can be applied for either linear or non-linear dependence [24,25]. This method has been widely used in measuring the co-expression of genes for microarray data analysis [26], and in applying machine learning approaches of bioinformatics, such as feature selection [27]. It was indicated by number of studies that mutual information was more accurate than analysis of variance (ANOVA) and Kruskal-Wallis test in detecting associations [28]. Therefore, by combining the advanced ionomic with mutual information approach, we systematically investigated the ionomic profile, represented by ion modules and/or networks, and their associations with overweight/obesity, metabolic syndrome and type 2 diabetes in Chinese men and women.
Methods
Ethics Statement
The study was approved by the Institutional Review Board of the Institute for Nutritional Sciences and written informed consent was obtained from each participants.
Study Population and Sample Collection
This study used a population-based case-control sample including 559 overweight/obese (body mass index [BMI]$24.0 kg/m2) and 500 age and sex matched normal-weight (18#BMI,24.0 kg/m2) individuals aged 35 to 54 years living in Shanghai, China. The detail of the study was described in elsewhere [29]. Home interviews were conducted by trained health professionals and information on demographics, health
status and behaviors were collected through standardized ques-tionnaires [29]. All participants were subsequently invited to take a physical examination after overnight fasting in the local Centers for Disease Control and Prevention (CDC) and community clinics. Body weight, height, waist circumference, and blood pressure were measured by a standardized protocol [29]. Individuals without data of ion (n = 83, 7.8%) were excluded and a total of 976 participants was included in the final analyses.
During the physical examination, fasting peripheral venous blood was collected by a tube containing anticoagulant and then centrifuged at 4uC, 3000 rpm for 15 min. All samples were shipped in dry ice to the Institute for Nutritional Sciences and stored at280uC until analysis. Measurements of total cholesterol, high-density lipoprotein (HDL) cholesterol, low-density lipoprotein (LDL) cholesterol, triglycerides, glucose, C-reactive protein (CRP), and interleukin-6 (IL-6) were described previously [29].
Metabolic syndrome was defined according to the updated National Cholesterol Education Program-Adult Treatment Panel III criteria for Asian-Americans [30], including at least 3 of the following components: 1) Waist circumferences$90 cm in men or $80 cm in women; 2) Triglycerides $1.7 mmol/l; 3) HDL cholesterol,1.03 mmol/l in men or,1.30 mmol/l in women; 4) Blood pressure$130/85 mmHg, or current use of anti-hyperten-sive medications; and 5) Fasting plasma glucose (FPG) $5.6 mmol/l. Type 2 diabetes was defined as FPG $7.0 mmol/L or 2-h postload plasma glucose $11.1 mmol/l during an oral glucose tolerance test (OGTT). OGTT was conducted in 476 subjects with 5.5#FPG,7.0 mmol/l during the physical examination. The selection procedure for OGTT was described elsewhere [29].
Laboratory Measurements for ICP-MS Detection
Instrument and reagents. Agilent 7500cx inductively cou-pled plasma mass spectroscopy (ICP-MS) system (Agilent Tech-nologies, Tokyo, Japan) equipped with a G3160B I-AS integrated autosampler was employed to measure ion profile. G3148B ISIS system was also used to reduce detection time and volume of each sample. Ni sample cone and skimmer cone were utilized with an orifice diameter of 1.0 and 0.4 mm, respectively. Sample introduction was performed with a micromist nebulizer combined with a Scott-type double pass spray chamber (Agilent Technolo-gies). The instrument was tuned to optimal conditions in terms of sensitivity (Li, Y, Co, and Tl) and CeO/Ce and Ce2+
/Ce by using a tuning solution (Agilent Technologies) containing 1mg/L of Li, Y, Tl, Ce and Co in 2% HNO3 (w/v). The determination was
operated in full quantitative mode, and typical operating conditions used in this study were summarized inTable S1.
The internal standard containing Ge,6Li, Lu, Rh, Tb, Sc, In, and Bi (SPEX CertiPrep) was injected by peristaltic pump into the ion source at an approximate concentration of 500mg/L in the online mode. The multi-element standard solution containing aluminum (Al), arsenic (As), boron (B), barium (Ba), beryllium (Be), bismuth (Bi), Ca, cadmium (Cd), cobalt (Co), chromium (Cr), Cu, Fe, K, lithium (Li), Mg, manganese (Mn), molybdenum (Mo), Na, nickel (Ni), P, lead (Pb), palladium (Pd), rhenium (Re), S, antimony (Sb), Se, silicon (Si), stannum (Sn), strontium (Sr), vanadium (V), titanium (Ti), wolfram (W) and Zn, each at a concentration of 1000mg/mL (SPEX CertiPrep) were used. We detected 17
Each 100mL of the plasma sample was placed into a 15 mL
centrifuge tube coated with PFA, to which 400mL HNO3 was
added. The centrifuge tube was then placed into 150uC water bath for 3 h until the solution became clear. The resulting solution was diluted with ultrapure water to about 2 mL. The diluted samples were stored at 4uC for ICP-MS analysis.
ICP-MS analytical validation. To test the validity of the whole detection system, we determined concentrations of Na, Mg, K, Ca, Fe, Cu, Zn, and Se in human serum (National Institute of Quality Standards, Beijing, China, GBW09152) and compared them with reference concentrations. Serum samples were pre-treated and determined in the same procedure as described above (Table S2). Moreover, the recovery test of 17 elements in human plasma samples was repeated three times. At first, 17 elements were quantified at their original concentrations. Then, the 20mg/ L multi-element standard solution was added to random plasma samples, and the spiked samples were assayed. Recoveries were estimated using the formula: recovery (%) = ((amount found-original amount)/(amount spiked))6100% (Table S3). Addi-tionally, the intra- and inter-day stability of the instrument was assessed by analyzing concentrations of 17 elements in the quality control sample of fetal bovine serum (Sijiqing Co. Ltd., Hangzhou,
China) added with 20mg/L multi-element standard solution. We
detected quality control samples after each 10 plasma samples. Moreover, concentrations of 17 elements in one human plasma sample were detected 10 times in parallel to confirm the precision of the method (Table S4).
Bioinformatics Analysis
Log-transformations were performed for all 17 ions to approximate normality. Analysis of covariance for continuous variables and logistic regression models for categorical variables were applied for the comparison across different metabolic outcomes.
All ion modules were tested to determine whether they were associated with overweight/obesity, metabolic syndrome or type 2 diabetes based upon information theory. When computing the conditional mutual information between ion module and disease status, the following variables: for overweight/obesity, sex and age were adjusted; for metabolic syndrome and type 2 diabetes, sex, age and BMI were adjusted. Then the significant ion modules were selected to construct relevant ion networks as following three steps:
Table 1.Characteristics of participants according to obese status (n = 976).
Normal-weight Overweight/Obesity
18#BMI,24 BMI$24 P value
N 460 516
Age (yrs)* 45.8 (5.5) 46.0 (5.3) 0.487
Men (n, %)* 149 (32.4) 207 (40.1) 0.012
Physical inactivity (n, %) 230 (50.0) 256 (49.6) 0.912
Education levels (n, %) 0.004
0,9 yrs 105 (22.8) 159 (30.8)
10,12 yrs 247 (53.7) 260 (50.4)
.12 yrs 108 (23.5) 97 (18.8)
Current smoker (yes, n, %) 97 (21.1) 137 (26.6) 0.687
Alcohol drinker (yes, n, %) 168 (36.5) 183 (35.5) 0.106
Family history of chronic diseases (n, %) 186 (40.4) 209 (40.5) 0.972
Metabolic syndrome (n, %) 43 (9.4) 356 (69.0) ,0.001
Type 2 diabetes (n, %) 26 (5.7) 96 (18.6) ,0.001
BMI (kg/m2) 21.0 (1.4) 27.9 (2.6)
,0.001
Waist circumference (cm) 75.7 (6.1) 92.9 (7.8) ,0.001
Systolic blood pressure (mmHg) 118.0 (15.1) 130.5 (17.5) ,0.001
Diastolic blood pressure (mmHg) 74.4 (9.7) 83.7 (11.4) ,0.001
Glucose (mmol/l) 5.76 (1.05) 6.26 (1.49) ,0.001
Insulin (mU/ml){ 7.4 (7.0–7.7) 11.2 (10.8–11.7) ,0.001
HOMA-IR{ 0.85 (0.82–0.89) 1.31 (1.26–1.37) ,0.001
Total cholesterol (mmol/l) 5.14 (1.15) 5.30 (1.15) 0.020
LDL cholesterol (mmol/l) 3.12 (0.94) 3.40 (0.96) ,0.001
HDL cholesterol (mmol/l) 1.53 (0.44) 1.24 (0.34) ,0.001
Triglycerides (mmol/l){ 0.99 (0.94–1.04) 1.57 (1.49–1.65) ,0.001
CRP (mg/l){ 0.60 (0.55–0.65) 1.35 (1.24–1.46) ,0.001
IL-6 (pg/ml){ 1.19 (1.12–1.26) 1.66 (1.57–1.75) ,0.001
Pvalue was calculated after adjustment for age and sex. Data are arithmetic mean (SD). Percentages may not sum to 100 because of rounding. *Data not adjusted for itself.
{
Table 2.Characteristics of ion concentrations in study participants.
Overweight/obesity Metabolic syndrome Type 2 diabetes
No (n = 460) Yes (n = 516) No (n = 577) Yes (n = 399) No (n = 854) Yes (n = 122)
Age (yrs)* 45.8 (5.5) 46.0 (5.3) 45.4 (5.5) 46.7 (5.1){ 45.9 (5.4) 46.2 (5.3)
Men (n, %)* 149 (32.4) 207 (40.1){ 188 (32.6) 168 (42.1){ 304 (35.6) 52 (42.6)
BMI (kg/m2) 21.0 (1.4) 27.9 (2.6){ 22.6 (3.2) 27.6 (3.2){ 24.2 (3.9) 27.2 (4.0){
Ca (ppm){ 6.46 (6.39–6.54) 6.54 (6.46–6.62) 6.50 (6.44–6.58) 6.49 (6.40–6.59) 6.51 (6.45–6.57) 6.47 (6.33–6.62)
Cr (ppb){ 0.70 (0.49–0.99) 0.75 (0.54–1.04) 0.52 (0.38–0.72) 1.15 (0.81–1.64){ 0.66 (0.51–0.85) 1.42 (0.77–2.60){
Cu (ppb){ 629.7 (613.7–646.1) 657.3 (640.6–674.5){ 630.7 (616.2–645.6) 664.0 (644.9–683.7){ 639.4 (627.2–651.9) 678.0 (641.8–716.4){
Fe (ppb){ 818.5 (779.8–859.2) 910.2 (870.0–952.3){ 847.2 (810.9–885.1) 893.4 (849.2–939.8) 859.6 (829.2–891.2) 909.9 (837.9–988.1)
K (ppm){ 413.0 (403.0–423.2) 410.6 (401.4–420.0) 412.2 (403.3–421.3) 411.0 (400.6–421.6) 411.1 (403.8–418.5) 416.0 (398.0–434.8)
Mg (ppm){ 18.7 (18.5–18.8) 18.4 (18.3–18.6){ 18.6 (18.5–18.8) 18.4 (18.2–18.6){ 18.6 (18.5–18.8) 18.0 (17.6–18.4){
Mn (ppb){ 1.24 (1.04–1.49) 1.42 (1.23–1.64) 1.24 (1.06–1.44) 1.49 (1.26–1.76) 1.31 (1.16–1.48) 1.52 (1.15–2.01)
Mo (ppb){ 0.76 (0.62–0.94) 0.68 (0.55–0.82) 0.76 (0.63–0.90) 0.66 (0.52–0.84) 0.71 (0.61–0.83) 0.75 (0.51–1.09)
P (ppm){ 75.6 (74.4–76.7) 77.7 (76.6–78.8){ 74.9 (74.0–75.9) 79.3 (77.9–80.7){ 76.3 (75.5–77.2) 79.3 (76.8–81.8){
Re (ppb){ 0.07 (0.07–0.08) 0.08 (0.07–0.08) 0.07 (0.07–0.08) 0.07 (0.07–0.08) 0.08 (0.07–0.08) 0.07 (0.06–0.07){
S (ppm){ 1012.2 (1003.4–1021.1) 1029.1 (1019.7–1038.5){ 1015.2 (1007.3–1023.1) 1029.7 (1018.7–1040.8){ 1018.5 (1011.7–1025.4) 1039.4 (1020.2–1059.1){
Sb (ppb){ 0.50 (0.40–0.62) 0.38 (0.30–0.48) 0.40 (0.32–0.49) 0.49 (0.38–0.62) 0.42 (0.35–0.50) 0.55 (0.37–0.82)
Se (ppb){ 95.3 (93.7–96.9) 96.8 (95.1–98.4) 94.9 (93.4–96.4) 97.8 (95.9–99.7){ 95.6 (94.4–96.8) 99.5 (95.6–103.5){
Sn (ppb){ 0.91 (0.87–0.95) 0.93 (0.89–0.98) 0.90 (0.87–0.94) 0.95 (0.91–1.00) 0.93 (0.90–0.96) 0.89 (0.82–0.97)
Sr (ppb){ 32.3 (31.5–33.2) 34.0 (33.1–34.8){ 32.5 (31.7–33.2) 34.2 (33.2–35.3){ 33.2 (32.5–33.8) 33.2 (31.7–34.7)
Ti (ppb){ 139.8 (138.6–141.1) 140.4 (139.1–141.8) 139.8 (138.7–140.9) 140.6 (139.1–142.2) 139.9 (139.0–140.9) 141.5 (139.1–144.1)
Zn (ppb){ 389.6 (379.2–400.4) 404.7 (394.5–415.2) 393.8 (384.8–403.1) 402.9 (390.7–415.5) 397.5 (389.4–405.6) 398.1 (380.9–415.9)
Data are arithmetic mean (SD). *Data not adjusted for itself. {
Data are geometric mean (95% CI). {
Pvalue,0.05 between 2 groups after adjustment for age and sex. Percentages may not sum to 100 because of rounding. doi:10.1371/journal.pone.0038845.t002
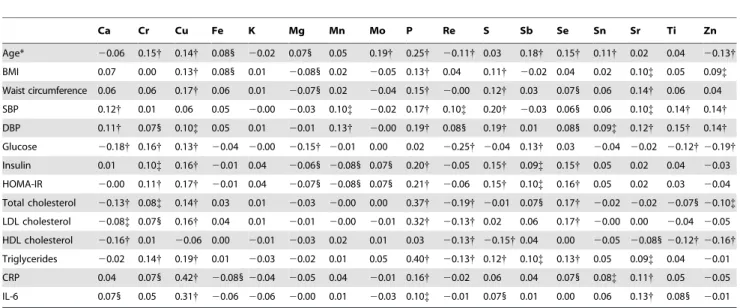
Table 3.Partial spearman correlation coefficients between ions and metabolic features and inflammatory markers (n = 976).
Ca Cr Cu Fe K Mg Mn Mo P Re S Sb Se Sn Sr Ti Zn
Age* 20.06 0.15{ 0.14{ 0.081 20.02 0.071 0.05 0.19{ 0.25{ 20.11{ 0.03 0.18{ 0.15{ 0.11{ 0.02 0.04 20.13{
BMI 0.07 0.00 0.13{ 0.081 0.01 20.081 0.02 20.05 0.13{ 0.04 0.11{ 20.02 0.04 0.02 0.10{ 0.05 0.09{
Waist circumference 0.06 0.06 0.17{ 0.06 0.01 20.071 0.02 20.04 0.15{ 20.00 0.12{ 0.03 0.071 0.06 0.14{ 0.06 0.04
SBP 0.12{ 0.01 0.06 0.05 20.00 20.03 0.10{ 20.02 0.17{ 0.10{ 0.20{ 20.03 0.061 0.06 0.10{ 0.14{ 0.14{
DBP 0.11{ 0.071 0.10{ 0.05 0.01 20.01 0.13{ 20.00 0.19{ 0.081 0.19{ 0.01 0.081 0.09{ 0.12{ 0.15{ 0.14{
Glucose 20.18{ 0.16{ 0.13{ 20.04 20.00 20.15{ 20.01 0.00 0.02 20.25{ 20.04 0.13{ 0.03 20.04 20.02 20.12{20.19{
Insulin 0.01 0.10{ 0.16{ 20.01 0.04 20.061 20.081 0.071 0.20{ 20.05 0.15{ 0.09{ 0.15{ 0.05 0.02 0.04 20.03
HOMA-IR 20.00 0.11{ 0.17{ 20.01 0.04 20.071 20.081 0.071 0.21{ 20.06 0.15{ 0.10{ 0.16{ 0.05 0.02 0.03 20.04
Total cholesterol 20.13{ 0.08{ 0.14{ 0.03 0.01 20.03 20.00 0.00 0.37{ 20.19{ 20.01 0.071 0.17{ 20.02 20.02 20.07120.10{
LDL cholesterol 20.08{ 0.071 0.16{ 0.04 0.01 20.01 20.00 20.01 0.32{ 20.13{ 0.02 0.06 0.17{ 20.00 0.00 20.04 20.05
HDL cholesterol 20.16{ 0.01 20.06 0.00 20.01 20.03 0.02 0.01 0.03 20.13{ 20.15{0.04 0.00 20.05 20.08120.12{20.16{
Triglycerides 20.02 0.14{ 0.19{ 0.01 20.03 20.02 0.01 0.05 0.40{ 20.13{ 0.12{ 0.10{ 0.13{ 0.05 0.09{ 0.04 20.01
CRP 0.04 0.071 0.42{ 20.08120.04 20.05 0.04 20.01 0.16{ 20.02 0.06 0.04 0.071 0.08{ 0.11{ 0.05 20.05
IL-6 0.071 0.05 0.31{ 20.06 20.06 20.00 0.01 20.03 0.10{ 20.01 0.071 0.01 0.00 0.06 0.13{ 0.081 20.01
All correlation coefficients were calculated after adjustment for age and sex. *Data not adjusted for itself.
{
P,0.001, {
P,0.01, 1
P,0.05.
Step 1: Scoring ion modules. An ion module was defined as an ion set. We exhausted all possible combinations with number of
ions from 1 to 8. There were P 8
i~1 Ci
17~65,535such ion modules.
Given a particular ion module M, let X represent its vector of scores over the samples, and let Y represent the corresponding vector of class labels (disease or normal). To derive a, expression values gij were normalized to z-transformed scores zijwhich for
each ion i had meanm= 0 and standard deviationd= 1 over all samples j.
The individual zijof each member ion in the ion module were
averaged into a combined z-score, which was designated as xj.
Many statistical methods, such as thetor Wilcoxon score, could be used to score the relationship between X and Y. In this study, we defined the conditional mutual information between X and Y
I Xð ;YDZÞ~H X,Zð ÞzH Y,Zð Þ{H X,Y,Zð Þ{H Zð Þ
Where X, Y and Z enumerate values of ion module levels, metabolic disorders and adjust variables, respectively. H was the entropy of the empirical probability distribution. To derive a’ from a, activity levels were discredited into [log 2(#of samples)+1] = 11 equally spaced bins [31].
significance of ion modules was selected to satisfy the permutation tests withP,0.001, according to the null distributions of S.
Step 3: Identifying disease related ion network. After obtained those ion modules that were significantly associated with metabolic abnormalities, we identified three ion networks to illustrate the pattern of ion cooperation. For ionxwhich was ink
significant ion modules, the combined score using Fisher’s method [33,34,35] was
Scorex~{2 Xk
i~1
loge(pi)
Wherepiwas the permutation p-value for ion moduleiwhich has ion x. Scorex had a chi-square distribution with 2k degrees of freedom, wherekwas the number of tests being combined.
Within the significant ion module, each two ions were considered as possible edge. So each ion module was a full connected module. All the significant ion modules formed the candidate network. In the network, each edge had a score. For edge between ion x and ion y, the score was
Scoree(x,y)~ScorexzScorey
To identify the maximum scored subnetwork, we used a greedy edge expansion algorithm by growing from every locally maximal scored edge whose score was larger than its adjacency [33]. Every growing new edge would get a probability by a hypergeometric distribution:
p~eP
{1
i~0 r{i E{i
HereEwas the number of edges in the candidate network ande
was how many edges had already been included during extension. This value was used to measure the probability to get an edge with higher rank thanrfrom the totalEedges when we obtained the r-rank at present step. The probability equals to 1 when all edges were selected and there was a minimum with the increase ofe. The minimum one was used as our cutoff to terminate the growth procedure. In this way, the most of significant subnetwork were selected as the identified metabolic outcome related ion network. To study the module structure of ions, the combined score of ion set was defined as X~fx1,x2 xng using Fisher’s method
[33,34,35]
ScoreX~fx1,x2xng~{2
Xk
i~1
loge(pi)
where pi was the permutation p-value for ion module i which
included ion setX~fx1,x2 xng.
Results
Characteristics of Ion Concentrations in the Study Population
The study population included 516 overweight/obese and 460 normal-weight participants. The mean BMI values were 27.962.6 kg/m2and 21.061.4 kg/m2for overweight/obese and normal-weight participants, respectively (P,0.001). The
preva-lence were 40.9% (n = 399) for metabolic syndrome and 12.5% (n = 122) for type 2 diabetes in the study population.
Compared with those of normal-weight subjects, overweight/ obese participants were more likely to be male, with lower educational attainment and higher prevalence of metabolic syndrome and type 2 diabetes (allP,0.05;Table 1). They also exhibited higher values of waist circumference, blood pressure, glucose, insulin, HOMA-IR, total cholesterol, LDL cholesterol, triglycerides, CRP and IL-6, and lower HDL cholesterol concentration (allP,0.05).
As shown in Table 2, compared to the normal groups, all groups with obesity, metabolic syndrome or type 2 diabetes had elevated levels of Cu, P and S, but lower Mg concentration, after adjusting for age and sex. In addition, participants with overweight/obesity, metabolic syndrome and type 2 diabetes also appeared to have higher levels of Fe and Sr, Cr, Se and Sr, or Cr and Se.
Plasma Cu and P levels were positively associated with most of the metabolic traits listed inTable 3. In addition, plasma levels of Ca, Cr, Mg, Re, Sb, Ti and Zn were also significantly correlated with fasting glucose levels while concentrations of Cr, Re, S, Se and Sr were significantly correlated with triglyceride levels. Notably, strong positive correlations were observed between Cu and CRP (r= 0.42) and also between Cu and IL-6 (r= 0.31) after adjusting for age and sex (allP,0.001). Other ions such as P and Sr were also significantly correlated with inflammatory markers (all
P,0.05).
Metabolic Disorders Related Ion Modules and Networks
There were 50, 60 and 38 ion modules associated with overweight/obesity, metabolic syndrome and type 2 diabetes with exact permutation P-value,0.001, respectively. The number of exact permutation is 65,535 ion modules with overweight/obesity, metabolic syndrome and type 2 diabetes. The complete exact permutationPvalue (,0.01) list of ion modules with overweight/ obesity, metabolic syndrome and type 2 diabetes were presented in Table S5,Table S6andTable S7.
The overweight/obesity, type 2 diabetes and metabolic syndrome related ion networks were shown in Figure 1. The Fisher score of 68 edges between connected ions in those three networks were also demonstrated inTable S8, Table S9 and Table S10. Among the 68 edges of all three networks, Cu-P ranked in the first, suggesting the strongest connected ion pair (Tables S8, S9, and S10). While Cu-Zn, a previously well studied ion pair, ranked 14th among 68 edges of overweight/ obesity network (Table S8), 17th
among 68 edges of metabolic syndrome network (Table S9), and 19thamong 68 edges of type 2 diabetes network (Table S10).
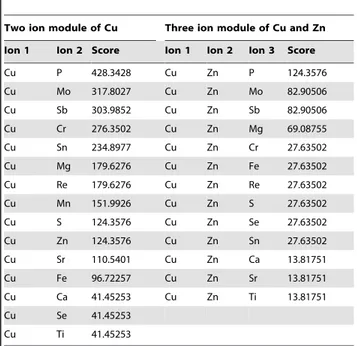
To show the effects of highly connected ion modules, we calculated the combined Fisher score for two ion modules and three ion modules (Table S11).Table 4,Table 5andTable 6 showed that two ion modules contained Cu and three ion modules contained Cu-Zn were associated with overweight/obesity, metabolic syndrome and type 2 diabetes (extracted fromTable S11). The Cu-P module scored the highest in all two ion modules of Cu. While in three ion modules of Cu-Zn, the Cu-Zn-P module scored the highest for both overweight/obesity and metabolic syndrome, and the Cu-Zn-Mg module scored the highest for type 2 diabetes.
Postulated Ion Patterns in Association with Metabolic Disorders
diabetes, respectively. Plasma levels of Cr, Cu, K and Mo were significantly associated with overweight/obesity; plasma levels of K, P, Cu, Mo and Cr were significantly associated with metabolic syndrome; plasma levels of Cr, K, Mo, Cu and P were significantly associated with type 2 diabetes (allP,0.05). Ranks of ions in the networks were also displayed inFigure 1. Comparing the rank of ion effect in individual and in network associated with metabolic disorders, three ion patterns were postulated: (1) ‘‘Individual ion’’ was defined as the rank of ion in the network posterior to that of single one, including K and Cr. Those ions were prone to affect metabolic disorders in individual ways; (2) ‘‘Module ion’’ was defined as the rank of ion in network prior to that of single ion, which was prone to affect metabolic disorders in combination with other ions. Fe was not significantly associated with type 2 diabetes, but always occurred in diabetes associated ion modules; and (3) ‘‘Module-individual ion’’, in that situation ion like Cu ranked equivalently in individual and in network associated with obesity.
Discussion
To our best knowledge, this was the first study to utilize the novel approach of ionomics with mutual information to investigate simultaneously single ion and multiple ions that were represented by ion modules/networks and the associations with metabolic abnormalities in human population. Three constructed ion networks were found to be associated specifically with obesity, metabolic syndrome and type 2 diabetes. Effects of ion(s) could be postulated as ‘‘Individual ion’’, ‘‘Module ion’’ and ‘‘Module-individual ion’’, suggesting potential associations of different ions and/or ion modules/networks with the metabolic risks in the Chinese population.
In this study, using ionomic approach, instead of individual ion, we revealed not only the complicated relationships of ion, ion-phenotypes including obesity, metabolic syndrome and type 2 diabetes, but also specific ion modules/networks, which linked with different stages in obesity related metabolic disorders. Previously, individual role of specific ions like Fe and Zn in the
pathogenesis of metabolic disorders have been broadly investigat-ed in cross-sectional studies, prospective studies, and even clinical trials [1,2,7,11,36]. More recently, some of investigators have used Mass Spectrometry and Atomic Absorption Spectroscopy to measure multi-ions. They also compared individual ion concen-trations between obese or diabetic cases and obese or non-Table 4.Two ion module of Cu and three ion module of Cu
and Zn in overweight/obesity.
Two ion module of Cu Three ion module of Cu and Zn
Ion 1 Ion 2 Score Ion 1 Ion 2 Ion 3 Score
Cu P 428.3428 Cu Zn P 124.3576
Cu Mo 317.8027 Cu Zn Mo 82.90506
Cu Sb 303.9852 Cu Zn Sb 82.90506
Cu Cr 276.3502 Cu Zn Mg 69.08755
Cu Sn 234.8977 Cu Zn Cr 27.63502
Cu Mg 179.6276 Cu Zn Fe 27.63502
Cu Re 179.6276 Cu Zn Re 27.63502
Cu Mn 151.9926 Cu Zn S 27.63502
Cu S 124.3576 Cu Zn Se 27.63502
Cu Zn 124.3576 Cu Zn Sn 27.63502
Cu Sr 110.5401 Cu Zn Ca 13.81751
Cu Fe 96.72257 Cu Zn Sr 13.81751
Cu Ca 41.45253 Cu Zn Ti 13.81751
Cu Se 41.45253
Cu Ti 41.45253
doi:10.1371/journal.pone.0038845.t004
Table 5.Two ion module of Cu and three ion module of Cu and Zn in metabolic syndrome.
Two ion module of Cu Three ion module of Cu and Zn
Ion 1 Ion 2 Score Ion 1 Ion 2 Ion 3 Score
Cu P 317.8027 Cu Zn P 124.3576
Cu Cr 221.0802 Cu Zn Cr 69.08755
Cu Mo 179.6276 Cu Zn Mo 69.08755
Cu Sn 165.8101 Cu Zn S 69.08755
Cu Sb 151.9926 Cu Zn Mg 41.45253
Cu Zn 138.1751 Cu Zn Re 41.45253
Cu Mg 124.3576 Cu Zn Se 41.45253
Cu Mn 124.3576 Cu Zn Sn 41.45253
Cu Re 124.3576 Cu Zn Sr 41.45253
Cu S 110.5401 Cu Zn Ca 27.63502
Cu Fe 69.08755 Cu Zn Fe 27.63502
Cu Sr 69.08755 Cu Zn Sb 27.63502
Cu Se 55.27004 Cu Zn Mn 13.81751
Cu Ca 41.45253
Cu Ti 41.45253
Cu K 27.63502
doi:10.1371/journal.pone.0038845.t005
Table 6.Two ion module of Cu and three ion module of Cu and Zn in Type 2 diabetes.
Two ion module of Cu Three ion module of Cu and Zn
Ion 1 Ion 2 score Ion 1 Ion 2 Ion 3 Score
Cu P 221.0802 Cu Zn Mg 55.27004
Cu Cr 151.9926 Cu Zn P 55.27004
Cu Sn 138.1751 Cu Zn Ca 41.45253
Cu Mo 96.72257 Cu Zn Cr 41.45253
Cu Sr 96.72257 Cu Zn S 41.45253
Cu Mg 82.90506 Cu Zn Sb 41.45253
Cu Mn 82.90506 Cu Zn Sn 41.45253
Cu S 82.90506 Cu Zn Mo 27.63502
Cu Sb 82.90506 Cu Zn Fe 13.81751
Cu Zn 82.90506 Cu Zn Mn 13.81751
Cu Fe 69.08755 Cu Zn Re 13.81751
Cu Re 69.08755 Cu Zn Se 13.81751
Cu Ca 41.45253 Cu Zn Sr 13.81751
Cu Se 41.45253
Cu K 27.63502
Cu Ti 13.81751
diabetic controls [37,38,39,40,41], as well as between diabetic patients with and without metabolic alterations [38]. However, it still remains unknown regarding the cluster effect of ion modules/ networks on obesity and related metabolic disorders. Indeed, it was noticed previously that multiple ions may interact synergistically or antagonistically and consequently influence overall ion homeostasis [13,14]. Moreover, a specific ion when presented alone or in a combination with other ion(s) may have different impact on metabolic outcomes. Therefore, although the ionomic approach provides a great opportunity to study the global effect of multi-ions, it also becomes a big challenge to elucidate complicated relationships and mechanistic linking between multiple ions and metabolic disorders.
To better explore the complex associations between ionomic profile and different stages of metabolic abnormalities in population level, we employed a novel machine learning data processing approach, namely mutual information in the present study. In many prior studies, paired Student’s t test, Mann–Whitney U-test or ANOVA have been frequently used to compare ion concentrations in different groups [37,38,39,40,41,42]. One study also adopted PCA analysis to explore relationships of metals/metalloids with clinical parameters [42]. Although PCA analysis was admittedly useful to construct patterns from high dimension data, the linear dependence nature of this approach might lose information [21] and could not describe adequately for the non-linear dependences resulting from synergistic or antagonistic interactions within ion modules/networks [13,14]. On the other hand, the mutual information that measures the general dependence including both linear and non-linear dependences [24,25], may allow us to discover specific ionomic fingerprints attributing to different metabolic outcomes. Indeed, with this approach, three specific ion networks were constructed to reflect stages of obesity, metabolic syndrome and type 2 diabetes. Certainly, more prospective studies are merited to confirm our findings.
Another noteworthy finding of this study is that we characterized ion modules/networks as ‘‘Individual ion’’, ‘‘Module ion’’ and ‘‘Module-individual ion’’, implicating that the role of a specific ion in the pathogenesis of metabolic disorders may vary according to whether single ion or ions in modules/networks were included in the data analysis. For instance, Feper sewas not significantly associated with type 2 diabetes, while it ranked 3rd in the ion networks associated with type 2 diabetes. Previously, we have observed that high Fe load, indicated by elevated circulating ferritin, was significantly associated with type 2 diabetes in Chinese population [43]. Prospective studies conducted in Western populations also demonstrated a predictive role of ferritin level in the onset of type 2 diabetes [1,2]. The discrepancy between the current study and earlier studies might be due to the fact that Fe was used as an ion form rather than its protein biomarker like ferritin. However, given the nature of complicating interactions between Fe and other ions, such as Cu and Zn [13,14], it needs to be clarified whether Fe in a specific ion module might act additively or synergistically with other ions to influence overall risk of type 2 diabetes.
Another interesting phenomenon was that both Cu and P were always ranked in the top two positions among 17 ions included in the three specific ion networks related to obesity, metabolic syndrome and type 2 diabetes, implicating potential associations of Cu and P with these metabolic disorders. Indeed, increased level of Cu was observed in diabetic patients [44]; while administration of Cu chelating reduced insulin resistance and also alleviated glucose intolerance in diabetic db/db mice [45]. In addition, high serum P level was reported to be positively associated with hypercholester-olemia and subclinical atherosclerosis [46], and might predict cardiovascular mortality in type 2 diabetes [47]. Besides its role as a single mineral, Cu also exhibits multiple mechanisms in
regulating ion homeostasis under physical and pathological conditions. For examples, Cu could interact with Fe in the processes of absorption, transportation and metabolism in multiple tissues and cells, which may be modified by the amount and ratio of each ions and likewise the overall interaction might also influence whole body Cu-Fe homeostasis and related health or disease conditions [13]. Moreover, the Cu-Mo interaction was also suggested as a reaction between thiomolybdate and Cu by studies in animal model and human tissue [48,49]. Significantly different levels of Cu-Zn-superoxide dismutase (CuZn-SOD), a form of Cu and Zn, were also reported between obese and non-obese controls [50]. In addition, the Cu/Zn ratio was reported to be associated with multiple abnormalities and diseases [51,52,53,54,55]. Re-garding to P, the co-joint effect of P and Ca on increasing total mortality of middle-aged men was reported in a Sweden cohort [56], in line with adverse role of P contained ion modules in metabolic disorders.
Although current study could not provide direct evidence for the mechanistic link between plasma ions and metabolic disorders, there are plausible explanations. First, several measured ions such as Fe, Cu, Cr, Zn and Se were previously reported to be involved in the induction or defense of oxidative stress [57,58]. Second, genetic variants of several ions were shown to be associated with diabetes. For instance, TMPRSS6 variants were significantly associated with ferritin and risk of type 2 diabetes in Chinese [59], while ferritin itself was an independent risk factor for metabolic syndrome and type 2 diabetes [1,2,43]. However, we observed significantly lower intake of multiple ions in subjects with metabolic disorders (Zn, Se, Mg, Ca, P and K in overweight/ obesity, Zn, Ca and P in metabolic syndrome, as well as Mg, Ca, P and K in diabetes, data not shown) in comparison with their normal counterparts, although the influence of intake levels on plasma ion concentrations remains unclear. Moreover, the strong correlations between plasma Cu levels and inflammatory markers suggest that the association between Cu levels and metabolic disorders might be partially explained by inflammatory status [60]. Therefore, the complicated network and potential mechanistic linking between multiple ions and metabolic disorders merit further investigation.
Overall, by using the novel approach of the ionomics strategy and the information theory, we observed potential links between multiple ions and metabolic abnormalities. However, since our findings were mainly driven by statistical analysis, future biological and mechanistic studies are needed to confirm the observed associations. Moreover, the cross-sectional nature of this study also prevents us from establishing causal relation. Meanwhile, the case-control design might also limit our findings to be generalized in general populations. Certainly, more prospective studies are merited in this regards. Nonetheless, our study attempts to use a different methodology to explore the associations between multiple ions and metabolic disorders in a large-scale population based study.
Supporting Information
Table S1 Optimum Operating Conditions for ICP-MS. (DOC)
Table S2 The comparison of determined values of human serum with reference values.
(DOC)
Table S3 The recovery of determined elements in human plasma.
Table S4 Stability of the instrument and precision of the method.
(DOC)
Table S5 The exact permutation P values of ion combinations with overweight/obesity.
(DOC)
Table S6 The exact permutation P values of ion combinations with metabolic syndrome.
(DOC)
Table S7 The exact permutation P values of ion combinations with Type 2 diabetes.
(DOC)
Table S8 The overweight/obesity related ion network. (DOC)
Table S9 The metabolic syndrome related ion network.
(DOC)
Table S10 The type 2 diabetes related ion network. (DOC)
Table S11 The highly connected two ion and three ion modules.
(DOC)
Acknowledgments
We are grateful to all participants in the study. We also thank Ms. Jinna Chang and Dr. Dengyun Chen at Life Science and Chemical Analysis Group in Agilent Technologies Co., Ltd. for ICP-MS onsite assistance, the members at the laboratory from F.W., X.L and Y.L. laboratories, and the colleagues at the local centers for Disease Control of Shanghai.
Author Contributions
Conceived and designed the experiments: FW XL YL. Performed the experiments: YY PA JX HS MJ LS DY ZY HL. Analyzed the data: TH LS YY DY ZY. Wrote the paper: LS TH YY FW. Revised the manuscript: LS TH YY LC YL XL FW.
References
1. Jiang R, Manson JE, Meigs JB, Ma J, Rifai N, et al. (2004) Body iron stores in relation to risk of type 2 diabetes in apparently healthy women. JAMA 291: 711– 717.
2. Forouhi NG, Harding AH, Allison M, Sandhu MS, Welch A, et al. (2007) Elevated serum ferritin levels predict new-onset type 2 diabetes: results from the EPIC-Norfolk prospective study. Diabetologia 50: 949–956.
3. Fumeron F, Pean F, Driss F, Balkau B, Tichet J, et al. (2006) Ferritin and transferrin are both predictive of the onset of hyperglycemia in men and women over 3 years: the data from an epidemiological study on the Insulin Resistance Syndrome (DESIR) study. Diabetes Care 29: 2090–2094.
4. Kao WH, Folsom AR, Nieto FJ, Mo JP, Watson RL, et al. (1999) Serum and dietary magnesium and the risk for type 2 diabetes mellitus: the Atherosclerosis Risk in Communities Study. Arch Intern Med 159: 2151–2159.
5. Guerrero-Romero F, Rodriguez-Moran M (2002) Low serum magnesium levels and metabolic syndrome. Acta Diabetol 39: 209–213.
6. Pittas AG, Dawson-Hughes B, Li T, Van Dam RM, Willett WC, et al. (2006) Vitamin D and calcium intake in relation to type 2 diabetes in women. Diabetes Care 29: 650–656.
7. Sun Q, van Dam RM, Willett WC, Hu FB (2009) Prospective study of zinc intake and risk of type 2 diabetes in women. Diabetes Care 32: 629–634. 8. Schulze MB, Schulz M, Heidemann C, Schienkiewitz A, Hoffmann K, et al.
(2007) Fiber and magnesium intake and incidence of type 2 diabetes: a prospective study and meta-analysis. Arch Intern Med 167: 956–965. 9. Villegas R, Gao YT, Dai Q, Yang G, Cai H, et al. (2009) Dietary calcium and
magnesium intakes and the risk of type 2 diabetes: the Shanghai Women’s Health Study. Am J Clin Nutr 89: 1059–1067.
10. Hopping BN, Erber E, Grandinetti A, Verheus M, Kolonel LN, et al. (2010) Dietary fiber, magnesium, and glycemic load alter risk of type 2 diabetes in a multiethnic cohort in Hawaii. J Nutr 140: 68–74.
11. Marreiro DN, Geloneze B, Tambascia MA, Lerario AC, Halpern A, et al. (2006) Effect of zinc supplementation on serum leptin levels and insulin resistance of obese women. Biol Trace Elem Res 112: 109–118.
12. Pittas AG, Harris SS, Stark PC, Dawson-Hughes B (2007) The effects of calcium and vitamin D supplementation on blood glucose and markers of inflammation in nondiabetic adults. Diabetes Care 30: 980–986.
13. Collins JF, Prohaska JR, Knutson MD (2010) Metabolic crossroads of iron and copper. Nutr Rev 68: 133–147.
14. Deng Z, Dailey LA, Soukup J, Stonehuerner J, Richards JD, et al. (2009) Zinc transport by respiratory epithelial cells and interaction with iron homeostasis. Biometals 22: 803–815.
15. Zhao T, Chen T, Qiu Y, Zou X, Li X, et al. (2009) Trace element profiling using inductively coupled plasma mass spectrometry and its application in an osteoarthritis study. Anal Chem 81: 3683–3692.
16. Lahner B, Gong J, Mahmoudian M, Smith EL, Abid KB, et al. (2003) Genomic scale profiling of nutrient and trace elements in Arabidopsis thaliana. Nat Biotechnol 21: 1215–1221.
17. Outten CE, O’Halloran TV (2001) Femtomolar sensitivity of metalloregulatory proteins controlling zinc homeostasis. Science 292: 2488–2492.
18. Szpunar J (2004) Metallomics: a new frontier in analytical chemistry. Anal Bioanal Chem 378: 54–56.
19. Rea PA (2003) Ion genomics. Nat Biotechnol 21: 1149–1151.
20. Salt DE (2004) Update on plant ionomics. Plant Physiol 136: 2451–2456. 21. Demartines P, He´rault J (1993) Vector Quantization and Projection neural
network. In: Mira J, Cabestany J, Prieto A, editors. New Trends in Neural Computation: International Workshop on Artificial Neural Networks, IWANN
’93, Proceedings - Lecture Notes in Computer Science v 686. Sitges: Springer Verlag. 328–333.
22. Chaitin GJ (1975) A theory of program size formally identical to information theory. Journal of the ACM 22: 329–340.
23. Shannon CE (1948) A mathematical theory of communication. Bell System Technical Journal 27: 379–424, 623–656.
24. Li W (1990) Mutual information functions versus correlation functions. Journal of Statistical Physics 60: 823–837.
25. Kumar PT, Vinod PT, Phoha VV, Iyengar SS, Iyengar P (2011) Design of a smart biomarker for bioremediation: a machine learning approach. Comput Biol Med 41: 357–360.
26. Margolin AA, Nemenman I, Basso K, Wiggins C, Stolovitzky G, et al. (2006) ARACNE: an algorithm for the reconstruction of gene regulatory networks in a mammalian cellular context. BMC Bioinformatics 7 Suppl 1: S7.
27. Peng H, Long F, Ding C (2005) Feature selection based on mutual information: criteria of max-dependency, max-relevance, and min-redundancy. IEEE Trans Pattern Anal Mach Intell 27: 1226–1238.
28. Szymczak S, Nuzzo A, Fuchsberger C, Schwarz DF, Ziegler A, et al. (2007) Genetic association studies for gene expressions: permutation-based mutual information in a comparison with standard ANOVA and as a novel approach for feature selection. BMC Proc 1 Suppl 1: S9.
29. Sun L, Yu Z, Ye X, Zou S, Li H, et al. (2010) A marker of endotoxemia is associated with obesity and related metabolic disorders in apparently healthy Chinese. Diabetes Care 33: 1925–1932.
30. Grundy SM, Cleeman JI, Daniels SR, Donato KA, Eckel RH, et al. (2005) Diagnosis and management of the metabolic syndrome: an American Heart Association/National Heart, Lung, and Blood Institute Scientific Statement: Executive Summary. Circulation 112: e285-e290.
31. Tourassi GD, Frederick ED, Markey MK, Floyd CE, Jr. (2001) Application of the mutual information criterion for feature selection in computer-aided diagnosis. Med Phys 28: 2394–2402.
32. Phipson B, Smyth GK (2010) Permutation P-values should never be zero: calculating exact P-values when permutations are randomly drawn. Stat Appl Genet Mol Biol 9: Article39.
33. Liu ZP, Wang Y, Zhang XS, Xia W, Chen L (2011) Detecting and analyzing differentially activated pathways in brain regions of Alzheimer’s disease patients. Mol Biosyst 7: 1441–1452.
34. Huang T, Liu L, Liu Q, Ding G, Tan Y, et al. (2011) The role of Hepatitis C Virus in the dynamic protein interaction networks of hepatocellular cirrhosis and carcinoma. Int J Comput Biol Drug Des 4: 5–18.
35. Fisher RA (1948) Combining independent tests of significance. American Statistician 2: 30.
36. Salonen JT, Tuomainen TP, Nyyssonen K, Lakka HM, Punnonen K (1998) Relation between iron stores and non-insulin dependent diabetes in men: case-control study. BMJ 317: 727.
37. Skalnaya MG, Demidov VA (2007) Hair trace element contents in women with obesity and type 2 diabetes. J Trace Elem Med Biol 21 Suppl 1: 59–61. 38. Aguilar MV, Saavedra P, Arrieta FJ, Mateos CJ, Gonzalez MJ, et al. (2007)
Plasma mineral content in type-2 diabetic patients and their association with the metabolic syndrome. Ann Nutr Metab 51: 402–406.
40. Al-Saleh E, Nandakumaran M, Al-Rashdan I, Al-Harmi J, Al-Shammari M (2007) Maternal-foetal status of copper, iron, molybdenum, selenium and zinc in obese gestational diabetic pregnancies. Acta Diabetol 44: 106–113.
41. Kazi TG, Afridi HI, Kazi N, Jamali MK, Arain MB, et al. (2008) Copper, chromium, manganese, iron, nickel, and zinc levels in biological samples of diabetes mellitus patients. Biol Trace Elem Res 122: 1–18.
42. Flores CR, Puga MP, Wrobel K, Garay Sevilla ME (2011) Trace elements status in diabetes mellitus type 2: possible role of the interaction between molybdenum and copper in the progress of typical complications. Diabetes Res Clin Pract 91: 333–341.
43. Sun L, Franco OH, Hu FB, Cai L, Yu Z, et al. (2008) Ferritin concentrations, metabolic syndrome, and type 2 diabetes in middle-aged and elderly chinese. J Clin Endocrinol Metab 93: 4690–4696.
44. Viktorinova A, Toserova E, Krizko M, Durackova Z (2009) Altered metabolism of copper, zinc, and magnesium is associated with increased levels of glycated hemoglobin in patients with diabetes mellitus. Metabolism 58: 1477–1482. 45. Tanaka A, Kaneto H, Miyatsuka T, Yamamoto K, Yoshiuchi K, et al. (2009)
Role of copper ion in the pathogenesis of type 2 diabetes. Endocr J 56: 699–706. 46. Onufrak SJ, Bellasi A, Shaw LJ, Herzog CA, Cardarelli F, et al. (2008) Phosphorus levels are associated with subclinical atherosclerosis in the general population. Atherosclerosis 199: 424–431.
47. Chonchol M, Dale R, Schrier RW, Estacio R (2009) Serum phosphorus and cardiovascular mortality in type 2 diabetes. Am J Med 122: 380–386. 48. Alvarez HM, Xue Y, Robinson CD, Canalizo-Hernandez MA, Marvin RG, et
al. (2010) Tetrathiomolybdate inhibits copper trafficking proteins through metal cluster formation. Science 327: 331–334.
49. Ogra Y, Komada Y, Suzuki KT (1999) Comparative mechanism and toxicity of tetra- and dithiomolybdates in the removal of copper. J Inorg Biochem 75: 199– 204.
50. Ozata M, Mergen M, Oktenli C, Aydin A, Sanisoglu SY, et al. (2002) Increased oxidative stress and hypozincemia in male obesity. Clin Biochem 35: 627–631.
51. Guo CH, Chen PC, Yeh MS, Hsiung DY, Wang CL (2011) Cu/Zn ratios are associated with nutritional status, oxidative stress, inflammation, and immune abnormalities in patients on peritoneal dialysis. Clin Biochem 44: 275–280. 52. Malavolta M, Giacconi R, Piacenza F, Santarelli L, Cipriano C, et al. (2010)
Plasma copper/zinc ratio: an inflammatory/nutritional biomarker as predictor of all-cause mortality in elderly population. Biogerontology 11: 309–319. 53. Mezzetti A, Pierdomenico SD, Costantini F, Romano F, De Cesare D, et al.
(1998) Copper/zinc ratio and systemic oxidant load: effect of aging and aging-related degenerative diseases. Free Radic Biol Med 25: 676–681.
54. Gozdasoglu S, Akar N (2003) The strong correlation between serum copper level and the copper/zinc ratio to histopathological changes, clinical stage, and prognosis of Hodgkin’s disease. Biol Trace Elem Res 91: 191–192.
55. Jumaan RM (2008) Serum Copper, Zinc and Copper/Zinc Ratio and their Relationship to Age and Growth Status in Yemeni Adolescent Girls. Sultan Qaboos Univ Med J 8: 291–299.
56. Larsson TE, Olauson H, Hagstrom E, Ingelsson E, Arnlov J, et al. (2010) Conjoint effects of serum calcium and phosphate on risk of total, cardiovascular, and noncardiovascular mortality in the community. Arterioscler Thromb Vasc Biol 30: 333–339.
57. Jomova K, Valko M (2011) Advances in metal-induced oxidative stress and human disease. Toxicology 283: 65–87.
58. Naziroglu M (2009) Role of selenium on calcium signaling and oxidative stress-induced molecular pathways in epilepsy. Neurochem Res 34: 2181–2191. 59. Gan W, Guan Y, Wu Q, An P, Zhu J, et al. (2012) Association of TMPRSS6
polymorphisms with ferritin, hemoglobin, and type 2 diabetes risk in a Chinese Han population. Am J Clin Nutr 95: 626–632.